Sunday, April 12, 2026·--:--:--·Istanbul UTC+3·Live
UzEnergyNews
EURASIA'S ENERGY & MARKET INTELLIGENCE
·
BREAKING
Loading latest energy headlines…
🛢 Brent Crude
…
—
🛢 WTI Crude
…
—
🔥 Natural Gas (NG)
…
—
💵 USD/TRY
…
—
💵 USD/UZS
…
—
💵 EUR/USD
…
—
🇪🇺 TTF GAS
…
—
⚡ TOP STORY
Loading top story…
LIVEUzEnergyNews·now
Independent global energy intelligence — anchored in Eurasia, read worldwide.
📘 FLAGSHIP REPORT
Turkic States Energy Outlook 2026
The first single-source comparison of capacity, prices, reform and integration across all eight OTS systems — with an independent 2030/2035 projection. 40 pages · EN/TR.
Read & download →
🆕 NEW · FLAGSHIP REPORT
Emerging Energy Outlook 2026
How the developing world powers its transition — ten economies benchmarked against the EU-27 and OECD on the indicators that price risk: cost of capital, grids, tariffs and carbon. 41 pages · EN/TR.
Read & download →
Latest News
See all →
Analysis & Reports
See all →
⚡ WEEKLY INSIGHT #21 · ARTIFICIAL INTELLIGENCE · ELECTRICITY DEMAND11 October · 16 min read
Artificial Intelligence Capital Expenditure in 2026 and Its Electricity Counterpart: company guidance, nuclear uprate agreements and grid equipment backlogs
Company guidance compiled by Platformonomics sums to 735–750 billion dollars of 2026 capital expenditure for Alphabet, Amazon, Meta and Microsoft, on definitions that differ by company. On the electricity side, the International Energy Agency (IEA) puts global data centre consumption at 485 terawatt-hours in 2025 and 950 terawatt-hours in 2030. Three nuclear uprate agreements announced between 21 September and 6 October 2026 cover about 1,176 megawatts of additional capacity, and on 5 October 2026 the United States Department of Energy (DOE) announced a conditional loan commitment for a further 433 megawatts of uprates contracted to Meta.
UzEnergyNews · Weekly InsightRead full analysis →
⚡ WEEKLY INSIGHT #20 · ELECTRIFICATION · RENEWABLES1 October
23 Per Cent in 2025, 35 Per Cent Proposed for 2035: the IEA electrification measurements, IRENA's tripling and efficiency tracking, and the grid investment values ahead of COP31
UzEnergyNews · EditorialRead →
🔥 WEEKLY INSIGHT #19 · GAS · LNG18 September
Zero LNG Transits Through Hormuz Since 11 July: Europe's storage series, the price readings and the fourth-quarter estimates
UzEnergyNews · EditorialRead →
🛰 LIVE LEAD
now
Read full story →
★ Top Stories
🔥 Trending
📩 Weekly Insight
Every week: one long-form analysis from inside global energy markets — with Eurasian depth.
IEA: Renewable Energy Investment Hits $2 Trillion in 2025 for First Time
iea.org
📊 SHURAApr 8
SHURA Energy Transition Center: Türkiye on Track for Net-Zero by 2053
shura.org.tr
🔥 IEAApr 7
IEA: Natural Gas Demand in Central Asia to Rise 15% by 2030
iea.org
⚡ AAApr 6
Anadolu Agency: Central Asia Energy Corridor Gains New Momentum
aa.com.tr/energy
🌱 IEAApr 5
IEA Data: Solar Now Cheapest Electricity in History — $0.019/kWh Global Average
iea.org
📈 SHURAApr 3
SHURASTAT April 2026: Türkiye Wind Generation Breaks Monthly Record at 8.4 TWh
shura.org.tr
📊 Energy Data Dashboard
Daily Output
214,800
MWh · +3.2% YoY
Active Connections
8.66M
subscribers · +2.5%
Grid Loss
17.2%
H1 2026 · presidency, 21 Jul (2024: ~14%)
2030 Renewables Target
54%
share of mix · 17+ GW pipeline
Installed Capacity
~27,300
MW total
Solar Capacity
3,930
MW · MinEnergy, Jun 2026
Annual Generation
86.7
TWh · 2025 · Ministry of Energy
CO₂ Intensity
430
gCO₂/kWh
🏭 Installed Capacity by Source
Source: MinEnergy UZ · 2025
📈 Annual Electricity Generation (TWh)
Source: UzEnergo · 2016–2025
💰 Electricity Tariff Trend (UZS/kWh)
Source: MinEnergy · 2019–2025
Installed Capacity
115,975
MW total · Source: EPDK
Number of Plants
33,595
active generation units
Electricity Import
2.68M
MWh · Source: TEİAŞ
Electricity Export
3.66M
MWh · net exporter
Wind Capacity
12,864
MW · Source: EPDK
Solar Capacity
19,873
MW · Source: EPDK
Peak Demand
58,712
MW · Source: TEİAŞ
Min Demand
19,201
MW · Source: TEİAŞ
🏭 Electricity Generation Mix
Source: EPDK · 2024
📈 Total Electricity Generation (TWh)
Source: TEİAŞ · 2016–2025
💰 Market Settlement Price — PTF (USD/MWh)
Source: EPİAŞ · 2025
🌱 Renewable Capacity Growth (MW)
Source: EPDK · SHURA · 2016–2025
⚡ Brüt Elektrik Talebi (TWh) — Türkiye 2016–2025
Source: TEİAŞ
Live Markets
🛢️ Oil & Gas
Brent Crude
…
—
WTI Crude
…
—
TTF Gas
…
—
Henry Hub
…
—
⛏️ Commodities
Copper
…
—
Coal (API2)
soon
—
Uranium
soon
—
💱 FX & Regional
USD/UZS
…
—
USD/TRY
…
—
EUR/USD
…
—
EPİAŞ PTF (TR)
soon
—
Live · auto-refreshes every 60s · energy futures via ICE/CME (Yahoo Finance), FX via floatrates.com, EPİAŞ PTF via EPİAŞ Şeffaflık Platformu · change % is daily (vs previous close). Methodology →
⚡ Türkiye Day-Ahead Market — PTF (USD/MWh) · —
Source: EPİAŞ Şeffaflık Platformu · upd —
Avg
—
Peak
—
Trough
—
Zero-price hrs
—
Regulated Retail Tariffs · Regional
⚡ Electricity · USc/kWh (converted at live FX)
Customer
🇺🇿 UZ
🇹🇷 TR
🇰🇿 KZ
🇦🇿 AZ
🇹🇲 TM
🇰🇬 KG
🇭🇺 HU
TRNC
Residential
…
…
…
…
…
…
…
…
Industrial
…
…
…
…
…
…
…
…
Commercial
…
…
…
…
…
…
…
…
🔥 Gas · Uzbekistan (retail)
Residential
1,100 UZS/m³
—
Industrial
2,000 UZS/m³
—
Power plants
1,620 UZS/m³
—
USc/kWh, converted at live FX · Organization of Turkic States: members (UZ, TR, KZ, AZ, KG) + observers (TM, HU, TRNC). VAT-inclusive except KZ (×1.16). KZ = Almaty region · TM at official peg (2017 decree; parallel-market rate far lower) · TRNC billed in TRY · HU industrial/commercial = Eurostat non-household band proxy (bands ID/IB, 2025-S2, all taxes incl. — EU's highest; VAT-excl effective ~22/28¢) · residential = consumption-weighted average across tiers (TR & UZ) · TR = EPDK Apr 2026. Tier thresholds differ by country. Indicative · sources: national regulators · verify before citing. Methodology →
UZENERGYNEWS · DATA
Open Data
Our own public-source datasets, plus a curated directory of open energy data — for analysts, lenders and regulators.
Flagship dataset
The World Electricity Ecosystem, 2025–2050
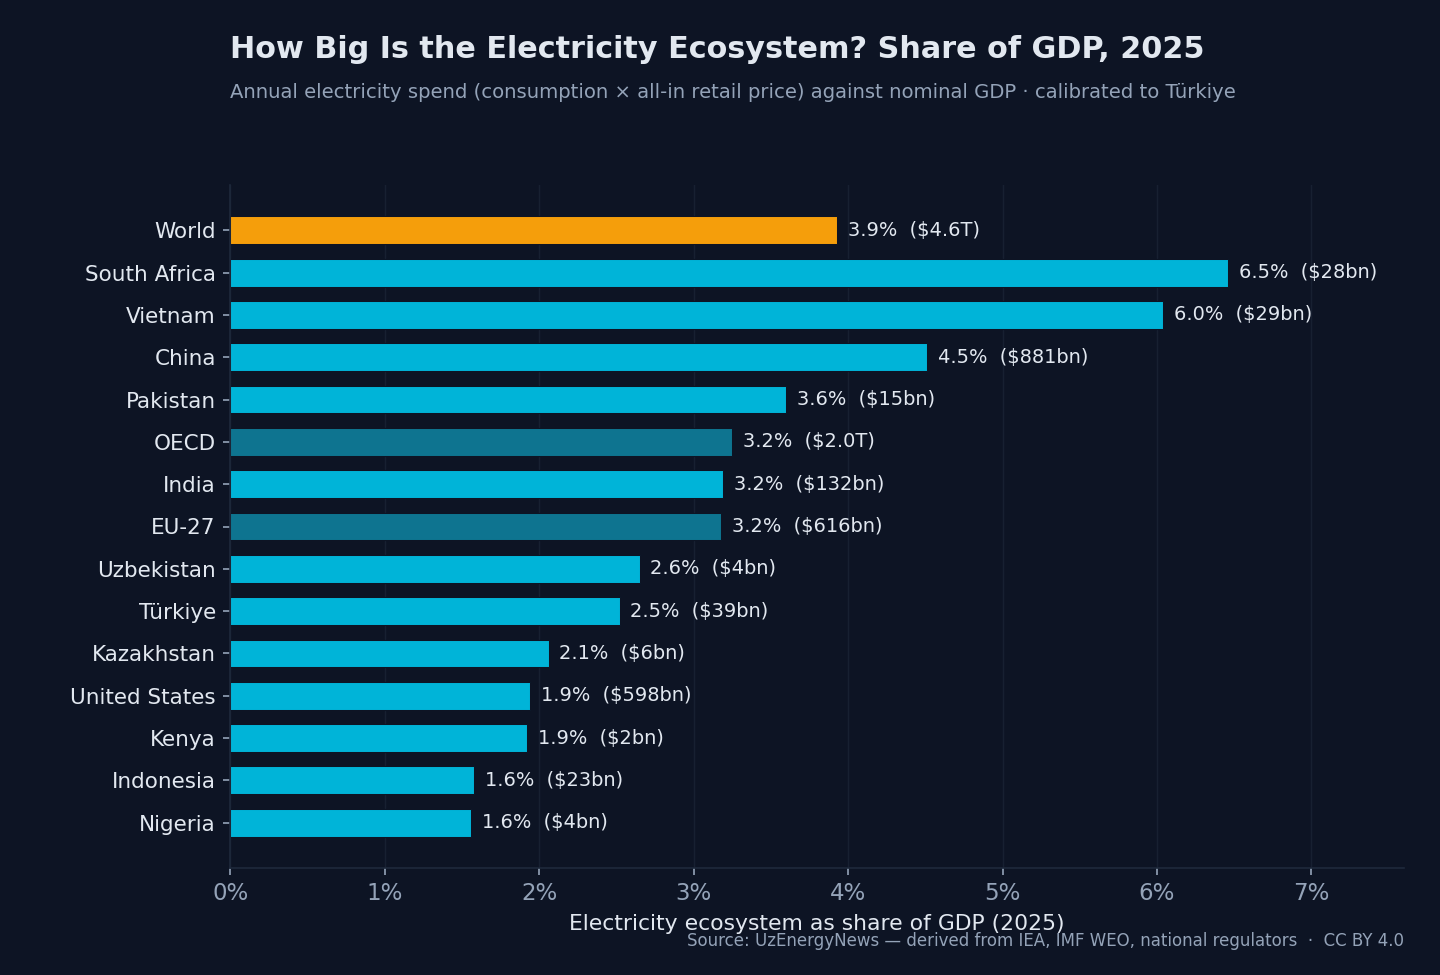
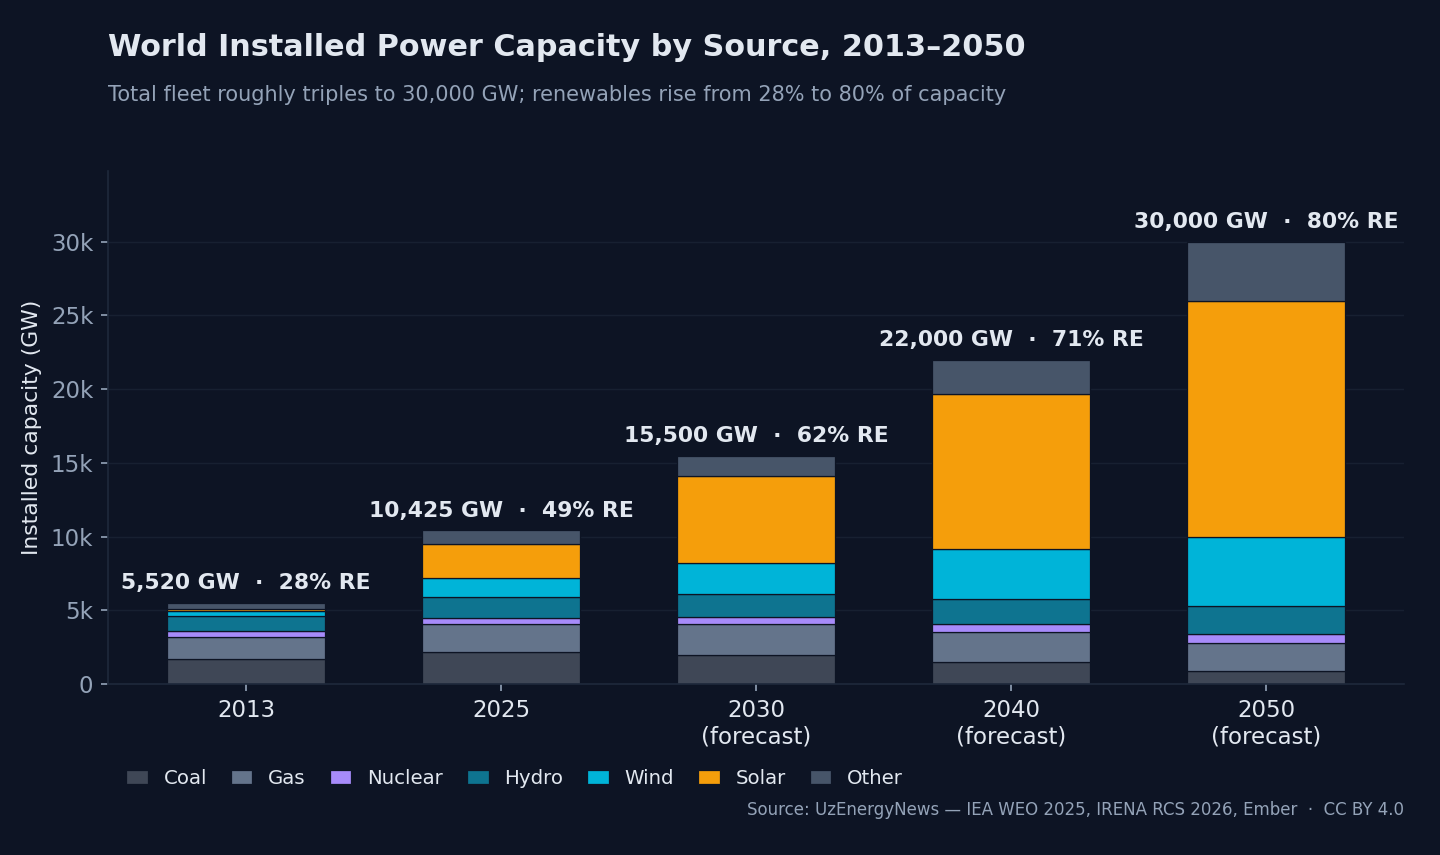
How big is the world's electricity ecosystem in money, and what share of GDP does it represent? We size the annual electricity spend of 15 economies — ten emerging markets plus China, the United States, the EU-27, the OECD and the world — and set it against the power fleet that has to triple by 2050. The method is calibrated to Türkiye's published figure and applied consistently across every economy.
≈ $4.6T
World electricity ecosystem per year (consumption × all-in retail price)
≈ 3.9%
of world GDP ($117T, IMF WEO)
× 2.9
installed capacity growth to 2050 (10,425 → 30,000 GW)
80%
renewables share of capacity by 2050 (28% in 2013)
Electricity ecosystem (annual spend) as a share of GDP, 2025 — calibrated to Türkiye's published figure and applied to every economy.World installed power capacity by source, 2013–2050 (actual to 2025, then an IEA net-zero-aligned trajectory).
Ecosystem value = gross electricity consumption × all-in average retail price (a retail-spend proxy anchored to Türkiye's 39.4 bn USD / ~2.5% of GDP). Aggregates (World, OECD, EU-27) overlap individual countries and are not additive. Electricity-intensive economies with smaller nominal GDP (South Africa, Vietnam) therefore sit highest in the ranking. 2035–2050 capacity follows national plans and IEA scenarios; figures beyond 2035 are indicative. Derived by UzEnergyNews from IEA, IRENA, Ember, IMF WEO, EIA, Eurostat and national plans — a derived compilation, not a re-hosted database.
Compiled by us from public sources — free to download and cite.
🔵Open Data Directory
Curated external sources, open-licensed (CC0 / CC BY). We link to the original — we do not re-host.
Latest analysis
WEEKLY INSIGHT #21 · ARTIFICIAL INTELLIGENCE · ELECTRICITY DEMAND11 October 2026 · 16 min read EN · 12 dk TR · Global
Artificial Intelligence Capital Expenditure in 2026 and Its Electricity Counterpart: company guidance, nuclear uprate agreements and grid equipment backlogs
Company guidance compiled by Platformonomics sums to 735–750 billion dollars of 2026 capital expenditure for Alphabet, Amazon, Meta and Microsoft, on definitions that differ by company. On the electricity side, the International Energy Agency (IEA) puts global data centre consumption at 485 terawatt-hours in 2025 and 950 terawatt-hours in 2030. Three nuclear uprate agreements announced between 21 September and 6 October 2026 cover about 1,176 megawatts of additional capacity, and on 5 October 2026 the United States Department of Energy (DOE) announced a conditional loan commitment for a further 433 megawatts of uprates contracted to Meta. Quanta Services reported an order backlog of 53.4 billion dollars at 30 June 2026.
This edition places two series side by side for the period to 10 October 2026: the capital that technology companies are committing to computing infrastructure, and the electricity supply, generation capacity and grid equipment contracted, financed or ordered over the same period. Company figures are taken from filings with the United States Securities and Exchange Commission (SEC) and from company releases; where a figure was available only through secondary reporting, the text states this. Weekly Insight #12 (22 July 2026) examined grid connection as a constraint on data centre delivery, Weekly Insight #14 (5 August 2026) examined tariff design for new large loads, Weekly Insight #16 (23 August 2026) mapped European data centre capacity, and Weekly Insight #17 (4 September 2026) examined the financing of network investment. This edition updates the capital expenditure and demand figures cited in Weekly Insight #12 and, for PJM, adds the Interim Resource Adequacy Service filing, the Reliability Backstop order and the 2028/29 forecast peak load to the auction results reported in Weekly Insights #12 and #14; tariff design, the European capacity map and network financing are not re-examined.
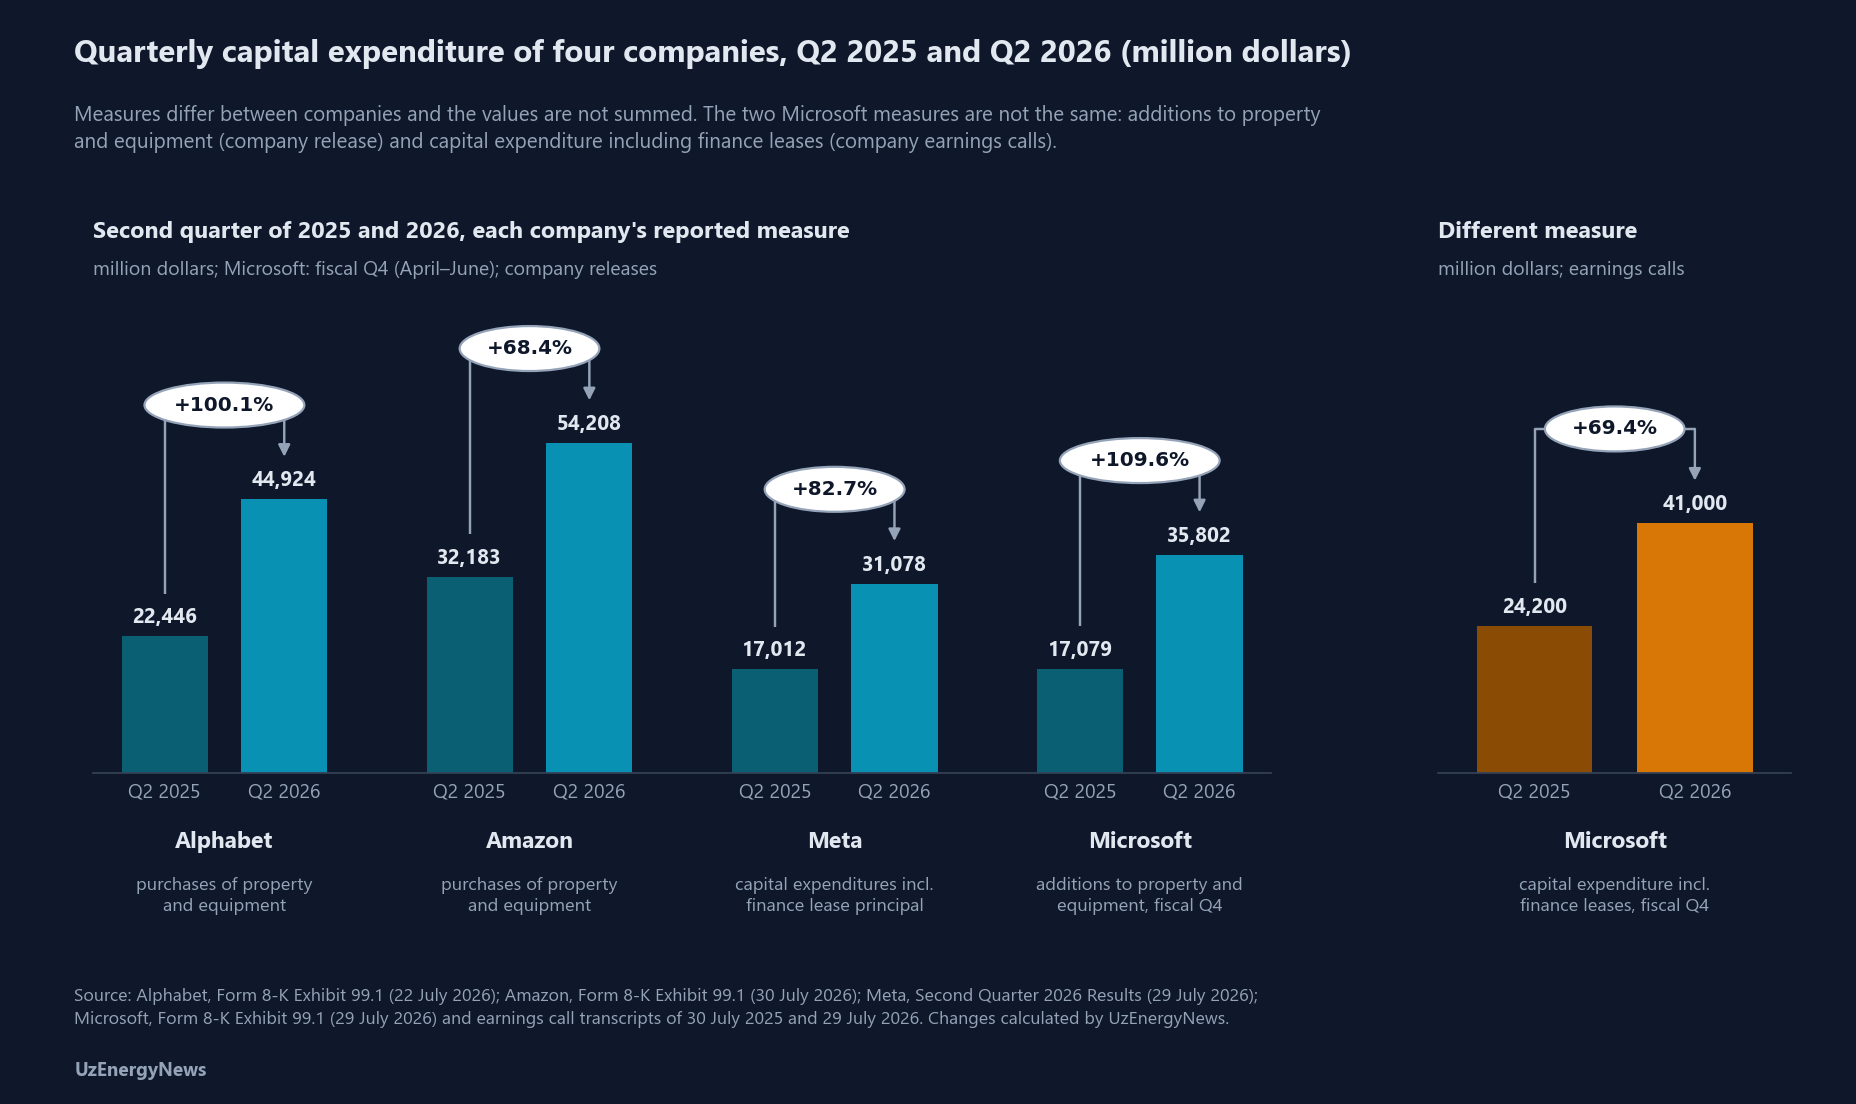
Second-quarter 2026 capital expenditure of four companies
Alphabet reported purchases of property and equipment of 44,924 million dollars in the second quarter of 2026, against 22,446 million dollars in the second quarter of 2025, and 80,598 million dollars for the first half of 2026, against 39,643 million dollars a year earlier (Form 8-K, Exhibit 99.1, 22 July 2026). Google Cloud revenue in the quarter was 24,768 million dollars, against 13,624 million dollars a year earlier, an increase of 82 per cent.
Amazon reported purchases of property and equipment of 54,208 million dollars in the second quarter of 2026, against 32,183 million dollars a year earlier, and 173,028 million dollars for the trailing twelve months, against 107,656 million dollars for the preceding twelve months (Form 8-K, Exhibit 99.1, 30 July 2026). The same release records 53.4 billion dollars of non-operating income in the quarter, "primarily from our investments in Anthropic", and states that Anthropic and OpenAI have made "multi-year, multi-gigawatt commitments" to Amazon's Trainium processors. The release does not state the number of gigawatts.
Meta reported capital expenditures, including principal payments on finance leases, of 31.08 billion dollars in the second quarter of 2026, comprising 30,116 million dollars of purchases of property and equipment and 962 million dollars of finance lease principal payments (press release, 29 July 2026). The corresponding figures for the second quarter of 2025 were 16,538 million dollars and 474 million dollars, a total of 17,012 million dollars.
Microsoft's release (Form 8-K, Exhibit 99.1, 29 July 2026) reports additions to property and equipment of 35,802 million dollars in the fourth quarter of its fiscal year 2026 (April to June 2026), against 17,079 million dollars a year earlier. On the earnings call of 29 July 2026, the company's chief financial officer put capital expenditure including finance leases at 41 billion dollars, of which 5.6 billion dollars were finance leases; on the call of 30 July 2025, the corresponding figure for the fourth quarter of fiscal year 2025 was 24.2 billion dollars, including 6.5 billion dollars of finance leases. The increase is 69.4 per cent (calculated). These figures are taken from the company's transcripts of the two calls, not from its filings.
Table 1. Quarterly capital expenditure, second quarter of 2025 and 2026 (million dollars)
Company
Measure reported
Q2 2025
Q2 2026
Change
Alphabet
Purchases of property and equipment
22,446
44,924
+100.1% (calculated)
Amazon
Purchases of property and equipment
32,183
54,208
+68.4% (calculated)
Meta
Capital expenditures incl. finance lease principal payments
17,012
31,078
+82.7% (calculated)
Microsoft
Additions to property and equipment (fiscal Q4, Apr–Jun)
17,079
35,802
+109.6% (calculated)
Microsoft
Capital expenditure incl. finance leases (fiscal Q4, Apr–Jun)
24,200
41,000
+69.4% (calculated)
Changes are calculated by UzEnergyNews from company figures. The Microsoft row including finance leases is taken from the company's earnings calls of 30 July 2025 and 29 July 2026 and is a different measure from the additions to property and equipment reported in the company's release. Measures differ between companies and the rows are not additive on a common definition.
Full-year 2026 guidance and the differences in definition
Alphabet's guidance for 2026 capital expenditure is 195 to 205 billion dollars, raised from a range of 180 to 190 billion dollars; the figure was given on the earnings call and is reported in secondary sources (W.Media, 23 July 2026). Amazon's guidance is approximately 220 billion dollars of cash capital expenditure, raised from approximately 200 billion dollars, with the company citing the cost of memory; this figure is also reported in secondary sources (Data Center Knowledge, 31 July 2026). Meta's release puts 2026 capital expenditures "in the range of $130-145 billion", against a previous range of 125 to 145 billion dollars.
For Microsoft, the company's chief financial officer put calendar-year 2026 capital expenditure at approximately 175 billion dollars on the earnings call of 29 July 2026; CFO Dive (30 July 2026) reports the previous estimate as 190 billion dollars. The company attributed the reduction to a shift of future data centre leases from finance to operating classification, following the extension of the estimated useful life of data centres and office buildings from 15 to 25 years. The chief financial officer stated: "Outside of this useful life impact, our calendar year 2026 CapEx investment expectations remain unchanged." The company expects capital expenditure of more than 50 billion dollars for the first quarter of fiscal year 2027, including the effect of the lease reclassification (earnings call of 29 July 2026; also reported in the MarketBeat summary of the same date). The MarketBeat summary of the earnings call (29 July 2026) assigns the 175 billion dollar figure to fiscal year 2027 rather than to calendar year 2026; this edition uses the calendar-year attribution contained in the statement quoted above.
Platformonomics, which compiles company guidance, sums the four 2026 figures to 735 to 750 billion dollars, against more than 640 billion dollars in January 2026; in the January total, the Microsoft component of more than 140 billion dollars is marked by Platformonomics as an estimate. The components are not defined uniformly: Amazon guides on cash capital expenditure, Meta includes finance lease principal payments, and Microsoft includes finance leases. A direct sum of the component ranges gives 720 to 745 billion dollars if Microsoft's figure is taken as 175 billion dollars, and 735 to 760 billion dollars if it is taken as 190 billion dollars; neither range equals the Platformonomics total of 735 to 750 billion dollars.
The IEA, in Key Questions on Energy and AI (April 2026), reports that capital expenditure by the largest technology companies exceeded 400 billion dollars in 2025, that a further increase of about 75 per cent is expected in 2026, and that this spending is "larger than global investment in oil and natural gas production". Weekly Insight #12 cited market estimates of 600 to 690 billion dollars for 2026 for five companies; the four-company compilation of 735 to 750 billion dollars cited above was published after the second-quarter results in July 2026. The two ranges cover different company sets.
Multi-year compute commitments in a draft registration statement
According to the draft registration statement reviewed by Reuters (29 September 2026), Anthropic has disclosed infrastructure commitments of at least 518 billion dollars, about 80 per cent of which are non-cancellable. The draft was submitted confidentially and is not available on the SEC's EDGAR system. The reported commitments include Google, 111.1 billion dollars (April 2026 to July 2033); Amazon, 110 billion dollars (May 2026 to April 2036); Microsoft, 31.4 billion dollars (November 2026 to May 2033); xAI, up to 84.5 billion dollars, largely cancellable on 90 days' notice; and computing capacity from AMD, more than 20 billion dollars. Reuters separately reports equipment leases with Broadcom of about 161.2 billion dollars; the report does not state whether this amount is included in the 518 billion dollar total. The reported filing does not state the electrical capacity or the energy associated with these commitments, and no conversion is made in this edition. Amazon's second-quarter release, cited above, records both a non-operating gain from its investment in Anthropic and a multi-gigawatt Trainium commitment from Anthropic and OpenAI.
Data centre electricity demand: IEA 2026 figures and the United States series
In Key Questions on Energy and AI (April 2026), the IEA puts global data centre electricity consumption at 485 terawatt-hours in 2025, an increase of 17 per cent on 2024, while global electricity demand grew by 3 per cent. Consumption by data centres focused on artificial intelligence rose by 50 per cent in 2025 and, in the Agency's central outlook, triples between 2025 and 2030. Total data centre consumption reaches 950 terawatt-hours in 2030, about 3 per cent of global electricity demand. Weekly Insight #12 cited 415 terawatt-hours for 2024 and 945 terawatt-hours for 2030 from the Agency's 2025 report; the 2026 report revises the 2030 figure to 950 terawatt-hours.
The same report records a 70 per cent increase in gas turbine orders in 2025, projects 15 to 27 gigawatts of on-site gas generation at data centres and 20 to 25 gigawatts of data centre batteries by 2030, and expects the shortage of high-bandwidth memory to last at least until the end of 2027.
For the United States, the Short-Term Energy Outlook (STEO) of the Energy Information Administration (EIA), published on 6 October 2026, puts electricity generation at 4,430 billion kilowatt-hours in 2025 and projects 4,545 billion kilowatt-hours in 2026 and 4,613 billion kilowatt-hours in 2027, increases of 2.6 and 1.5 per cent (calculated). These are generation figures, not consumption. The STEO puts consumption in the commercial sector, which includes data centres, 5 per cent higher in the third quarter of 2026 than a year earlier and forecasts commercial-sector growth of 2.8 per cent in 2027. A federal estimate dedicated to data centres, the 2024 United States Data Center Energy Usage Report published by Lawrence Berkeley National Laboratory for the DOE in December 2024, put United States data centre consumption at 176 terawatt-hours in 2023, 4.4 per cent of national consumption, and projected 325 to 580 terawatt-hours in 2028, or 6.7 to 12 per cent.
Contracted generation: nuclear uprate agreements and financing, 21 September to 6 October 2026
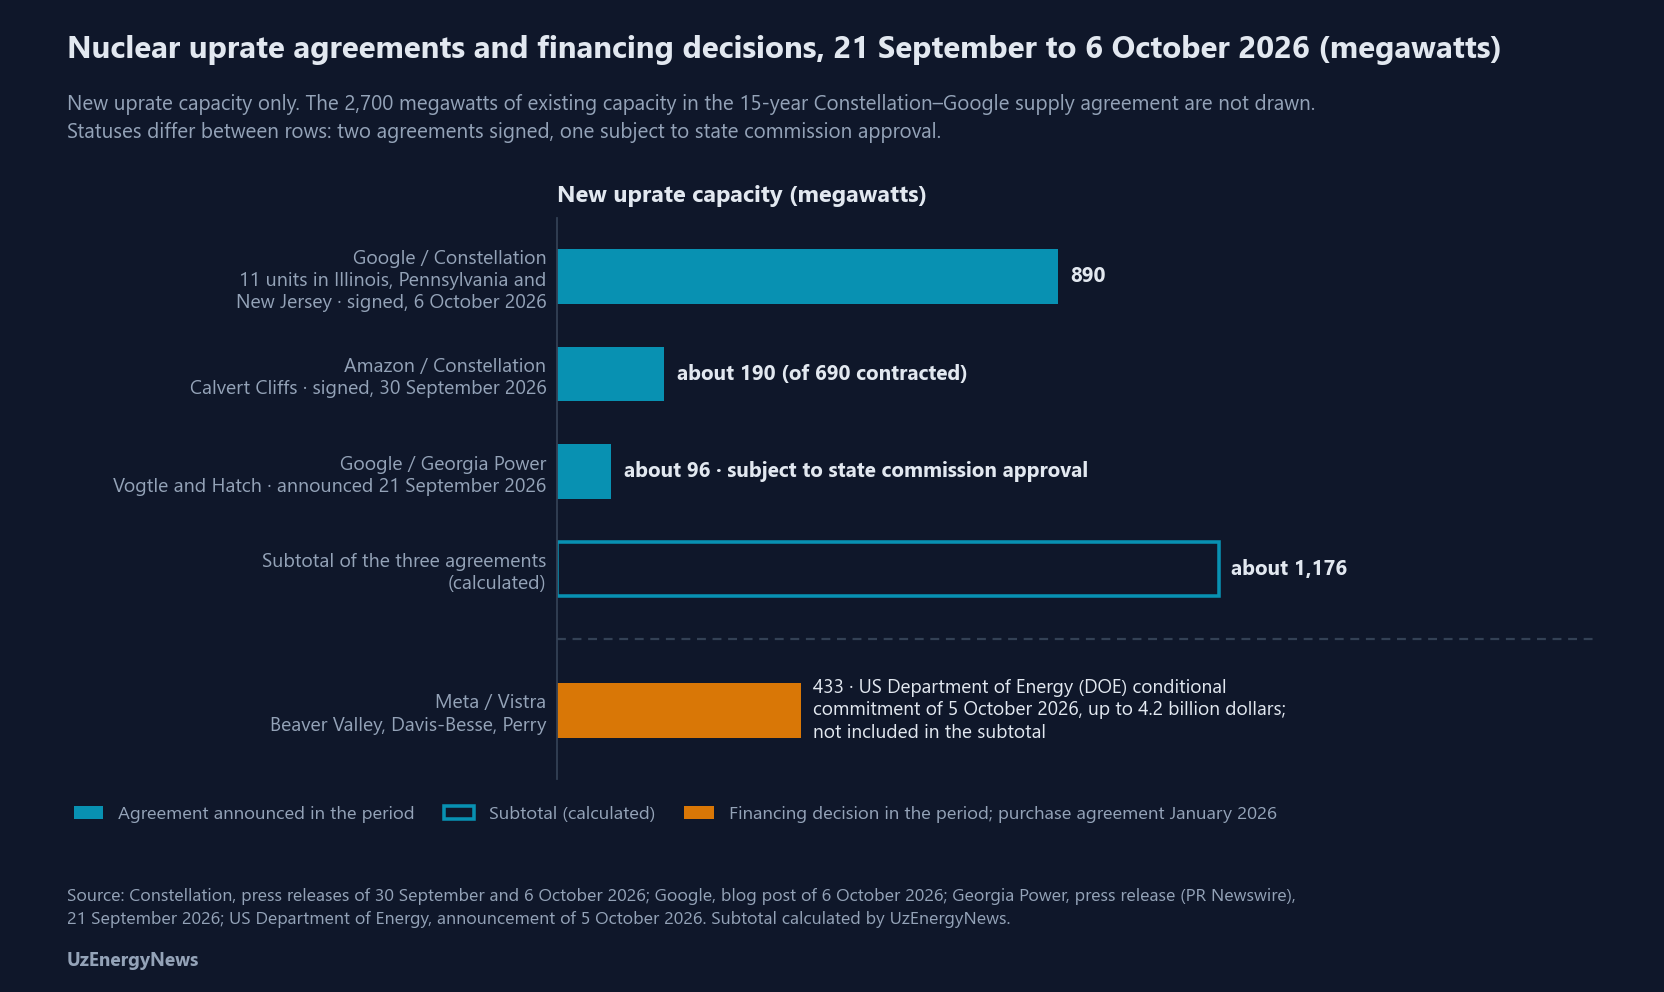
On 6 October 2026, Constellation and Google announced a 20-year power purchase agreement (PPA) covering 890 megawatts of capacity uprates at 11 reactor units in Illinois, Pennsylvania and New Jersey, supported by more than 4.3 billion dollars of new investment by Constellation. The first uprate is scheduled to enter service by 2028, and Google states that the full 890 megawatts will be in service before the end of 2032. The agreement is accompanied by a 15-year supply agreement for 2,700 megawatts of existing capacity, bringing the total to 3,590 megawatts; the 2,700 megawatts are existing output, not new capacity. The price was not disclosed. Secondary reports give differing counts of sites and plants; this edition follows the Constellation release.
On 30 September 2026, Constellation and Amazon announced a 20-year PPA at Calvert Cliffs for a total of 690 megawatts, of which about 190 megawatts are uprates scheduled to enter service between 2030 and 2032, with associated investment of more than 3 billion dollars.
On 21 September 2026, Georgia Power announced (press release, PR Newswire) an agreement with Google for about 96 megawatts of uprates at the Vogtle and Hatch plants under the NU-1 tariff, subject to approval by the Georgia Public Service Commission.
On 5 October 2026, the DOE's Office of Energy Dominance Financing announced a conditional loan commitment of up to 4.2 billion dollars to Vistra to finance 433 megawatts of uprates at the Beaver Valley, Davis-Besse and Perry nuclear plants. The output of these uprates was contracted to Meta under agreements announced in January 2026; the financing decision falls within the period covered here, the purchase agreement does not. A conditional commitment is not a disbursed loan.
Table 2. Nuclear uprate agreements and financing decisions, 21 September to 6 October 2026
Buyer / counterparty
Plants
New uprate capacity (MW)
Announced
Term / in-service
Status
Google / Constellation
11 units, Illinois, Pennsylvania, New Jersey
890
6 October 2026
20-year PPA; first uprate by 2028, all before end-2032
Signed (company release)
Amazon / Constellation
Calvert Cliffs
about 190 (of 690 MW contracted)
30 September 2026
20-year PPA; 2030–2032
Signed (company release)
Google / Georgia Power
Vogtle, Hatch
about 96
21 September 2026
NU-1 tariff
Subject to state commission approval
Subtotal, agreements announced in the period
about 1,176
statuses differ
Meta / Vistra
Beaver Valley, Davis-Besse, Perry
433
Purchase agreement January 2026; DOE commitment 5 October 2026
not stated in source
DOE conditional commitment up to 4.2 billion dollars; not included in subtotal
Subtotal calculated by UzEnergyNews. Constellation agreements from company releases; the in-service timing of the Google–Constellation uprates (all before the end of 2032) from Google's post "Why we're backing America's existing nuclear plants" of 6 October 2026; Georgia Power from the company release of 21 September 2026 (PR Newswire), also reported by World Nuclear News; Vistra from the DOE announcement of 5 October 2026, also reported by POWER and Utility Dive.
Capacity market and large-load rules in PJM
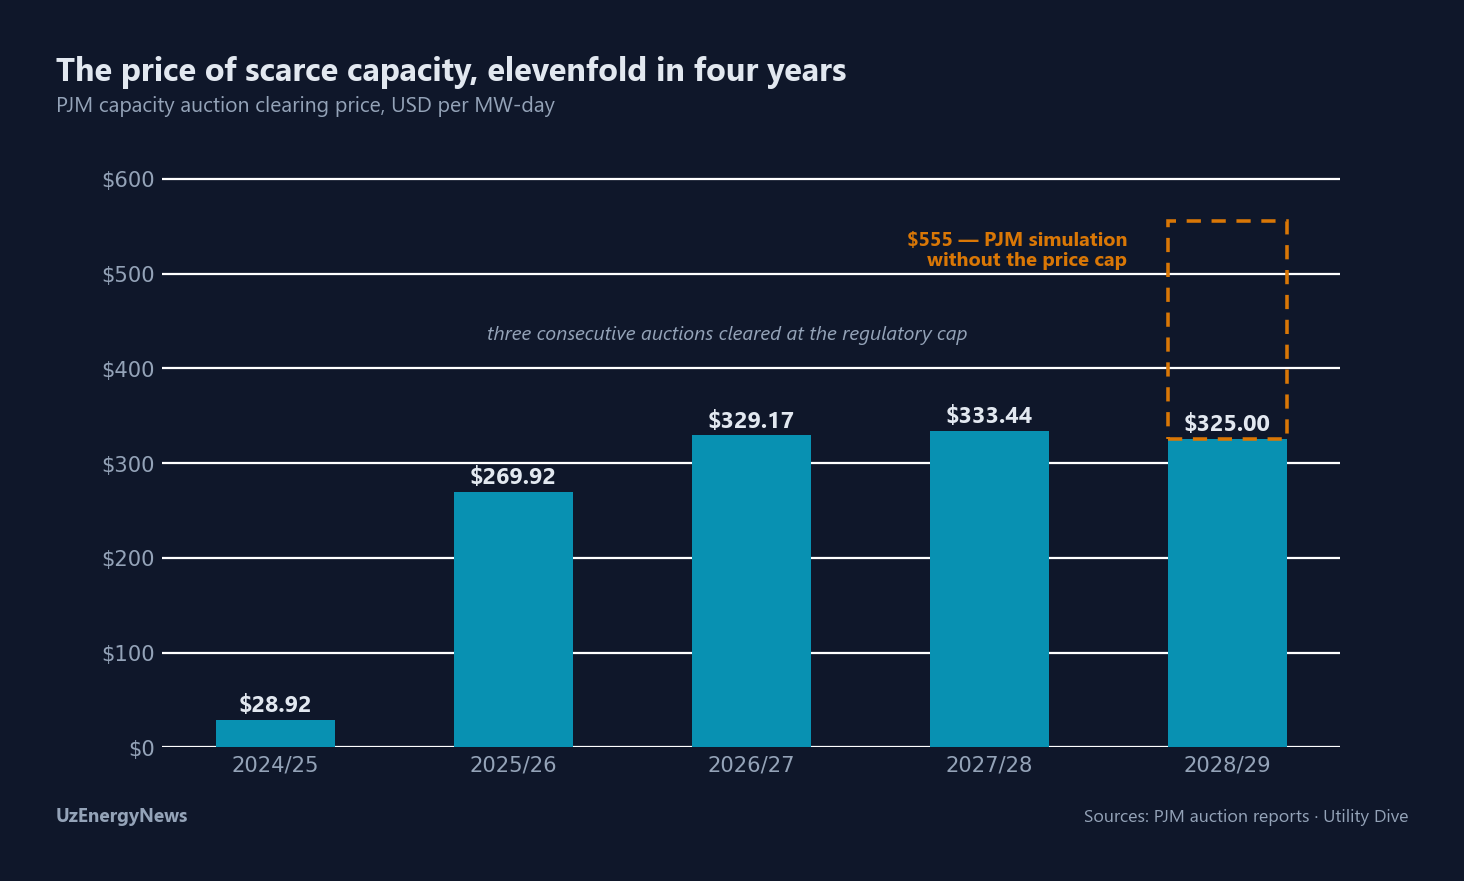
Weekly Insight #12 and Weekly Insight #14 reported the result of the 2028/29 capacity auction of PJM Interconnection, the transmission system operator covering all or parts of 13 states and the District of Columbia in the eastern United States, published on 14 July 2026: a clearing price of 325 dollars per megawatt-day, equal to the regulatory cap, against 333.44 dollars in the 2027/28 auction; 138,318 megawatts of unforced capacity procured; a cost of 16.4 billion dollars; and a shortfall of 6,831 megawatts against the reliability requirement. The PJM auction report puts the 2028/29 forecast peak load at 165,953.5 megawatts, 1,374.5 megawatts (0.8 per cent) above the forecast for 2027/28.
Two regulatory proceedings on large loads have followed. On 13 August 2026, PJM filed an Interim Resource Adequacy Service with the Federal Energy Regulatory Commission (FERC) under docket ER26-3515-000. The filing provides for new large loads connected after 1 June 2027 to be curtailed when resource adequacy is insufficient, and defines a large load as 50 megawatts or more at a single point of interconnection or within a one-mile radius; a bring-your-own-new-capacity option allows a load to be exempted from this obligation. The requested effective date is 12 October 2026, and the filing was pending as of 7 October 2026. Separately, FERC accepted PJM's Reliability Backstop mechanism on 29 September 2026 and suspended its effectiveness until 28 February 2027. The 2029/30 auction is scheduled for December 2026 (PJM schedule).
Grid and generation equipment: order backlogs and transformer supply
Quanta Services reported an order backlog of 53.4 billion dollars at 30 June 2026, which the company describes as a record, against 35.8 billion dollars at 30 June 2025, an increase of 49 per cent calculated from company figures. The company presents backlog as a measure not recognised under United States GAAP; it comprises remaining performance obligations and estimated orders under master service agreements (MSAs), including estimated renewals, and certain non-fixed price contracts. Of the total, 43.8 billion dollars is in the Electric segment. Remaining performance obligations were 33.6 billion dollars, against 19.2 billion dollars a year earlier. Second-quarter revenue was 9.56 billion dollars, and 2026 revenue guidance is 39.3 to 39.7 billion dollars. In describing an acquisition, the release refers to "the growing data center and mission-critical facility markets" (Form 8-K, Exhibit 99.1, 30 July 2026).
Eaton reported second-quarter 2026 sales of 4.0 billion dollars in its Electrical Americas segment, an organic increase of 18 per cent. The twelve-month rolling average of segment orders rose 41 per cent organically, and the segment backlog rose 33 per cent year on year. In the Electrical Global segment, the twelve-month rolling average of orders rose 33 per cent organically and backlog rose 103 per cent, to 3,602 million dollars against 1,771 million dollars, an organic increase of 54 per cent (Form 10-Q, 31 July 2026); the backlog figure includes Boyd Thermal, acquired on 12 March 2026. In the release (Form 8-K, Exhibit 99), the company's chief executive stated: "While data centers remain a key growth driver, we are benefiting from robust demand across our end markets."
GE Vernova reported that its gas equipment backlog and slot reservations together rose during the second quarter of 2026 from 100 gigawatts to 116 gigawatts, with backlog moving from 44 to 53 gigawatts and slot reservations from 56 to 63 gigawatts; slot reservations are not firm orders. The company targets at least 125 gigawatts by the end of 2026. In the Electrification segment, data centre orders exceeded 5 billion dollars year to date, "more than double our 2025 total". Total company backlog was 176 billion dollars (Form 8-K press release, 22 July 2026).
Schneider Electric reported second-quarter revenue of 11.5 billion euros, an organic increase of 17 per cent, with North America up 23 per cent organically (half-year results, 30 July 2026, as reported by trade press). A separate data centre order figure was not available in the sources consulted.
Transformer supply is measured by lead time and by shortfall. A Wood Mackenzie survey for the second quarter of 2025, as reported by POWER magazine on 2 January 2026, put average lead times at 128 weeks for power transformers and 144 weeks for generator step-up transformers. The same POWER article reports price increases of 77 per cent and 45 per cent respectively since 2019. A lead-time survey dated 2026 was not available in the sources consulted. In a release of 31 August 2026, Wood Mackenzie estimated the 2026 supply shortfall at about 15 per cent for power transformers and about 8 per cent for substations, and stated that the executive order on the bulk-power system will widen the shortfall. Executive Order 14421, "Declaring a National Emergency To Secure the United States Bulk-Power System", signed on 26 August 2026 and published in the Federal Register on 31 August 2026, authorises the DOE to prohibit, or to set conditions on, transactions involving bulk power system equipment from designated foreign entities; Wood Mackenzie's release describes it as a ban on Chinese bulk power equipment.
Equity market measures: Nasdaq-100 tracker weights, fund assets and value-chain company disclosures
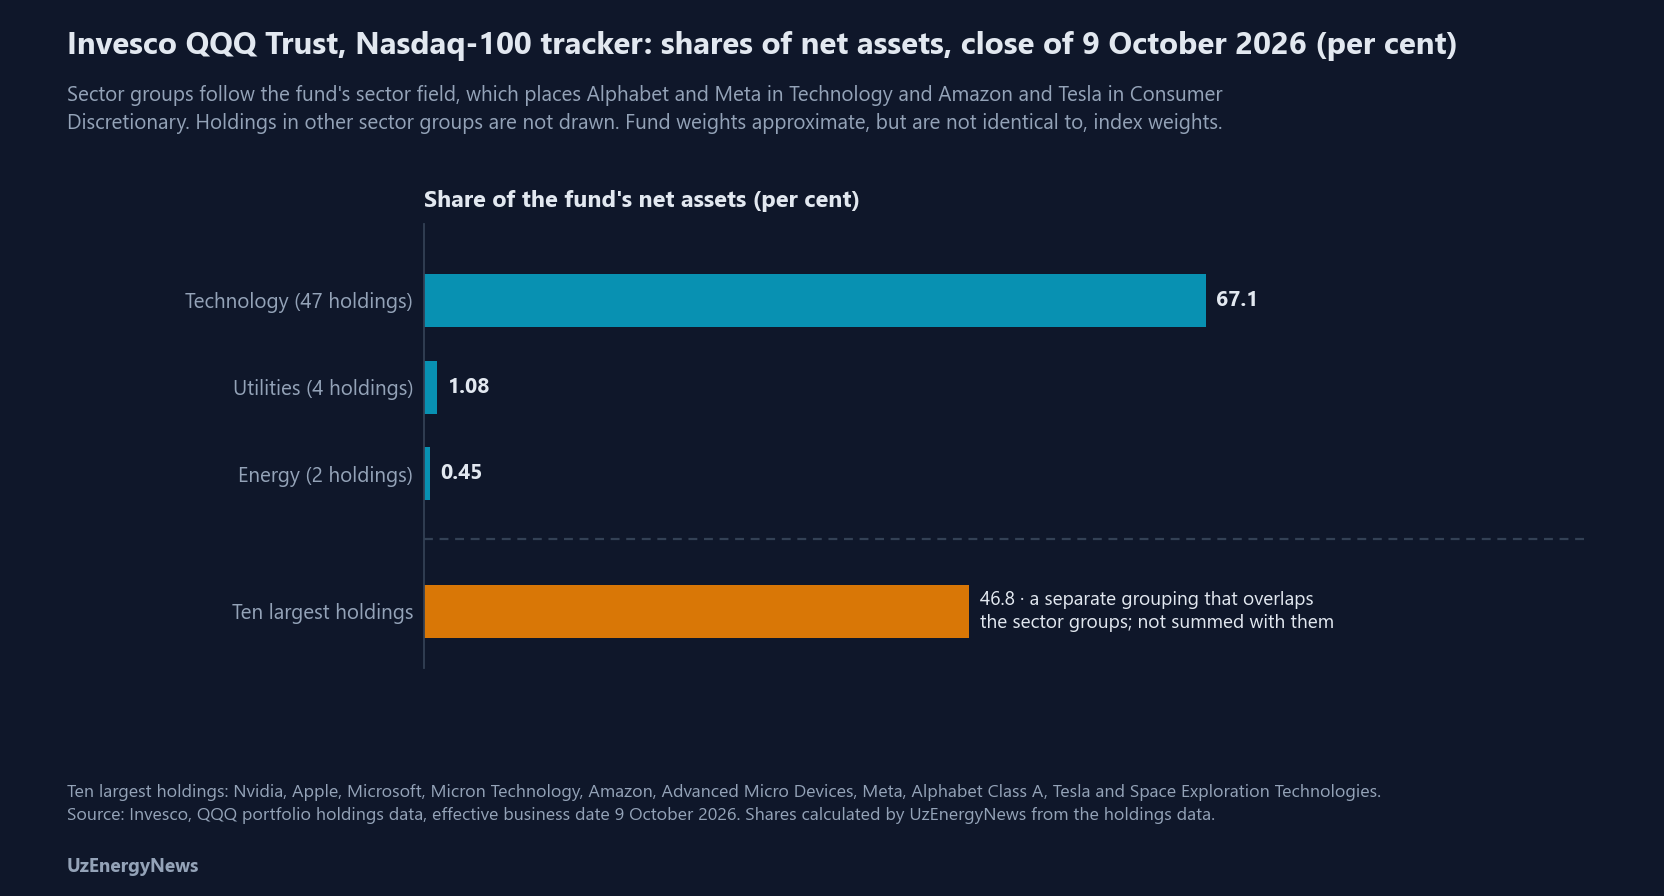
The holdings data published by Invesco for the Invesco QQQ Trust, an exchange-traded fund that tracks the Nasdaq-100 Index, record the portfolio at the close of 9 October 2026. The weights are shares of the fund's net assets; they approximate, but are not identical to, the official weights of the index. The ten largest holdings (Nvidia, Apple, Microsoft, Micron Technology, Amazon, Advanced Micro Devices, Meta, Alphabet Class A, Tesla and Space Exploration Technologies) account for 46.8 per cent of net assets (calculated); Alphabet Class C shares, listed as a separate holding, account for a further 2.9 per cent. Grouped by the sector field of the same data, the 47 holdings classified as Technology account for 67.1 per cent (calculated); this classification places Alphabet and Meta in Technology and Amazon and Tesla in Consumer Discretionary. The four holdings classified as Utilities (Constellation Energy, American Electric Power, Xcel Energy and Exelon) account for 1.08 per cent, and the two classified as Energy (Baker Hughes and Diamondback Energy) for 0.45 per cent. Constellation Energy, the counterparty to the uprate agreement with Google of 6 October 2026 described above, has a weight of 0.44 per cent, the largest of these six holdings.
StockAnalysis reports assets of 503.49 billion dollars for QQQ and 111.96 billion dollars for the Invesco Nasdaq 100 ETF (QQQM), which tracks the same index, and 12.02 billion dollars for the First Trust Nasdaq Clean Edge Smart Grid Infrastructure Index Fund (GRID). The pages do not state the date of the asset figures; each corresponds approximately to the fund's shares outstanding multiplied by its closing price of 8 October 2026 (calculated). GRID's ten largest holdings at 8 October 2026 were Quanta Services, Johnson Controls, Eaton, ABB, Schneider Electric, Prysmian, National Grid, E.ON, nVent and Hubbell, together 57.5 per cent of the portfolio. The Invesco fund pages did not return these figures and the First Trust website could not be accessed on 11 October 2026; the three asset figures and the GRID holdings are therefore taken from a secondary source.
Table 3 lists company disclosures for four links of the data centre value chain: optical connectivity, custom chips, optical fibre and power-intensive data centre hosting. Two further items are not taken from company filings. Lumentum's chief executive was quoted, in an interview with Bloomberg Television on 9 October 2026, as saying that the company was "almost sold out for 2029"; other secondary reports give the period as "through early 2029", and the statement does not appear in an SEC filing. Marvell's revision of its fiscal 2028 revenue target from about 18 billion dollars to about 20 billion dollars at its Investor Day on 6 October 2026 is reported by secondary sources; no company release containing the target was found on the company's investor relations site on 11 October 2026. Corning's core sales are a measure outside United States generally accepted accounting principles (GAAP); its GAAP net sales in the quarter were 4,505 million dollars.
Table 3. Company disclosures along the data centre value chain (million dollars unless stated)
Link
Company
Measure reported
Value
Period
Source
Optical connectivity
Lumentum
Net revenue
1,006.3 (480.7 a year earlier; +109.3%)
Fiscal Q4 2026, to 27 June 2026
Form 8-K, Exhibit 99.1, 11 August 2026
Custom chips and connectivity
Marvell
Net revenue; of which data centre
2,739.3 (+37%); 2,171.5 (+46%)
Fiscal Q2 2027, to 1 August 2026
Form 8-K, Exhibit 99.1, 27 August 2026
Optical fibre
Corning
Core sales; Optical Communications net sales
4,738 (+17%); 2,072 (1,566 a year earlier; +32%)
Q2 2026
Form 8-K, Exhibit 99, 28 July 2026
Power-intensive data centre hosting
IREN
Revenue; of which AI cloud services
707.0 (501.0 in fiscal 2025); 128.8
Fiscal 2026, to 30 June 2026
Form 8-K, Exhibit 99.1, 27 August 2026
Power-intensive data centre hosting
IREN
Power capacity (company statement)
about 5 GW under executed grid connection agreements, letters of agreement or equivalents; about 40 MW operating AI cloud services capacity; about 380 MW bitcoin mining capacity
At 30 June 2026
Form 10-K, fiscal year to 30 June 2026
Percentage changes are as stated in the company releases. Corning core sales and Q2 2025 core figures follow the company's non-GAAP definition, which changed its currency adjustment from 1 April 2026; the company did not recast the 2025 figures. The company states that applying the new adjustment to 2025 would have resulted in higher year-on-year growth rates. Optical Communications segment net sales are on the same non-GAAP basis. IREN's 5 GW figure covers the United States, Canada, Spain and Australia and is not operating capacity.
Central Asia: data centre commitments in Uzbekistan
Euronews reported on 28 September 2026, citing Uzbekistan's Minister of Digital Technologies, that data centre investment commitments in the country exceed 6 billion dollars. The DataVolt facility in Tashkent has an initial capacity of 12 megawatts, with the first phase scheduled for the end of 2026 and a planned total of 300 megawatts. Project financing of up to 150 million dollars is provided by the European Bank for Reconstruction and Development (EBRD), the German development finance institution DEG, the French development finance institution Proparco and the OPEC Fund for International Development. Reported total capacity for the DataVolt project differs between sources (300 and 500 megawatts); the figure used here is the one reported by Euronews.
Summary of measured quantities
Series
Value
Period
Source
Four-company capital expenditure guidance
735–750 billion dollars (Platformonomics total); component sum 720–745 billion dollars with Microsoft at 175 billion dollars
2026
Platformonomics compilation; definitions differ
Capital expenditure of the largest technology companies
more than 400 billion dollars; about +75% expected in 2026
2025
IEA, April 2026
Anthropic infrastructure commitments
at least 518 billion dollars, about 80% non-cancellable
2026–2036
Draft filing reviewed by Reuters
Global data centre electricity
485 TWh (2025); 950 TWh (2030)
2025–2030
IEA, April 2026
United States electricity generation
4,430 / 4,545 / 4,613 billion kWh
2025 / 2026 / 2027
EIA STEO, October 2026
Nuclear uprate agreements announced
about 1,176 MW (three agreements)
21 September–6 October 2026
Company releases; sum calculated
Nuclear uprates under DOE conditional commitment
433 MW (up to 4.2 billion dollars)
5 October 2026
DOE announcement
PJM 2028/29 shortfall against reliability requirement
about 15% (power transformers); about 8% (substations)
2026 estimate
Wood Mackenzie
Nasdaq-100 tracker (QQQ): ten largest holdings
46.8% of net assets (calculated)
9 October 2026
Invesco holdings data
QQQ holdings classified as Technology / Utilities / Energy
67.1% / 1.08% / 0.45% (calculated)
9 October 2026
Invesco holdings data, fund sector field
Constellation Energy weight in QQQ
0.44%
9 October 2026
Invesco holdings data
Fund assets: QQQ / QQQM / GRID
503.49 / 111.96 / 12.02 billion dollars
8 October 2026 (closing prices; calculated)
StockAnalysis (secondary)
IREN power capacity under executed grid connection agreements, letters of agreement or equivalents
about 5 GW; about 40 MW AI cloud operating
30 June 2026
Form 10-K (company statement)
Uzbekistan data centre commitments
more than 6 billion dollars
September 2026
Euronews, citing the Minister of Digital Technologies
Sources (accessed 11 October 2026).
Alphabet, Form 8-K Exhibit 99.1, 22 July 2026 · Amazon, Form 8-K Exhibit 99.1, 30 July 2026 · Meta, Second Quarter 2026 Results, 29 July 2026 · CFO Dive, 30 July 2026, on Microsoft fiscal 2026 fourth-quarter results · Microsoft, Form 8-K Exhibit 99.1, 29 July 2026 · Microsoft, earnings call transcripts for the fourth quarter of fiscal year 2026 (29 July 2026) and of fiscal year 2025 (30 July 2025) · MarketBeat, Microsoft Q4 earnings call highlights, 29 July 2026 · W.Media, 23 July 2026, on Alphabet's 2026 capital expenditure guidance · Data Center Knowledge, 31 July 2026, on Amazon's 2026 capital expenditure · Platformonomics, "Follow the CapEx: Q2 2026 Scoreboard", July 2026 · Reuters, 29 September 2026, on Anthropic's draft registration statement, as republished by Zawya · IEA, Key Questions on Energy and AI, executive summary, April 2026, and press release of 16 April 2026 · EIA, Short-Term Energy Outlook, October 2026 · Lawrence Berkeley National Laboratory for the DOE, 2024 United States Data Center Energy Usage Report, December 2024 · Constellation, press releases of 30 September and 6 October 2026 · Google, "Why we're backing America's existing nuclear plants", 6 October 2026 · Georgia Power, press release (PR Newswire), 21 September 2026, and World Nuclear News, 22 September 2026 · DOE, Office of Energy Dominance Financing, announcement of 5 October 2026, and reports by POWER (5 October 2026) and Utility Dive (6 October 2026) · POWER, 2 January 2026 (transformers) · PJM Interconnection, 2028/29 Base Residual Auction report and results, 14 July 2026 · PJM, Interim Resource Adequacy Service filing, FERC docket ER26-3515-000, 13 August 2026 · FERC, order on PJM's Reliability Backstop, 29 September 2026 · PJM, 2029/2030 planning period parameters for the Base Residual Auction, posted 31 August 2026 · Quanta Services, Form 8-K Exhibit 99.1, 30 July 2026 · Eaton, Form 8-K Exhibit 99, second quarter 2026, and Form 10-Q for the quarter ended 30 June 2026, filed 31 July 2026 · GE Vernova, Form 8-K press release, 22 July 2026 · Schneider Electric, 2026 half-year results, as reported by EMR, 30 July 2026 · Invesco, QQQ portfolio holdings data, effective business date 9 October 2026 · StockAnalysis, fund pages for QQQ, QQQM and GRID, and GRID holdings at 8 October 2026 · Lumentum, Form 8-K Exhibit 99.1, 11 August 2026 · Bloomberg Television interview of 9 October 2026, as reported by FourWeekMBA and InvestorsHub · Marvell, Form 8-K Exhibit 99.1, 27 August 2026 · Marvell Investor Day of 6 October 2026, as reported by AskTraders · Corning, Form 8-K Exhibit 99, 28 July 2026 · IREN, Form 8-K Exhibit 99.1, 27 August 2026, and Form 10-K for the fiscal year ended 30 June 2026 · Wood Mackenzie, press release of 31 August 2026 · Federal Register, Executive Order 14421, "Declaring a National Emergency To Secure the United States Bulk-Power System", FR Doc. 2026-17843, published 31 August 2026 · Euronews, 28 September 2026 · Proparco, DataVolt financing release, 17 June 2026. Figures are cited from public sources; copyrighted charts and tables are not reproduced. Analysis by UzEnergyNews Editorial Desk. Data as of 10 October 2026; sources accessed 11 October 2026.
2026'da Yapay Zekâ Yatırım Harcaması ve Elektrik Tarafındaki Karşılığı: şirket yönlendirmeleri, nükleer kapasite artırımı sözleşmeleri ve şebeke ekipmanı sipariş birikimi
Platformonomics'in derlediği şirket yönlendirmeleri, Alphabet, Amazon, Meta ve Microsoft'un 2026 yatırım harcamasını toplam 735–750 milyar ABD doları olarak vermektedir; tanımlar şirketten şirkete farklıdır. Elektrik tarafında Uluslararası Enerji Ajansı (IEA), küresel veri merkezi tüketimini 2025 için 485 teravatsaat, 2030 için 950 teravatsaat olarak vermektedir. 21 Eylül–6 Ekim 2026 arasında duyurulan üç nükleer kapasite artırımı sözleşmesi yaklaşık 1.176 megavatlık ek kapasiteyi kapsamaktadır; ABD Enerji Bakanlığı (DOE) ise 5 Ekim 2026'da, Meta ile sözleşmeli 433 megavatlık ek artırım için şartlı kredi taahhüdü açıklamıştır. Quanta Services 30 Haziran 2026 itibarıyla 53,4 milyar ABD dolarlık sipariş birikimi bildirmiştir.
Bu yazı, 10 Ekim 2026'ya kadarki dönem için iki seriyi yan yana koymaktadır: teknoloji şirketlerinin hesaplama altyapısına ayırdığı sermaye ile aynı dönemde sözleşmeye bağlanan, finansmanı sağlanan ya da sipariş edilen elektrik arzı, üretim kapasitesi ve şebeke ekipmanı. Şirket rakamları ABD Menkul Kıymetler ve Borsa Komisyonuna (SEC) yapılan bildirimlerden ve şirket açıklamalarından alınmıştır; yalnız ikincil kaynakta bulunan rakamlar metinde bu şekilde belirtilmiştir. Weekly Insight #12 (22 Temmuz 2026) şebeke bağlantısını veri merkezi teslimatında bir kısıt olarak incelemiş, Weekly Insight #14 (5 Ağustos 2026) yeni büyük yükler için tarife tasarımını, Weekly Insight #16 (23 Ağustos 2026) Avrupa veri merkezi kapasitesinin haritasını, Weekly Insight #17 (4 Eylül 2026) ise şebeke yatırımının finansmanını ele almıştır. Bu yazı, Weekly Insight #12'de kullanılan yatırım harcaması ve talep rakamlarını güncellemekte; PJM için ise Weekly Insight #12 ve #14'te aktarılan ihale sonuçlarına Interim Resource Adequacy Service başvurusunu, Reliability Backstop kararını ve 2028/29 tahmini tepe yükünü eklemektedir; tarife tasarımı, Avrupa kapasite haritası ve şebeke finansmanı yeniden incelenmemektedir.
Dört şirketin 2026 ikinci çeyrek yatırım harcaması
Alphabet, 2026'nın ikinci çeyreğinde 44.924 milyon ABD doları maddi duran varlık alımı bildirmiştir; bu tutar 2025'in ikinci çeyreğinde 22.446 milyon ABD dolarıdır. 2026'nın ilk yarısında tutar 80.598 milyon ABD doları, bir yıl önceki dönemde 39.643 milyon ABD dolarıdır (Form 8-K, Ek 99.1, 22 Temmuz 2026). Google Cloud'un çeyrek geliri 24.768 milyon ABD doları olmuştur; bir yıl önceki çeyrekte gelir 13.624 milyon ABD dolarıdır ve artış %82'dir.
Amazon, 2026'nın ikinci çeyreğinde 54.208 milyon ABD doları maddi duran varlık alımı bildirmiştir; bir yıl önceki çeyrekte tutar 32.183 milyon ABD dolarıdır. Son on iki aylık tutar 173.028 milyon ABD doları, önceki on iki ayda 107.656 milyon ABD dolarıdır (Form 8-K, Ek 99.1, 30 Temmuz 2026). Aynı açıklamada çeyrekte 53,4 milyar ABD doları faaliyet dışı gelir kaydedildiği ve bunun "primarily from our investments in Anthropic" kaynaklandığı belirtilmiştir. Açıklamaya göre Anthropic ve OpenAI, Amazon'un Trainium işlemcileri için "multi-year, multi-gigawatt commitments" vermiştir. Açıklamada gigavat miktarı belirtilmemiştir.
Meta, 2026'nın ikinci çeyreğinde finansal kiralama anapara ödemeleri dahil 31,08 milyar ABD doları yatırım harcaması bildirmiştir; tutarın 30.116 milyon ABD doları maddi duran varlık alımı, 962 milyon ABD doları finansal kiralama anapara ödemesidir (basın bülteni, 29 Temmuz 2026). 2025'in ikinci çeyreğinde karşılık gelen tutarlar 16.538 milyon ABD doları ve 474 milyon ABD doları, toplam 17.012 milyon ABD dolarıdır.
Microsoft'un açıklaması (Form 8-K, Ek 99.1, 29 Temmuz 2026), 2026 mali yılının dördüncü çeyreğinde (Nisan–Haziran 2026) 35.802 milyon ABD doları maddi duran varlık ilavesi bildirmektedir; bir yıl önceki çeyrekte tutar 17.079 milyon ABD dolarıdır. Şirketin finans direktörü 29 Temmuz 2026 tarihli kazanç görüşmesinde finansal kiralama dahil yatırım harcamasını 41 milyar ABD doları olarak vermiş, bunun 5,6 milyar ABD dolarının finansal kiralama olduğunu belirtmiştir; 30 Temmuz 2025 tarihli görüşmede 2025 mali yılının dördüncü çeyreği için karşılık gelen tutar, 6,5 milyar ABD doları finansal kiralama dahil 24,2 milyar ABD dolarıdır. Artış %69,4'tür (hesaplanmıştır). Bu rakamlar şirketin SEC bildirimlerinden değil, iki görüşmenin şirket tarafından yayımlanan metinlerinden alınmıştır.
Tablo 1. Çeyreklik yatırım harcaması, 2025 ve 2026 ikinci çeyrekleri (milyon ABD doları)
Şirket
Bildirilen kalem
2025 2. çeyrek
2026 2. çeyrek
Değişim
Alphabet
Maddi duran varlık alımı
22.446
44.924
+%100,1 (hesaplanmıştır)
Amazon
Maddi duran varlık alımı
32.183
54.208
+%68,4 (hesaplanmıştır)
Meta
Finansal kiralama anapara ödemeleri dahil yatırım harcaması
17.012
31.078
+%82,7 (hesaplanmıştır)
Microsoft
Maddi duran varlık ilavesi (mali yıl 4. çeyrek, Nis–Haz)
17.079
35.802
+%109,6 (hesaplanmıştır)
Microsoft
Finansal kiralama dahil yatırım harcaması (mali yıl 4. çeyrek, Nis–Haz)
24.200
41.000
+%69,4 (hesaplanmıştır)
Değişimler UzEnergyNews tarafından şirket rakamlarından hesaplanmıştır. Microsoft'un finansal kiralama dahil satırı şirketin 30 Temmuz 2025 ve 29 Temmuz 2026 tarihli kazanç görüşmelerinden alınmıştır ve şirket açıklamasındaki maddi duran varlık ilavesinden farklı bir ölçüdür. Kalem tanımları şirketler arasında farklıdır; satırlar ortak bir tanım üzerinden toplanamaz.
2026 yılı yönlendirmeleri ve tanım farkları
Alphabet'in 2026 yatırım harcaması yönlendirmesi 195–205 milyar ABD dolarıdır; önceki aralık 180–190 milyar ABD dolarıdır. Rakam kazanç görüşmesinde verilmiş olup ikincil kaynaklarda aktarılmaktadır (W.Media, 23 Temmuz 2026). Amazon'un yönlendirmesi yaklaşık 220 milyar ABD doları nakit yatırım harcamasıdır; önceki rakam yaklaşık 200 milyar ABD dolarıdır ve şirket gerekçe olarak bellek maliyetini göstermiştir. Bu rakam da ikincil kaynaklarda aktarılmaktadır (Data Center Knowledge, 31 Temmuz 2026). Meta'nın açıklaması 2026 yatırım harcamasını "in the range of $130-145 billion" olarak vermektedir; önceki aralık 125–145 milyar ABD dolarıdır.
Microsoft'un finans direktörü 29 Temmuz 2026 tarihli kazanç görüşmesinde 2026 takvim yılı yatırım harcamasını yaklaşık 175 milyar ABD doları olarak vermiştir; CFO Dive (30 Temmuz 2026) önceki tahmini 190 milyar ABD doları olarak aktarmaktadır. Şirket düşüşü, veri merkezi ve ofis binalarının tahmini faydalı ömrünün 15 yıldan 25 yıla uzatılmasının ardından gelecekteki veri merkezi kiralamalarının finansal kiralamadan faaliyet kiralamasına kaymasına bağlamıştır. Finans direktörü şunu söylemiştir: "Outside of this useful life impact, our calendar year 2026 CapEx investment expectations remain unchanged." Şirket, 2027 mali yılının ilk çeyreği için kiralama sınıflandırmasındaki değişikliğin etkisi dahil 50 milyar ABD dolarının üzerinde yatırım harcaması beklemektedir (kazanç görüşmesi, 29 Temmuz 2026; aynı tarihli MarketBeat özeti de aktarmaktadır). Kazanç görüşmesine ilişkin MarketBeat özeti (29 Temmuz 2026), 175 milyar ABD doları rakamını 2026 takvim yılına değil 2027 mali yılına bağlamaktadır; bu yazıda yukarıda aktarılan beyandaki takvim yılı ataması kullanılmıştır.
Şirket yönlendirmelerini derleyen Platformonomics, dört şirketin 2026 rakamlarını toplam 735–750 milyar ABD doları olarak vermektedir; Ocak 2026'da bu toplam 640 milyar ABD dolarının üzerindeydi; Ocak toplamındaki 140 milyar ABD dolarının üzerindeki Microsoft kalemi Platformonomics tarafından tahmin olarak işaretlenmiştir. Bileşenler aynı tanıma dayanmamaktadır: Amazon nakit yatırım harcaması üzerinden yönlendirme vermekte, Meta finansal kiralama anapara ödemelerini, Microsoft ise finansal kiralamaları dahil etmektedir. Bileşen aralıklarının doğrudan toplamı, Microsoft rakamı 175 milyar ABD doları alındığında 720–745 milyar ABD doları, 190 milyar ABD doları alındığında 735–760 milyar ABD dolarıdır; iki aralık da Platformonomics'in verdiği 735–750 milyar ABD doları toplamıyla aynı değildir.
IEA, Key Questions on Energy and AI (Nisan 2026) raporunda en büyük teknoloji şirketlerinin yatırım harcamasının 2025'te 400 milyar ABD dolarını aştığını, 2026'da yaklaşık %75'lik ek artış beklendiğini ve bu harcamanın "larger than global investment in oil and natural gas production" olduğunu kaydetmiştir. Weekly Insight #12, beş şirket için 2026'ya ilişkin 600–690 milyar ABD dolarlık piyasa tahminlerini aktarmıştı; yukarıdaki dört şirketlik 735–750 milyar ABD dolarlık derleme Temmuz 2026'da ikinci çeyrek sonuçlarından sonra yayımlanmıştır. İki aralık farklı şirket kümelerini kapsamaktadır.
Taslak kayıt beyanında çok yıllı hesaplama yükümlülükleri
Reuters'ın incelediği taslak kayıt beyanına göre (29 Eylül 2026), Anthropic en az 518 milyar ABD dolarlık altyapı yükümlülüğü bildirmiştir; bunun yaklaşık %80'i iptal edilemez niteliktedir. Taslak gizli olarak sunulmuş olup SEC'in EDGAR sisteminde yer almamaktadır. Aktarılan yükümlülükler arasında şunlar bulunmaktadır: Google, 111,1 milyar ABD doları (Nisan 2026–Temmuz 2033); Amazon, 110 milyar ABD doları (Mayıs 2026–Nisan 2036); Microsoft, 31,4 milyar ABD doları (Kasım 2026–Mayıs 2033); xAI, 84,5 milyar ABD dolarına kadar ve 90 günlük bildirimle büyük ölçüde iptal edilebilir; AMD'den hesaplama kapasitesi, 20 milyar ABD dolarının üzerinde. Reuters, Broadcom ile yaklaşık 161,2 milyar ABD dolarlık ekipman kiralamasını ayrıca aktarmaktadır; bu tutarın 518 milyar ABD dolarlık toplamın içinde olup olmadığı haberde belirtilmemiştir. Aktarılan bildirimde bu yükümlülüklere karşılık gelen elektrik kapasitesi ya da enerji miktarı belirtilmemiştir; bu yazıda herhangi bir dönüşüm yapılmamıştır. Yukarıda aktarılan Amazon ikinci çeyrek açıklaması, hem Anthropic yatırımından kaynaklanan faaliyet dışı geliri hem de Anthropic ve OpenAI'ın çok gigavatlı Trainium taahhüdünü kaydetmektedir.
Veri merkezi elektrik talebi: IEA 2026 rakamları ve ABD serisi
IEA, Key Questions on Energy and AI (Nisan 2026) raporunda küresel veri merkezi elektrik tüketimini 2025 için 485 teravatsaat olarak vermektedir; bu, 2024'e göre %17 artışa karşılık gelmekte olup aynı yıl küresel elektrik talebi %3 artmıştır. Yapay zekâya odaklı veri merkezlerinin tüketimi 2025'te %50 artmış olup Ajansın merkezî görünümünde 2025–2030 arasında üç katına çıkmaktadır. Toplam veri merkezi tüketimi 2030'da 950 teravatsaate ulaşmakta ve küresel elektrik talebinin yaklaşık %3'ünü oluşturmaktadır. Weekly Insight #12, Ajansın 2025 raporundan 2024 için 415 teravatsaat ve 2030 için 945 teravatsaat rakamlarını aktarmıştı; 2026 raporu 2030 rakamını 950 teravatsaat olarak güncellemiştir.
Aynı rapor, gaz türbini siparişlerinde 2025'te %70 artış kaydetmekte; 2030'a kadar veri merkezlerinde 15–27 gigavat yerinde gaz üretimi ve 20–25 gigavat veri merkezi bataryası öngörmekte; yüksek bant genişlikli bellekteki kıtlığın en az 2027 sonuna kadar sürmesini beklemektedir.
ABD için ABD Enerji Bilgi İdaresinin (EIA) 6 Ekim 2026'da yayımlanan Kısa Vadeli Enerji Görünümü (STEO), elektrik üretimini 2025 için 4.430 milyar kilovatsaat olarak vermekte; 2026 için 4.545 milyar kilovatsaat, 2027 için 4.613 milyar kilovatsaat öngörmektedir. Bu, sırasıyla %2,6 ve %1,5 artışa karşılık gelmektedir (hesaplanmıştır). Rakamlar tüketim değil üretim serisidir. STEO, veri merkezlerini de içeren ticari sektör tüketimini 2026'nın üçüncü çeyreğinde bir yıl öncesine göre %5 yüksek vermekte ve ticari sektör için 2027'de %2,8 artış öngörmektedir. Veri merkezlerine ayrılmış bir federal tahmin olan ve Lawrence Berkeley Ulusal Laboratuvarının DOE için Aralık 2024'te yayımladığı 2024 United States Data Center Energy Usage Report, ABD veri merkezi tüketimini 2023 için 176 teravatsaat (ulusal tüketimin %4,4'ü) olarak vermiş, 2028 için 325–580 teravatsaat (%6,7–12) öngörmüştür.
Sözleşmeli üretim: nükleer kapasite artırımı sözleşmeleri ve finansmanı, 21 Eylül–6 Ekim 2026
Constellation ve Google, 6 Ekim 2026'da Illinois, Pennsylvania ve New Jersey'deki 11 reaktör ünitesinde 890 megavatlık kapasite artırımını kapsayan 20 yıllık bir uzun vadeli enerji alım sözleşmesi (PPA) duyurmuştur; Constellation'ın bu kapsamdaki yeni yatırımı 4,3 milyar ABD dolarının üzerindedir. İlk artırımın 2028'e kadar devreye girmesi planlanmakta olup Google, 890 megavatın tamamının 2032 sonundan önce devreye gireceğini belirtmektedir. Sözleşmeye, mevcut 2.700 megavat için 15 yıllık bir arz sözleşmesi eşlik etmekte ve toplam 3.590 megavata ulaşmaktadır; 2.700 megavat mevcut üretimdir, yeni kapasite değildir. Fiyat açıklanmamıştır. İkincil haberlerde saha ve santral sayısı farklı verilmektedir; bu yazıda Constellation açıklaması esas alınmıştır.
Constellation ve Amazon, 30 Eylül 2026'da Calvert Cliffs santrali için toplam 690 megavatlık 20 yıllık bir PPA duyurmuştur; bunun yaklaşık 190 megavatı 2030–2032 arasında devreye girmesi planlanan kapasite artırımıdır ve bağlı yatırım 3 milyar ABD dolarının üzerindedir.
Georgia Power, 21 Eylül 2026'da yayımladığı basın bülteniyle (PR Newswire) Google ile Vogtle ve Hatch santrallerinde NU-1 tarifesi kapsamında yaklaşık 96 megavat artırımı içeren bir sözleşme duyurmuştur; sözleşme Georgia Kamu Hizmetleri Komisyonunun onayına tabidir.
DOE'nin Office of Energy Dominance Financing birimi, 5 Ekim 2026'da Vistra'ya Beaver Valley, Davis-Besse ve Perry nükleer santrallerindeki 433 megavatlık artırımın finansmanı için 4,2 milyar ABD dolarına kadar şartlı kredi taahhüdü verdiğini açıklamıştır. Bu artırımların üretimi, Ocak 2026'da duyurulan sözleşmelerle Meta'ya bağlanmıştır; finansman kararı bu yazının kapsadığı döneme girmekte, alım sözleşmesi girmemektedir. Şartlı taahhüt, kullandırılmış kredi değildir.
Tablo 2. 21 Eylül–6 Ekim 2026 arasında duyurulan nükleer kapasite artırımı sözleşmeleri ve finansman kararları
Alıcı / karşı taraf
Santraller
Yeni artırım kapasitesi (MW)
Duyuru
Süre / devreye giriş
Durum
Google / Constellation
11 ünite, Illinois, Pennsylvania, New Jersey
890
6 Ekim 2026
20 yıllık PPA; ilk artırım 2028'e kadar, tamamı 2032 sonundan önce
İmzalanmış (şirket açıklaması)
Amazon / Constellation
Calvert Cliffs
yaklaşık 190 (sözleşmeli 690 MW içinde)
30 Eylül 2026
20 yıllık PPA; 2030–2032
İmzalanmış (şirket açıklaması)
Google / Georgia Power
Vogtle, Hatch
yaklaşık 96
21 Eylül 2026
NU-1 tarifesi
Eyalet komisyonu onayına tabi
Ara toplam, dönemde duyurulan sözleşmeler
yaklaşık 1.176
durumlar farklıdır
Meta / Vistra
Beaver Valley, Davis-Besse, Perry
433
Alım sözleşmesi Ocak 2026; DOE taahhüdü 5 Ekim 2026
kaynakta belirtilmemiştir
DOE şartlı taahhüdü, 4,2 milyar ABD dolarına kadar; ara toplama dahil değildir
Ara toplam UzEnergyNews tarafından hesaplanmıştır. Constellation sözleşmeleri şirket açıklamalarından; Google–Constellation artırımlarının devreye giriş takvimi (tamamı 2032 sonundan önce) Google'ın 6 Ekim 2026 tarihli "Why we're backing America's existing nuclear plants" yazısından; Georgia Power sözleşmesi şirketin 21 Eylül 2026 tarihli basın bülteninden (PR Newswire; World Nuclear News da aktarmıştır); Vistra kalemi DOE'nin 5 Ekim 2026 tarihli açıklamasından (POWER ve Utility Dive da aktarmıştır) alınmıştır.
PJM'de kapasite piyasası ve büyük yük kuralları
Weekly Insight #12 ve Weekly Insight #14, ABD'nin doğusunda 13 eyaletin tamamını ya da bir kısmını ve Columbia Bölgesi'ni kapsayan iletim sistemi işletmecisi PJM Interconnection'ın 14 Temmuz 2026'da yayımlanan 2028/29 kapasite ihalesi sonucunu aktarmıştı: düzenleyici tavana eşit 325 ABD doları/MW-gün takas fiyatı (2027/28 ihalesinde 333,44 ABD doları), 138.318 megavat tedarik edilen arızadan arındırılmış kapasite (UCAP), 16,4 milyar ABD doları maliyet ve güvenilirlik gereksiniminin 6.831 megavat altında kalan tedarik. PJM'nin ihale raporu 2028/29 tahmini tepe yükünü 165.953,5 megavat olarak vermektedir; bu değer 2027/28 tahmininin 1.374,5 megavat (%0,8) üzerindedir.
Sonrasında büyük yüklere ilişkin iki düzenleyici süreç başlamıştır. PJM, 13 Ağustos 2026'da Interim Resource Adequacy Service başvurusunu ABD Federal Enerji Düzenleme Komisyonuna (FERC) ER26-3515-000 numaralı dosyayla sunmuştur. Başvuru, kaynak yeterliliğinin yetersiz kaldığı durumlarda 1 Haziran 2027'den sonra bağlanan yeni büyük yüklerin kısıtlanmasını öngörmekte ve büyük yükü tek bir bağlantı noktasında ya da bir millik yarıçap içinde 50 megavat veya üzeri yük olarak tanımlamaktadır; yükün kendi yeni kapasitesini getirmesine dayanan seçenek, bu yükümlülükten çıkış yoludur. Talep edilen yürürlük tarihi 12 Ekim 2026'dır ve başvuru 7 Ekim 2026 itibarıyla karar beklemektedir. Bundan ayrı olarak FERC, PJM'nin Reliability Backstop mekanizmasını 29 Eylül 2026'da kabul etmiş ve yürürlüğünü 28 Şubat 2027'ye kadar askıya almıştır. 2029/30 ihalesinin Aralık 2026'da yapılması planlanmaktadır (PJM takvimi).
Şebeke ve üretim ekipmanı: sipariş birikimi ve transformatör arzı
Quanta Services, 30 Haziran 2026 itibarıyla şirketin rekor olarak nitelediği 53,4 milyar ABD dolarlık sipariş birikimi bildirmiştir; 30 Haziran 2025'te birikim 35,8 milyar ABD dolarıdır ve şirket rakamlarından hesaplanan artış %49'dur. Şirket sipariş birikimini ABD GAAP'ında tanımlanmayan bir ölçü olarak sunmaktadır; ölçü, kalan edim yükümlülüklerini ve tahmini yenilemeler dahil çerçeve hizmet sözleşmeleri (MSA) kapsamındaki tahmini siparişler ile sabit fiyatlı olmayan bazı sözleşmeleri içermektedir. Toplamın 43,8 milyar ABD doları Elektrik segmentindedir. Kalan edim yükümlülükleri 33,6 milyar ABD doları olup bir yıl önce 19,2 milyar ABD dolarıdır. İkinci çeyrek geliri 9,56 milyar ABD doları, 2026 gelir yönlendirmesi 39,3–39,7 milyar ABD dolarıdır. Açıklama, bir satın almayı anlatırken "the growing data center and mission-critical facility markets" ifadesini kullanmaktadır (Form 8-K, Ek 99.1, 30 Temmuz 2026).
Eaton, Electrical Americas segmentinde 2026 ikinci çeyrek satışını 4,0 milyar ABD doları olarak bildirmiştir; organik artış %18'dir. Segment siparişlerinin on iki aylık hareketli ortalaması organik olarak %41, segment sipariş birikimi yıllık %33 artmıştır. Electrical Global segmentinde siparişlerin on iki aylık hareketli ortalaması organik olarak %33, sipariş birikimi %103 artarak 1.771 milyon ABD dolarından 3.602 milyon ABD dolarına yükselmiştir; organik artış %54'tür (Form 10-Q, 31 Temmuz 2026). Birikim rakamı 12 Mart 2026'da satın alınan Boyd Thermal'i içermektedir. Açıklamada (Form 8-K, Ek 99) şirketin icra kurulu başkanı şu ifadeyi kullanmıştır: "While data centers remain a key growth driver, we are benefiting from robust demand across our end markets."
GE Vernova, gaz ekipmanı sipariş birikimi ile üretim sırası rezervasyonlarının toplamının 2026'nın ikinci çeyreğinde 100 gigavattan 116 gigavata çıktığını bildirmiştir; sipariş birikimi 44 gigavattan 53 gigavata, rezervasyonlar 56 gigavattan 63 gigavata yükselmiştir. Rezervasyonlar kesin sipariş değildir. Şirketin 2026 sonu hedefi en az 125 gigavattır. Electrification segmentinde yıl başından bu yana veri merkezi siparişleri 5 milyar ABD dolarını aşmış olup şirketin ifadesiyle "more than double our 2025 total" düzeyindedir. Şirketin toplam sipariş birikimi 176 milyar ABD dolarıdır (Form 8-K basın bülteni, 22 Temmuz 2026).
Schneider Electric ikinci çeyrek gelirini 11,5 milyar avro olarak bildirmiştir; organik artış %17, Kuzey Amerika'daki organik artış %23'tür (yarıyıl sonuçları, 30 Temmuz 2026, sektör basını aktarımı). Ayrı bir veri merkezi sipariş rakamı incelenen kaynaklarda bulunmamaktadır.
Transformatör arzı teslim süresi ve arz açığı üzerinden ölçülmektedir. POWER dergisinin 2 Ocak 2026'da aktardığı Wood Mackenzie 2025 ikinci çeyrek anketine göre ortalama teslim süresi güç transformatörlerinde 128 hafta, jeneratör yükseltici transformatörlerde 144 haftadır. Aynı POWER makalesi, fiyatların 2019'dan bu yana sırasıyla %77 ve %45 arttığını aktarmaktadır. 2026 tarihli bir teslim süresi anketi incelenen kaynaklarda bulunmamaktadır. Wood Mackenzie 31 Ağustos 2026 tarihli açıklamasında 2026 arz açığını güç transformatörlerinde yaklaşık %15, trafo merkezlerinde yaklaşık %8 olarak tahmin etmiş ve toplu güç sistemine ilişkin Başkanlık Kararnamesi'nin açığı genişleteceğini belirtmiştir. 26 Ağustos 2026'da imzalanan ve 31 Ağustos 2026'da Federal Register'da yayımlanan 14421 sayılı "Declaring a National Emergency To Secure the United States Bulk-Power System" Kararnamesi, DOE'ye belirlenen yabancı kuruluşlarla bağlantılı toplu güç sistemi ekipmanı işlemlerini yasaklama ya da şarta bağlama yetkisi vermektedir; Wood Mackenzie'nin açıklaması kararnameyi Çin menşeli toplu güç sistemi ekipmanına yönelik bir yasak olarak nitelemektedir.
Hisse piyasası ölçüleri: Nasdaq-100 izleyici fonunun ağırlıkları, fon varlıkları ve değer zinciri şirketlerinin açıklamaları
Invesco'nun, Nasdaq-100 Endeksi'ni izleyen borsa yatırım fonu Invesco QQQ Trust için yayımladığı portföy verisi, fonun 9 Ekim 2026 kapanışındaki varlık dağılımını kaydetmektedir. Ağırlıklar fonun net varlıkları içindeki paylardır; endeksin resmî ağırlıklarına yakındır, ancak onlarla özdeş değildir. En büyük on varlık (Nvidia, Apple, Microsoft, Micron Technology, Amazon, Advanced Micro Devices, Meta, Alphabet A sınıfı, Tesla ve Space Exploration Technologies) net varlıkların %46,8'ini oluşturmaktadır (hesaplanmıştır); ayrı bir kalem olarak listelenen Alphabet C sınıfı payların ağırlığı ise %2,9'dur. Aynı verideki sektör alanına göre gruplandığında Teknoloji olarak sınıflandırılan 47 varlığın payı %67,1'dir (hesaplanmıştır); bu sınıflandırma Alphabet ve Meta'yı Teknoloji, Amazon ve Tesla'yı İhtiyari Tüketim (Consumer Discretionary) grubunda göstermektedir. Kamu Hizmetleri olarak sınıflandırılan dört varlığın (Constellation Energy, American Electric Power, Xcel Energy ve Exelon) payı %1,08, Enerji olarak sınıflandırılan iki varlığın (Baker Hughes ve Diamondback Energy) payı %0,45'tir. Yukarıda aktarılan 6 Ekim 2026 tarihli Google kapasite artırımı sözleşmesinin karşı tarafı Constellation Energy'nin ağırlığı %0,44 olup bu altı varlık içindeki en yüksek ağırlıktır.
StockAnalysis, QQQ'nun varlıklarını 503,49 milyar ABD doları, aynı endeksi izleyen Invesco Nasdaq 100 ETF'nin (QQQM) varlıklarını 111,96 milyar ABD doları, First Trust Nasdaq Clean Edge Smart Grid Infrastructure Index Fund'ın (GRID) varlıklarını 12,02 milyar ABD doları olarak vermektedir. Sayfalar varlık rakamlarının tarihini belirtmemektedir; her rakam, fonun dolaşımdaki pay sayısının 8 Ekim 2026 kapanış fiyatıyla çarpımına yaklaşık olarak karşılık gelmektedir (hesaplanmıştır). GRID'in 8 Ekim 2026 itibarıyla en büyük on varlığı Quanta Services, Johnson Controls, Eaton, ABB, Schneider Electric, Prysmian, National Grid, E.ON, nVent ve Hubbell olup bu varlıkların portföy içindeki toplam payı %57,5'tir. 11 Ekim 2026'da Invesco fon sayfaları bu rakamları göstermemiş, First Trust internet sitesine erişilememiştir; bu nedenle üç varlık rakamı ve GRID portföy verisi ikincil kaynaktan alınmıştır.
Tablo 3, veri merkezi değer zincirinin dört halkasına ilişkin şirket açıklamalarını listelemektedir: optik bağlantı, özel çip, optik fiber ve güç yoğun veri merkezi barındırma. İki kalem şirket bildirimlerinden alınmamıştır. Lumentum'un icra kurulu başkanının 9 Ekim 2026'da Bloomberg Television'a verdiği röportajda şirketin durumunu "almost sold out for 2029" olarak nitelediği aktarılmaktadır; diğer ikincil haberler dönemi "through early 2029" olarak vermektedir ve ifade herhangi bir SEC bildiriminde yer almamaktadır. Marvell'in 6 Ekim 2026 tarihli Yatırımcı Günü etkinliğinde 2028 mali yılı gelir hedefini yaklaşık 18 milyar ABD dolarından yaklaşık 20 milyar ABD dolarına yükselttiği ikincil kaynaklarda aktarılmaktadır; 11 Ekim 2026'da şirketin yatırımcı ilişkileri sitesinde bu hedefi içeren bir şirket açıklaması bulunamamıştır. Corning'in çekirdek satışları, ABD genel kabul görmüş muhasebe ilkeleri (GAAP) dışında kalan bir ölçüdür; şirketin GAAP'a göre çeyrek net satışları 4.505 milyon ABD dolarıdır.
Tablo 3. Veri merkezi değer zincirinde şirket açıklamaları (aksi belirtilmedikçe milyon ABD doları)
Halka
Şirket
Bildirilen kalem
Değer
Dönem
Kaynak
Optik bağlantı
Lumentum
Net gelir
1.006,3 (bir yıl önce 480,7; +%109,3)
2026 mali yılı 4. çeyrek, 27 Haziran 2026'ya kadar
Form 8-K, Ek 99.1, 11 Ağustos 2026
Özel çip ve bağlantı
Marvell
Net gelir; bunun veri merkezi kısmı
2.739,3 (+%37); 2.171,5 (+%46)
2027 mali yılı 2. çeyrek, 1 Ağustos 2026'ya kadar
Form 8-K, Ek 99.1, 27 Ağustos 2026
Optik fiber
Corning
Çekirdek satışlar; Optik İletişim segmenti net satışları
4.738 (+%17); 2.072 (bir yıl önce 1.566; +%32)
2026 2. çeyrek
Form 8-K, Ek 99, 28 Temmuz 2026
Güç yoğun veri merkezi barındırma
IREN
Gelir; bunun yapay zekâ bulut hizmetleri kısmı
707,0 (2025 mali yılında 501,0); 128,8
2026 mali yılı, 30 Haziran 2026'ya kadar
Form 8-K, Ek 99.1, 27 Ağustos 2026
Güç yoğun veri merkezi barındırma
IREN
Güç kapasitesi (şirket beyanı)
imzalanmış şebeke bağlantı sözleşmeleri, mutabakat mektupları veya eşdeğerleri kapsamında yaklaşık 5 GW; işletmedeki yapay zekâ bulut hizmetleri kapasitesi yaklaşık 40 MW; bitcoin madenciliği kapasitesi yaklaşık 380 MW
30 Haziran 2026 itibarıyla
Form 10-K, 30 Haziran 2026'da sona eren mali yıl
Yüzde değişimler şirket açıklamalarında belirtildiği şekildedir. Corning çekirdek satışları ve 2025 2. çeyrek çekirdek rakamları şirketin GAAP dışı tanımına dayanmaktadır; şirket bu tanımdaki kur düzeltmesini 1 Nisan 2026'dan itibaren değiştirmiş, 2025 rakamlarını yeniden hesaplamamıştır. Şirket, yeni düzeltmenin 2025 rakamlarına uygulanması durumunda yıllık büyüme oranlarının daha yüksek çıkacağını belirtmektedir. Optik İletişim segment satışları da aynı GAAP dışı esasa dayanmaktadır. IREN'in 5 GW rakamı ABD, Kanada, İspanya ve Avustralya'yı kapsamaktadır ve işletmedeki kapasite değildir.
Orta Asya: Özbekistan'da veri merkezi taahhütleri
Euronews, 28 Eylül 2026'da Özbekistan'ın dijital teknolojilerden sorumlu bakanının açıklamasına dayanarak, ülkedeki veri merkezi yatırım taahhütlerinin 6 milyar ABD dolarını aştığını aktarmıştır. DataVolt'un Taşkent tesisinin ilk kapasitesi 12 megavat olup ilk fazın 2026 sonunda tamamlanması, toplam kapasitenin 300 megavata ulaşması planlanmaktadır. 150 milyon ABD dolarına kadar proje finansmanı Avrupa İmar ve Kalkınma Bankası (EBRD), Alman kalkınma finansmanı kuruluşu DEG, Fransız kalkınma finansmanı kuruluşu Proparco ve OPEC Uluslararası Kalkınma Fonu tarafından sağlanmaktadır. DataVolt projesinin toplam kapasitesi kaynaklara göre farklı verilmektedir (300 ve 500 megavat); burada Euronews'un aktardığı rakam kullanılmıştır.
Ölçülen büyüklüklerin özeti
Seri
Değer
Dönem
Kaynak
Dört şirketin yatırım harcaması yönlendirmesi
735–750 milyar ABD doları (Platformonomics toplamı); Microsoft 175 milyar ABD doları alındığında bileşen toplamı 720–745 milyar ABD doları
2026
Platformonomics derlemesi; tanımlar farklı
En büyük teknoloji şirketlerinin yatırım harcaması
400 milyar ABD dolarının üzerinde; 2026'da yaklaşık +%75 bekleniyor
2025
IEA, Nisan 2026
Anthropic altyapı yükümlülükleri
en az 518 milyar ABD doları, yaklaşık %80'i iptal edilemez
2026–2036
Reuters'ın incelediği taslak bildirim
Küresel veri merkezi elektriği
485 TWh (2025); 950 TWh (2030)
2025–2030
IEA, Nisan 2026
ABD elektrik üretimi
4.430 / 4.545 / 4.613 milyar kWh
2025 / 2026 / 2027
EIA STEO, Ekim 2026
Duyurulan nükleer kapasite artırımı sözleşmeleri
yaklaşık 1.176 MW (üç sözleşme)
21.09–06.10.2026
Şirket açıklamaları; toplam hesaplanmıştır
DOE şartlı taahhüdü kapsamındaki nükleer artırım
433 MW (4,2 milyar ABD dolarına kadar)
05.10.2026
DOE açıklaması
PJM 2028/29 güvenilirlik gereksinimine göre açık
6.831 MW
Temmuz 2026 ihalesi
PJM
Quanta Services sipariş birikimi
53,4 milyar ABD doları (+%49, hesaplanmıştır; GAAP dışı ölçü)
30.06.2026
SEC bildirimi
GE Vernova gaz ekipmanı birikimi ve rezervasyonları
116 GW
2026 2. çeyrek
SEC bildirimi
Transformatör arz açığı
yaklaşık %15 (güç transformatörü); yaklaşık %8 (trafo merkezi)
2026 tahmini
Wood Mackenzie
Nasdaq-100 izleyici fonu (QQQ): en büyük on varlık
net varlıkların %46,8'i (hesaplanmıştır)
09.10.2026
Invesco portföy verisi
QQQ'da Teknoloji / Kamu Hizmetleri / Enerji sınıfı varlıklar
%67,1 / %1,08 / %0,45 (hesaplanmıştır)
09.10.2026
Invesco portföy verisi, fonun sektör alanı
QQQ'da Constellation Energy ağırlığı
%0,44
09.10.2026
Invesco portföy verisi
Fon varlıkları: QQQ / QQQM / GRID
503,49 / 111,96 / 12,02 milyar ABD doları
08.10.2026 (kapanış fiyatı; hesaplanmıştır)
StockAnalysis (ikincil)
IREN'in imzalanmış şebeke bağlantı sözleşmeleri, mutabakat mektupları veya eşdeğerleri kapsamındaki güç kapasitesi
yaklaşık 5 GW; işletmedeki yapay zekâ bulut kapasitesi yaklaşık 40 MW
30.06.2026
Form 10-K (şirket beyanı)
Özbekistan veri merkezi taahhütleri
6 milyar ABD dolarının üzerinde
Eylül 2026
Euronews, dijital teknolojilerden sorumlu bakana atıfla
Kaynaklar (erişim 11 Ekim 2026).
İngilizce sürümdeki kaynak listesi geçerlidir. Rakamlar kamuya açık kaynaklardan aktarılmıştır; telif kapsamındaki grafik ve tablolar yeniden üretilmemiştir. Analiz: UzEnergyNews Editorial Desk. Veri kesimi 10 Ekim 2026; kaynaklara erişim 11 Ekim 2026.
WEEKLY INSIGHT #20 · ELECTRIFICATION · RENEWABLES1 October 2026 · 22 min read EN · 18 dk TR · Global
23 Per Cent in 2025, 35 Per Cent Proposed for 2035: the IEA electrification measurements, IRENA's tripling and efficiency tracking, and the grid investment values ahead of COP31
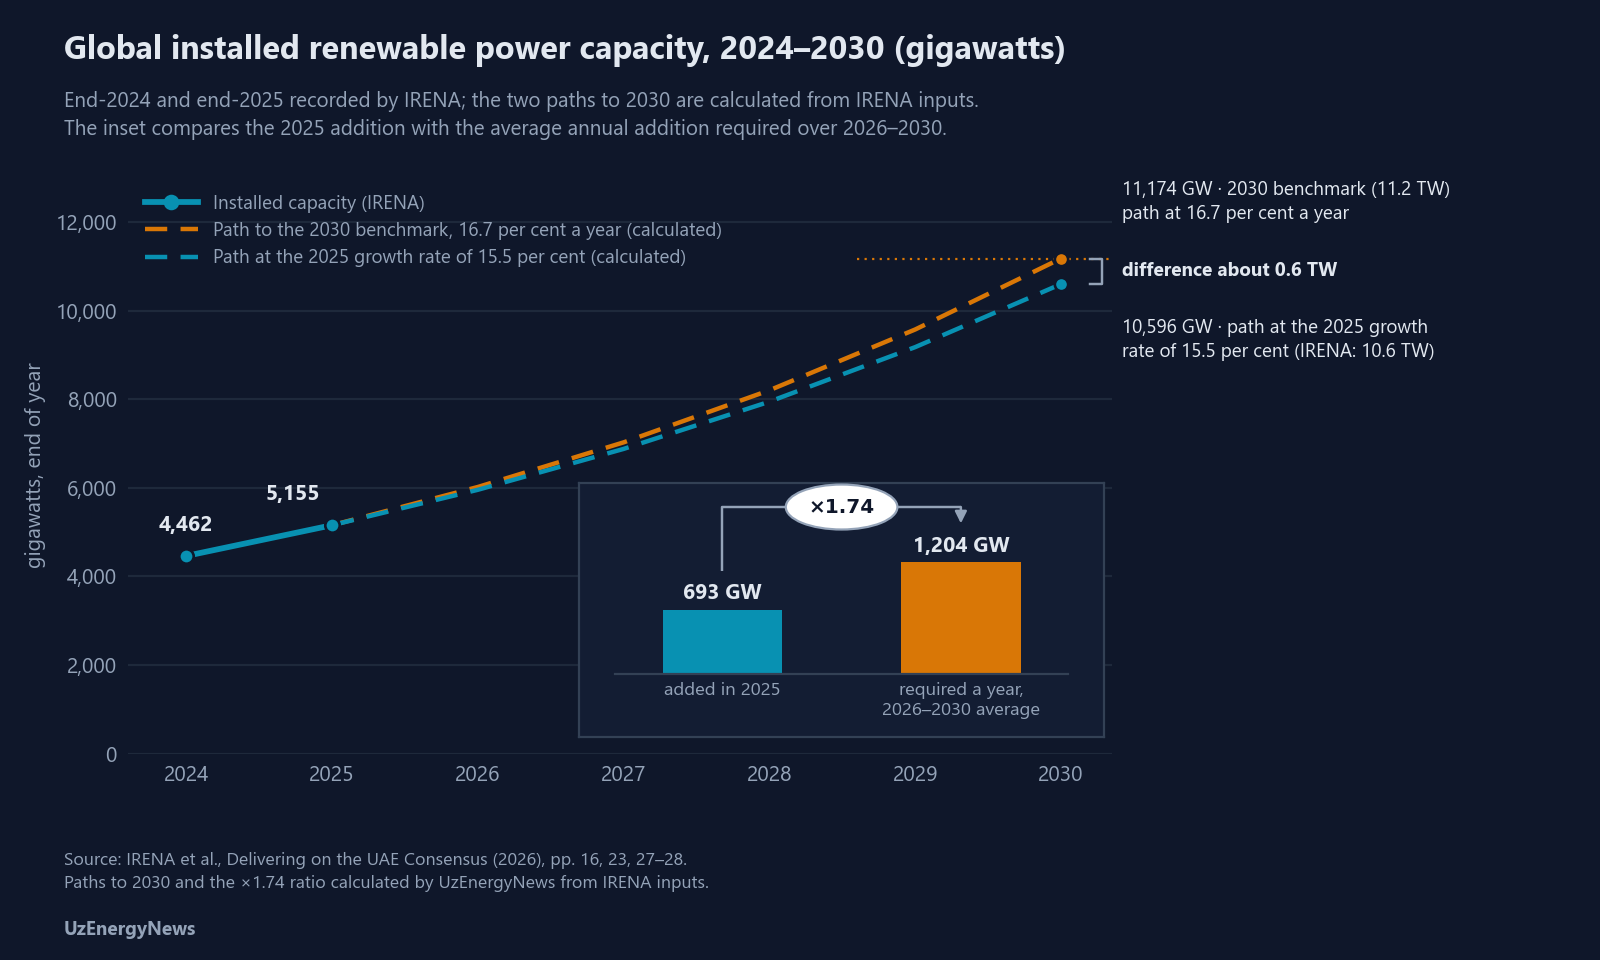
The International Energy Agency (IEA) measures electricity at 17 per cent of global final energy consumption in 2000 and 23 per cent in 2025. It places the 2035 share at about 30 per cent in scenarios based on "today's policy settings" and at 35 per cent in its High Electrification Scenario (IEA, Electrification – Special Report, 22 September 2026). The Presidency of the 31st Conference of the Parties to the United Nations Framework Convention on Climate Change (COP31) proposes 35 per cent by 2035 as a global objective for the conference in Antalya on 9–20 November 2026. The International Renewable Energy Agency (IRENA) published the third report in its annual tracking series with the COP31 Presidency and the Global Renewables Alliance on 21 September 2026. It records 5.15 terawatts of installed renewable power capacity at the end of 2025 after 693 gigawatts of additions in that year. The 2030 benchmark is 11.2 terawatts, and IRENA calculates the required additions at about 1.2 terawatts a year over 2026–2030. Energy intensity improved by 1.7 per cent in 2025; IRENA calculates the rate required over 2026–2030 at 5.6 per cent a year. This edition sets out the two measurement series, the rate each target requires against the rate recorded, and the grid investment values in both reports with their scope and price basis.
Publication details and the status of the 35 per cent proposal
The IEA released Electrification – Special Report on 22 September 2026 as a 198-page publication under a Creative Commons CC BY 4.0 licence. The governments of Türkiye and Australia requested the report. Türkiye is designated to hold the COP31 Presidency, and Australia is designated as COP31 President of Negotiations. The report was prepared within a strategic partnership between the COP31 Presidency and the IEA (IEA, pp. 3, 15, 25). Its three forewords are signed by the IEA Executive Director, the COP31 President-Designate and the COP31 President of Negotiations. Page references to the IEA report are given below as "IEA, p."
IRENA published the third edition of its annual tracking series, Delivering on the UAE Consensus: Tracking progress toward tripling renewable energy capacity and doubling energy efficiency by 2030 (ISBN 978-92-9260-750-0), jointly with the COP31 Presidency and the Global Renewables Alliance (GRA). IRENA was designated in early 2024 as the custodian agency for tracking two of the United Arab Emirates (UAE) Consensus goals (IRENA, p. 2). IRENA announced the release of the report on its official X account on 21 September 2026, and its launch press release places the release during Climate Week NYC. Page references to the IRENA report are given below as "IRENA, p." COP31 takes place in Antalya from 9 to 20 November 2026 (IRENA, p. 3).
The two targets tracked by IRENA come from paragraph 28 of the Outcome of the First Global Stocktake, agreed by 198 Parties at the 28th Conference of the Parties (COP28) in Dubai in 2023. The paragraph calls on Parties to contribute to "(a) Tripling renewable energy capacity globally and doubling the global average annual rate of energy efficiency improvements by 2030" (IRENA, p. 2).
Both reports present the 35 per cent electrification figure as a proposal of the COP31 Presidency:
IRENA report (p. 9). The COP31 President-Designate writes that the Presidency will advance its global electrification objective "to increase the share of electricity in global final energy consumption to 35% by 2035". The foreword issues "a global invitation for all actors to align behind this target".
IEA report (p. 5). The COP31 President-Designate refers to a "35-by-35 target" and writes that "Antalya will be the moment we commit to it together".
IRENA report (p. 11). Australia's Minister for Climate Change and Energy, as COP31 President of Negotiations, writes that Australia is working with Türkiye "to make COP31 an 'Electrification COP'".
The IEA report describes the 35 per cent level as a "goal, currently under international discussion" (IEA, p. 16). Neither report records the 35 per cent figure as an adopted decision of the Conference of the Parties.
As of 9 June 2026, 120 third-generation nationally determined contributions (NDC 3.0) had been submitted to the United Nations Framework Convention on Climate Change (NDC Registry data cited in IRENA, p. 55). They cover 77 per cent of global emissions. Of these submissions, 67 per cent contain a quantified renewable energy target and 43 per cent a quantified energy efficiency target (IRENA, p. 55).
The IEA measure: electricity's share of final energy consumption, 2000–2035
The IEA defines the electrification rate as the share of electricity in total final energy consumption (IEA, pp. 28–31, 186–187):
Non-energy uses such as chemical feedstocks are excluded from the denominator.
Traditional biomass is included. In the IEA's words, this "lowers the electrification rate" (IEA, p. 31).
International marine and aviation bunkers are included under transport in the world total.
The denominator is the one used for United Nations Sustainable Development Goal indicator 7.2.1 (IEA, p. 187).
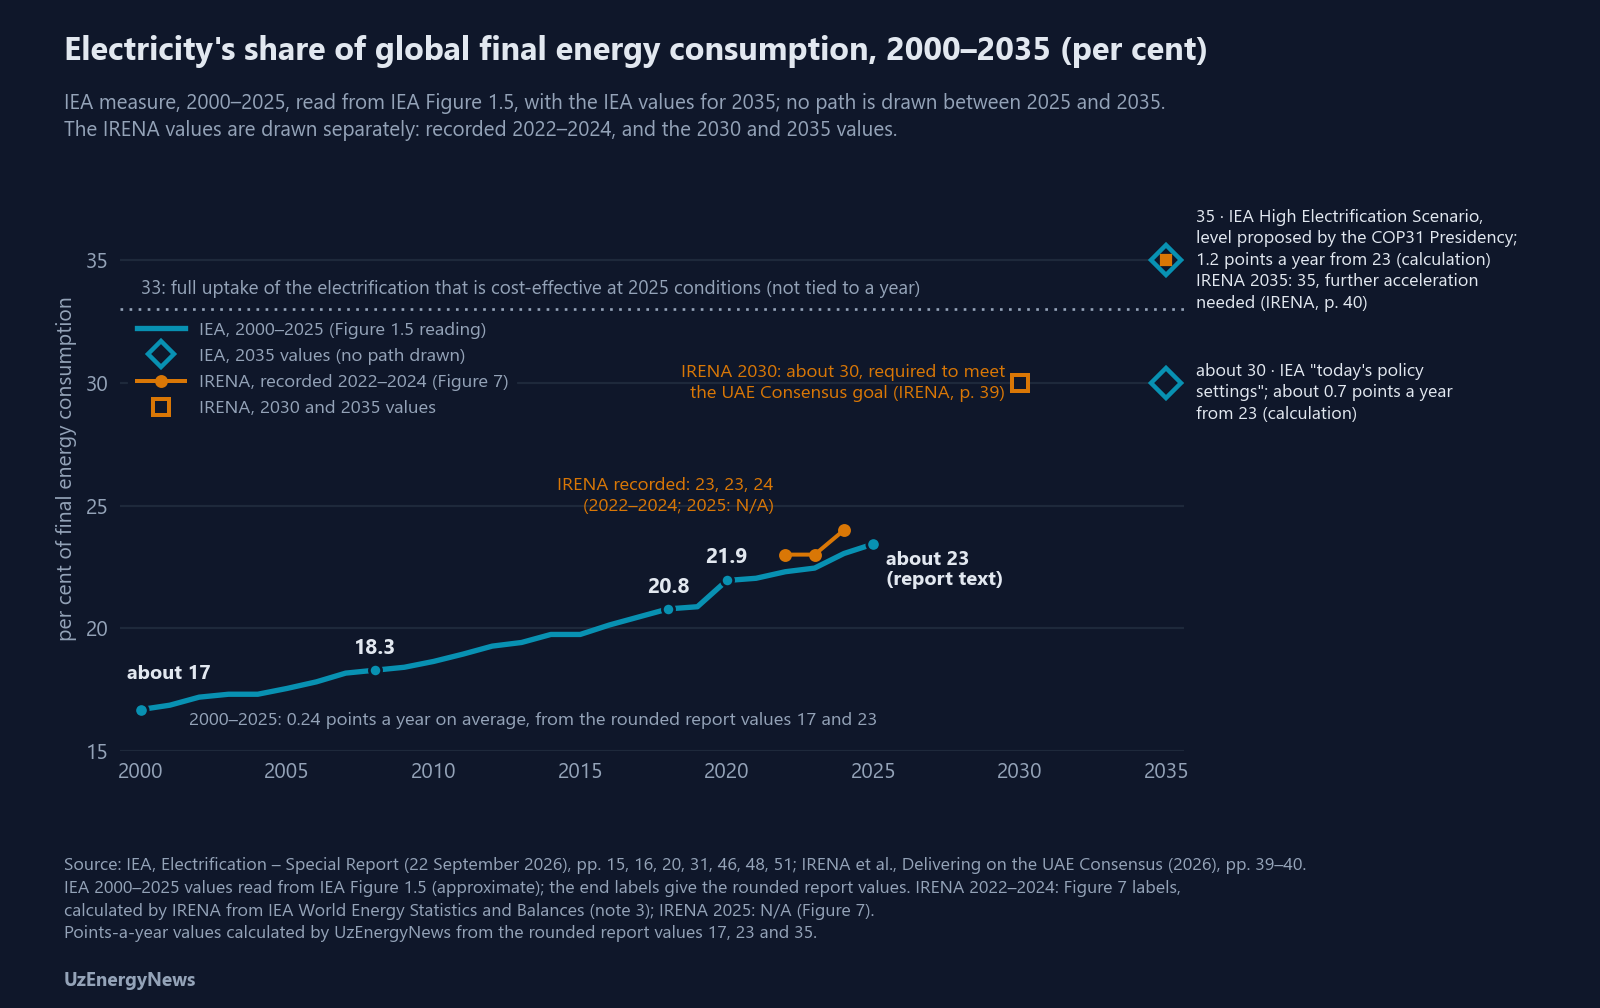
On this measure, electricity accounted for 17 per cent of global final energy consumption in 2000 and 23 per cent in 2025 (IEA, pp. 16, 31). These two rounded values from the report text give an average increase of 0.24 percentage points a year over 2000–2025 (calculation). Values read from IEA Figure 1.5 place the share at about 16.7 per cent in 2000, 18.3 per cent in 2008, 20.8 per cent in 2018, 21.9 per cent in 2020 and 23.4 per cent in 2025 (IEA, p. 31). On the 2000 and 2025 readings the average increase is about 0.27 points a year (calculation).
The IEA report gives three values for 2035:
About 30 per cent under "today's policy settings". In scenarios based on "today's policy settings" the share reaches "around 30%" (IEA, p. 20). Page 48 states it as "slightly less than 30%". This corresponds to about 0.7 points a year over 2025–2035 (calculation).
35 per cent in the High Electrification Scenario (IEA, pp. 15, 46). This is an average of 1.2 points a year over 2025–2035, five times the 2000–2025 average of 0.24 points; both rates are calculated from the rounded report values of 17, 23 and 35 per cent (calculation). The scenario is derived from the IEA's Net Zero Emissions by 2050 Scenario (IEA, p. 16).
33 per cent at full uptake of cost-effective electrification. This is the share that results if all electrification that is cost-effective for consumers at 2025 technology costs, energy prices and financing conditions is taken up. The calculation excludes system costs (IEA, p. 51).
The IEA report places the 33 per cent value "today" on pages 15 and 53 and "in 2035" on page 51. This edition states it on the 2025-conditions basis set out on page 51. The IEA states that its scenarios are not forecasts and that all of them use the same population and economic growth assumptions (IEA, p. 45).
By sector, electricity supplied about 40 per cent of final energy use in buildings, 28 per cent in industry and about 2 per cent in transport in 2025 (IEA, pp. 30, 31, 88). In the High Electrification Scenario the 2035 shares are about 56 per cent for buildings and about 39 per cent for industry, both read from IEA Figure 2.1 on page 49, which compares the Stated Policies Scenario (STEPS) with the High Electrification Scenario. The 2035 share for transport is 13 per cent (IEA, p. 49).
Global electricity demand exceeded 28,500 terawatt-hours (TWh) in 2025 (IEA, p. 27). Weekly Insight #13 of 30 July 2026 carried 28,600 TWh as the starting level, taken from the IEA Electricity Mid-Year Update of 23 July 2026. Annual demand growth averaged 750 TWh over 2015–2025. The IEA puts it at about 925 TWh a year in the Stated Policies Scenario and about 1,400 TWh a year in the High Electrification Scenario (IEA, p. 51).
Electrification in the IRENA report and the energy efficiency target
IRENA measures electrification as a component of the energy efficiency goal. IRENA states that electricity's share of total final energy consumption must rise from 23 per cent in 2023 to around 30 per cent by 2030 to meet the UAE Consensus goal (IRENA, p. 39). Page 40 states that further acceleration will be needed to reach 35 per cent by 2035 and cites IRENA's May 2026 report Transitioning away from fossil fuels for this value (IRENA, p. 40). IRENA's sector shares for 2023 and 2030 are (IRENA, p. 39):
buildings: 36 and 53 per cent;
industry: 27 and 31 per cent;
transport: 1 and 7 per cent.
IRENA Figure 7 gives the total electrification rate as 23 per cent in 2022 and 2023 and 24 per cent in 2024, and "N/A" for 2025; note 3 of the figure states that the recent-year values are calculated from IEA World Energy Statistics and Balances (IRENA, p. 40). For 2024 the reading of IEA Figure 1.5 is about 23.0 per cent (IEA, p. 31). Neither report explains the difference of about 1 point. IRENA's sector values are for 2023 and the IEA's for 2025, and IRENA names no source for its sector values on page 39. Because the two sets of sector values rest on different base years, this edition shows them separately and does not compare them line by line.
IRENA measures energy intensity as total primary energy supply divided by gross domestic product at 2025 purchasing power parity (IRENA, p. 38). Energy intensity improved by 1.7 per cent in 2025 (IRENA, pp. 16, 38). IRENA Figure 6 gives 2.0 per cent for 2022 and 1.1 per cent for each of 2023 and 2024 (IRENA, p. 38). IRENA expresses the goal of doubling energy efficiency from 2022 levels as an improvement of 4 per cent a year over 2023–2030. After the rates recorded for 2023–2025, the average required over 2026–2030 is 5.6 per cent a year (IRENA, pp. 7, 38), 3.3 times the 2025 rate (calculation). IRENA's updated Planned Energy Scenario gives about 3 per cent a year for 2026–2030 (IRENA, p. 38). The IRENA Director-General's foreword states that "the UAE Consensus goals may no longer be sufficient to keep the world on 1.5°C-compatible pathway" (IRENA, p. 7).
Renewable capacity: 5.15 TW at end-2025 against the 11.2 TW benchmark for 2030
Installed renewable power capacity reached 5.15 terawatts (TW) at the end of 2025, equal to 5,155 gigawatts (GW); 1 TW equals 1,000 GW (IRENA, pp. 23, 27). Additions in 2025 were 693 GW. The growth rate was just over 15.5 per cent, against 15.1 per cent in 2024 (IRENA, p. 23). The GRA foreword in the same report states the 2025 addition as 692 GW (IRENA, p. 13); this edition uses the 693 GW of the main text.
The 2025 additions by technology were (IRENA, pp. 25–26):
solar photovoltaics: 513 GW, about three quarters of the total;
wind: 158 GW, of which 150 GW onshore;
hydropower, excluding pumped storage: 18.3 GW;
bioenergy, geothermal, concentrated solar power and marine energy together: about 4 GW, of which 72 per cent was bioenergy.
Variable renewables accounted for 96.9 per cent of net renewable additions in 2025 (IRENA, p. 25).
The 2030 benchmark is 11,174 GW, rounded to 11.2 TW. IRENA derived it from the analysis in its World Energy Transitions Outlook, which formed the statistical basis of the COP28 goal. IRENA retains the benchmark for continuity across the series (IRENA, p. 25).
Reaching the benchmark requires 6.02 TW of additions over 2026–2030. That is an average of about 1.2 TW a year and a compound annual growth rate of 16.7 per cent, against 16.6 per cent in the 2025 edition (IRENA, p. 23). The key findings and IRENA Figure 2 give the annual average as 1,204 GW (IRENA, pp. 16, 27). The required annual average is 1.74 times the 2025 addition (calculation).
If the 2025 growth rate of 15.5 per cent were maintained, capacity would reach 10.6 TW at the end of 2030, a shortfall of about 0.6 TW (IRENA, p. 23). IRENA compares this shortfall with North America's 2025 year-end renewable capacity of 612 GW (IRENA, p. 24). The shortfall stated in the series was:
1.49 TW in the 2024 edition (as cited in IRENA, p. 13);
0.9 TW in the 2025 edition (as cited in IRENA, p. 23);
0.6 TW in the 2026 edition (IRENA, p. 23).
By technology, the average annual additions required over 2026–2030 are 614 GW for solar photovoltaics (IRENA Figure 2 label, p. 27), 449 GW for wind and 34 GW for hydropower (IRENA, p. 26). If the benchmark is reached, variable renewables would account for about 62 per cent of total installed power capacity in 2030 (about 42 per cent solar and 20 per cent wind). The 2025 share is about 35 per cent (IRENA, p. 23).
Installed renewable power capacity by technology (gigawatts)
Technology
End-2024
End-2025
2030 benchmark
Solar photovoltaics
1,876
2,388
5,457
Onshore wind
1,050
1,200
3,040
Offshore wind
83
91
494
Hydropower (excluding pumped storage)
1,278
1,296
1,465
Bioenergy
153
155
343
Concentrated solar power
7
8
197
Geothermal
15
16
105
Marine
0.5
0.5
72
Total
4,462
5,155
11,174
Source: IRENA, Figure 3, p. 28. The text on pages 25–26 also states the 2025 values for solar photovoltaics, hydropower, bioenergy, geothermal and concentrated solar power, and the 2025 wind total of 1,291 GW. Rows do not sum exactly to the totals because of rounding in the source.
IRENA reports that commissioning in China was brought forward ahead of a pricing reform that took effect in June 2025. Nearly 93 GW of solar was installed in May 2025 alone (IRENA, p. 57). Against that base, Chinese solar additions in the first half of 2026 were 66 per cent lower year on year and wind additions about 25 per cent lower (Reuters report cited in IRENA, p. 57). The IRENA Director-General's foreword refers to "indications of a potential slowdown in capacity expansion" (IRENA, p. 7). As of 1 October 2026, full-year 2026 capacity statistics had not been published.
In 2025, 90 per cent of newly commissioned utility-scale renewable capacity produced electricity at a lower cost than the cheapest newly installed fossil fuel alternative. Global weighted-average levelised costs of electricity were 33 dollars a megawatt-hour for onshore wind, 44 dollars for solar photovoltaics and 78 dollars for offshore wind. Excluding China, the values for solar photovoltaics and onshore wind were 55 and 51 dollars a megawatt-hour (IRENA, p. 32). Battery storage additions reached 112 GW and 307 gigawatt-hours in 2025, 48 per cent more in power terms than in 2024 (BloombergNEF data cited in IRENA, p. 46).
Investment values in the two reports: scope, year and price basis
Values in the text of this section are in United States dollars at 2025 prices unless stated otherwise; 1 trillion equals 1,000 billion. The table of values carried in earlier editions states the price basis of each row in a separate column.
Renewable power and energy efficiency. Investment in renewable power generation capacity was 625 billion dollars in 2025, against 641 billion dollars in 2024. Solar photovoltaics accounted for 417 billion dollars, wind for 155 billion, hydropower for 37 billion and bioenergy for 12 billion (IRENA, pp. 45, 47). IRENA calculates this investment as annual capacity additions multiplied by the global weighted-average installed cost of each technology (IRENA, p. 45).
IRENA puts the renewable requirement at 8.6 trillion dollars over 2026–2030, an average of about 1.7 trillion dollars (1,725 billion) a year (IRENA, pp. 45, 47). By technology, IRENA states that annual investment in wind and hydropower must scale up to five and four times the 2025 levels respectively, and investment in bioenergy tenfold (IRENA, p. 45). Investment in energy efficiency and conservation was 369 billion dollars in 2025 (IRENA, pp. 46–47; page 16 of the same report gives 362 billion dollars), against a requirement of 3.2 trillion dollars (3,182 billion) a year over 2026–2030 (IRENA, pp. 46–47).
Across renewable power, energy efficiency, and grids and flexibility, IRENA records 1,518 billion dollars in 2025 against a required 5,782 to 5,889 billion dollars a year (IRENA, p. 47); the component values shown in the source differ from these totals by 1 billion dollars because of rounding (calculation). Total energy investment was 3.3 trillion dollars in 2025 (IRENA, p. 46, citing the IEA's World Energy Investment 2026). In the IEA report, investment in electricity supply and grids is set to reach 1.6 trillion dollars in 2026. Including end-use electrification the total is 2 trillion dollars, about 60 per cent of total global energy investment in 2026 (IEA, p. 34).
Grids in the IEA report. Investment in transmission and distribution networks was about 315 billion dollars in 2015 (IEA, p. 34, where no price basis is stated for this value), about 295 billion dollars in 2020 and 450 billion dollars in 2025. It reaches about 930 billion dollars in 2035 in the High Electrification Scenario with the Net Zero Emissions supply mix (IEA, p. 145). The 2035 value is 2.07 times the 2025 level, equivalent to about 7.5 per cent a year over 2025–2035 (calculation). In the IEA's words, "nearly two-thirds of investment in grids is in distribution networks" (IEA, p. 59). The IEA gives global network length as more than 85 million kilometres, of which about 80 million kilometres is distribution, without stating a year (IEA, p. 115). It reaches about 115 million kilometres in 2035 in the same scenario (IEA, pp. 115–116).
Grids and flexibility in the IRENA report. IRENA records 525 billion dollars of investment in grids and flexibility in 2025 (IRENA, p. 46). The total has two components, and the IRENA report cites the IEA's World Energy Investment 2026 for both:
422 billion dollars for grid infrastructure, 12 per cent more than in 2024 (IRENA, p. 46, citing World Energy Investment 2026);
103 billion dollars for energy storage including pumped hydropower, 33 per cent more than in 2024 (IRENA, p. 46, citing World Energy Investment 2026).
IRENA Figure 8 labels give the grids-and-flexibility total as 390 billion dollars in 2023 and 455 billion dollars in 2024; note 2 of the figure states that the recent-year values are compiled from IRENA, BloombergNEF and IEA data (IRENA, p. 47).
For 2026–2030 IRENA states a requirement of "up to USD 1 trillion" a year on average. It consists of about 800 billion dollars for grids and up to 200 billion dollars for storage (IRENA, p. 46). IRENA Figure 8 gives the range as 874 to 981 billion dollars a year (IRENA, p. 47). That range is 1.66 to 1.87 times the 2025 value of 525 billion dollars (calculation). The IRENA report also gives about 902 billion dollars a year of grid investment to 2030 under IRENA's revised 1.5°C Scenario, citing IRENA's May 2026 report Transitioning away from fossil fuels (IRENA, p. 64, where no price basis is stated for this value). The watch points below record the source of this value.
The 2025 value used in this edition. The IRENA report carries two values for 2025 network investment:
422 billion dollars for grid infrastructure (IRENA, p. 46, citing World Energy Investment 2026);
"around USD 450 billion" for transmission and distribution (IRENA, p. 64, citing BloombergNEF and the IEA).
The IEA Electrification report gives 450 billion dollars (IEA, p. 145). The IEA's World Energy Investment 2026 states that grid spending "rose USD 45 billion in 2025 to nearly USD 450 billion", in 2025 dollars (World Energy Investment 2026, p. 96). This edition uses 450 billion dollars, the value that appears in the IEA report, on page 64 of the IRENA report and in World Energy Investment 2026. The 422 billion dollars is stated as the grid component of IRENA's 525 billion dollar grids-and-flexibility total. Battery storage investment is 80 billion dollars in the IEA report (IEA, p. 145). The IRENA report gives 103 billion dollars for storage including pumped hydropower (IRENA, p. 46). The two values have different stated scopes; the watch points below record the source of the 103 billion dollar value.
Values carried in earlier editions of this publication. Weekly Insights #9 and #17 carried grid values from earlier releases. Each row below is a separate measurement from a separate publication, year, scope or scenario.
Publication and date (where stated)
Year or period
Scope
Value (billion dollars)
Price basis
Carried in
IEA, World Energy Investment 2025
2024–2025
global grid investment
about 400
publication's own basis; not converted
Weekly Insight #9 (27 June 2026)
IEA, as cited in #9 (publication not named in #9)
2030 requirement
global grid investment
more than 600
publication's own basis; not converted
#9
IEA, Electricity 2026 (February 2026), as cited in #17
year not stated in the source (Electricity 2026, pp. 10, 46)
global grid investment
about 400
publication's own basis; not converted
Weekly Insight #17 (4 September 2026)
IEA, Electricity 2026 (February 2026), as cited in #17
2030 requirement
global grid investment
about 600 (calculation: roughly 50 per cent above about 400; Electricity 2026, pp. 10, 46)
publication's own basis; not converted
#17
IEA, World Energy Investment 2026 (May 2026)
2026
global grid investment (transmission and distribution)
about 550
USD 2025, MER
#17
IRENA, "Funding Grid and Storage Enhancement: The Call for Stronger Public-Private Collaboration" (8 January 2026)
a year until 2030, IRENA 1.5°C Scenario
grid investment requirement
671
publication's own basis; not converted
#17
IEA, Electrification (22 September 2026)
2025
global grid investment (transmission and distribution)
450
USD 2025, MER
this edition
IEA, Electrification (22 September 2026)
2035, High Electrification Scenario, Net Zero Emissions supply mix
global grid investment (transmission and distribution)
about 930
USD 2025, MER
this edition
IRENA tracking report (2026 edition)
2025
grids and flexibility, including storage
525 (422 grids, 103 storage)
USD 2025
this edition
IRENA tracking report (2026 edition)
2026–2030 annual average, tripling calculation
grids and flexibility, including storage
874–981 (p. 47); p. 46 gives up to 1,000, of which about 800 grids and up to 200 storage
USD 2025
this edition
IRENA tracking report (2026 edition), p. 64, citing IRENA's Transitioning away from fossil fuels (May 2026)
a year to 2030, revised 1.5°C Scenario
grids
about 902
not stated on p. 64; not converted
this edition
Sources: IEA, Electrification, pp. 145–146; IRENA tracking report, pp. 46–47, 64; IEA, World Energy Investment 2026, pp. 9, 95; IEA, Electricity 2026, pp. 10, 46; IRENA article of 8 January 2026; earlier values as carried in Weekly Insights #9 and #17. "USD 2025, MER" is the unit stated in the IEA charts (World Energy Investment 2026, p. 95; Electrification, p. 146); "USD 2025" is stated in IRENA Figure 8, note 1 (p. 47). "Publication's own basis; not converted" marks rows whose price basis was not verified; those values are not converted to 2025 prices.
Connection queues, curtailment and negative-price hours
About 2,500 GW of renewable, storage and large-load projects at advanced stages are waiting in grid connection queues (IRENA, p. 64, citing the IEA's Electricity 2026). Weekly Insight #17 of 4 September 2026 carried a value of more than 2,500 GW from the same IEA source. Weekly Insight #9 of 27 June 2026 carried about 1,500 GW for advanced renewable projects alone; the two values cover different sets of projects.
The IEA Electrification report gives the additional hosting capacity from two groups of measures, citing the IEA's Electricity 2026 (IEA, p. 119):
grid-enhancing technologies: 450 to 700 GW;
flexible connection arrangements: 750 to 900 GW.
The IRENA report states that the two groups of measures together could connect 1,200 to 1,600 GW of advanced-stage projects (IRENA, p. 65, citing the IEA's Electricity 2026).
Curtailment and price readings:
Germany, France and the Netherlands together curtailed 3.9 TWh of renewable output in 2025, 21 per cent more than in 2024 (Montel Analytics data cited in IRENA, p. 63).
China: national average curtailment was 5.7 per cent for wind and 5.2 per cent for solar in 2025, against 2.7 and 2.0 per cent in 2023 (National Energy Administration data cited in IRENA, p. 63).
Germany: 301 hours of negative wholesale prices in 2023, 457 in 2024 and 573 in 2025 (Bundesnetzagentur data cited in IRENA, p. 66).
More than 60 markets: the average number of negative-price hours rose from 110 in 2019 to more than 450 in 2025 (IEA, p. 58).
Under IRENA's revised 1.5°C Scenario, power system flexibility requirements increase over 2023–2030 by 2.8 times for daily, 2.6 times for weekly and 2.3 times for monthly balancing (IRENA, p. 65).
Oil displacement, import bills and emissions: IEA and IRENA values
The IEA press release of 22 September 2026 is titled "Electrification takes centre stage as Hormuz shock spurs countries to seek to enhance energy security". The IEA report counts 25 countries that have announced new electrification-related policies since February 2026 (IEA, p. 15). Page 36 of the same report dates the start of this count to March.
The IEA gives the oil demand avoided by electric cars, motorcycles, trucks and buses as about 2.3 million barrels a day, without stating a year (IEA, pp. 17, 34). The IEA puts the displacement by electric vehicles in 2035 at about 10 million barrels a day under "today's policy settings" and at 18 million barrels a day in the High Electrification Scenario (IEA, p. 17).
In the High Electrification Scenario, the import bill of energy importers is about one quarter lower in 2035 than in 2025. The reduction is about 400 billion dollars a year, or more than 500 billion dollars when assessed against the higher energy prices of 2026 (IEA, p. 17). End-use emissions fall by about 40 per cent by 2035 in the same scenario. About 5 gigatonnes of carbon dioxide of the reduction comes from electrification and about 3 gigatonnes from other measures (IEA, pp. 18, 156).
In the IRENA report, renewables avoided 480 billion dollars of fossil fuel costs and 8.4 gigatonnes of carbon dioxide emissions in 2025 (IRENA, p. 34). The GRA foreword refers to the constraint on oil and gas supplies caused by the military confrontation in the Strait of Hormuz (IRENA, p. 13). Weekly Insight #19 of 18 September 2026 recorded liquefied natural gas transits through the Strait of Hormuz and European Union storage levels.
Recorded and required values for seven indicators
Indicator
Recorded
Required or scenario value
Ratio (calculation)
Source
Electricity share of final energy consumption, change a year
0.24 points a year, 2000–2025 (calculation)
1.2 points a year, 2025–2035, to reach 35 per cent (calculation)
5.0
IEA, pp. 15, 16, 31, 46
Renewable capacity additions
693 GW in 2025
1,204 GW a year on average, 2026–2030
1.74
IRENA, pp. 16, 23, 27
Energy intensity improvement
1.7 per cent in 2025
5.6 per cent a year, 2026–2030
3.3
IRENA, pp. 16, 38
Transmission and distribution investment
450 billion dollars in 2025
about 930 billion dollars in 2035 (High Electrification Scenario, Net Zero Emissions supply mix)
2.07
IEA, p. 145
Grids and flexibility investment
525 billion dollars in 2025
874–981 billion dollars a year on average, 2026–2030
1.66–1.87
IRENA, pp. 46–47
Renewable power investment
625 billion dollars in 2025
1,725 billion dollars a year on average, 2026–2030
2.76
IRENA, pp. 45, 47
Energy efficiency and conservation investment
369 billion dollars in 2025
3,182 billion dollars a year on average, 2026–2030
8.6
IRENA, pp. 46–47
Investment values in 2025 dollars. Ratios are calculated in this edition from the report values shown. The points-a-year values in the first row are calculated from the rounded IEA report values of 17, 23 and 35 per cent; with the IEA Figure 1.5 readings for 2000 and 2025 (about 16.7 and 23.4 per cent) the two rates are about 0.27 and 1.16 points a year and the ratio is about 4.3 (calculation).
Watch points: items not measured or not reconciled
Item
Status
Status of the 35 per cent objective
Stated in both reports as the COP31 Presidency's proposal and invitation; the IEA report describes it as a "goal, currently under international discussion" (p. 16). Neither report records an adopted decision of the Conference of the Parties; adoption is a matter for COP31, 9–20 November 2026 (IRENA, p. 3).
2024 electrification rate: about 23.0 or 24 per cent
The reading of IEA Figure 1.5 for 2024 is about 23.0 per cent (IEA, p. 31). IRENA Figure 7 gives 24 per cent, calculated from IEA World Energy Statistics and Balances (IRENA, p. 40, note 3). Neither report explains the difference. For 2025 the IEA Figure 1.5 reading is about 23.4 per cent and the report text gives 23 per cent (IEA, pp. 16, 31). The statement in this edition that the two sets of values rest on different base years applies to the sector values only.
2025 grid investment: 422 or 450 billion dollars
The IRENA report carries 422 billion dollars for grid infrastructure, citing World Energy Investment 2026 (p. 46), and about 450 billion dollars for transmission and distribution (p. 64); the IEA Electrification report carries 450 billion dollars (p. 145). World Energy Investment 2026 gives "nearly USD 450 billion" for 2025 and a further 17 per cent increase in 2026 (p. 96), and "around USD 550 billion in 2026, up nearly 20%" (p. 9); its values are in 2025 dollars at market exchange rates. Applied to 450 billion dollars, the 17 per cent rate gives about 527 billion dollars for 2026 (calculation). The 422 billion dollar value was not located in the text of World Energy Investment 2026.
2025 storage investment: 103 billion dollars
The IRENA report gives 103 billion dollars for energy storage including pumped hydropower and cites World Energy Investment 2026 (p. 46). The value was not located in the text of World Energy Investment 2026, which counts pumped hydro storage under renewable power and not under battery storage (World Energy Investment 2026, p. 67). The IEA Electrification report gives 80 billion dollars for battery storage in 2025 (p. 145). Neither the 422 nor the 103 billion dollar component of the 525 billion dollar total was located in the text of World Energy Investment 2026.
Source of the 902 billion dollar grid value
Stated on page 64 of the IRENA report with a citation to IRENA's May 2026 report Transitioning away from fossil fuels. The value was not located in the text of that report, which gives grid investment of about 1 trillion dollars a year over 2026–2035 (Table 1, p. 27) and 5.5 trillion dollars for power grids and energy flexibility over 2026–2030 (p. 26).
Two IRENA 1.5°C grid values: 671 and 902 billion dollars
Weekly Insight #17 carried 671 billion dollars a year, which an IRENA article of 8 January 2026 gives as the annual grid investment need until 2030 under IRENA's 1.5°C Scenario. The IRENA tracking report gives about 902 billion dollars a year to 2030 under IRENA's revised 1.5°C Scenario (p. 64) and states that the revised scenario will feature in the forthcoming World Energy Transitions Outlook 2026 (p. 25). The sources consulted do not reconcile the two values.
Timing of the IEA 33 per cent value
The IEA report places the cost-effective share "today" (pp. 15, 53) and "in 2035" (p. 51); the IEA press release uses "by 2035". This edition states the value at 2025 conditions, the basis given on page 51.
2035 share under "today's policy settings"
"Around 30%" (IEA, p. 20) and "slightly less than 30%" (IEA, p. 48). Neither page names a scenario. Page 51 names the Stated Policies Scenario for the demand growth value of about 925 TWh a year, and IEA Figure 2.1 on page 49 is labelled "STEPS and HES" (HES: High Electrification Scenario). The 2035 share is stated here as about 30 per cent in scenarios based on "today's policy settings".
Start of the count of 25 countries
"Since February 2026" (IEA, p. 15) and "Since March, around 25 countries" (IEA, p. 36).
2025 solar and wind additions
The IEA report gives about 600 GW of solar and about 140 GW of wind on page 35, and about 630 GW and about 160 GW on page 100. IRENA gives 513 GW and 158 GW (pp. 25–26). IRENA states on page 26 that its data cover plants in commercial operation on 31 December, compiled mainly from official member submissions. Capacity values in this edition are taken from IRENA only.
Values taken from figures
Values from IEA Figure 1.5 (2000–2025 shares) and IEA Figure 2.1 on page 49 are read from the charts and are approximate. Values from IRENA Figures 1, 2, 3, 6, 7 and 8 are chart labels. IRENA calculates the recent-year values in Figure 7 from IEA World Energy Statistics and Balances (p. 40, note 3) and compiles the recent-year values in Figure 8 from IRENA, BloombergNEF and IEA data (p. 47, note 2). The 2024 capacity values match the 2025 values less the 2025 additions to within about 1 GW. The 2024 grids-and-flexibility value of 455 billion dollars is within about 1 billion dollars of the 2025 components discounted by their stated growth rates of 12 and 33 per cent (calculation).
2025 energy efficiency investment: 362 or 369 billion dollars
The IRENA report gives 362 billion dollars on page 16 and 369 billion dollars on pages 46–47; 369 billion dollars is used here.
2025 energy intensity improvement in IRENA's press release
IRENA's launch press release states that energy intensity "improved by around 2% in 2025". The report gives 1.7 per cent (pp. 16, 38); 1.7 per cent is used here.
"More than double" in IRENA's press release
The launch press release gives "nearly USD 1 trillion annually between 2026-2030, more than double 2025 levels". The report gives "up to USD 1 trillion" a year for grids and flexibility (p. 46) and a range of 874–981 billion dollars (p. 47). Against the 525 billion dollar grids-and-flexibility total for 2025, 1 trillion dollars is 1.90 times and the range is 1.66 to 1.87 times (calculation). The grids-only requirement of about 800 billion dollars is 1.90 times the 422 billion dollar grid component (calculation).
Investment requirement across IRENA editions
IRENA's press release of 11 October 2024 on the 2024 edition gives 1.5 trillion dollars a year over 2024–2030 for renewable capacity. IRENA's press release of 14 October 2025 on the 2025 edition gives at least 1.4 trillion dollars a year over 2025–2030 for renewables. The 2026 edition gives 1.7 trillion dollars a year over 2026–2030 for renewable power generation capacity, in 2025 dollars (pp. 45, 47). The price bases of the earlier values were not verified, so the three values are not compared here.
China, full year 2026
The IRENA report publishes only first-half 2026 changes (p. 57). As of 1 October 2026, full-year statistics had not been published.
Sources.
International Energy Agency, Electrification – Special Report (22 September 2026, CC BY 4.0), and IEA press release of 22 September 2026.
International Renewable Energy Agency, COP31 Presidency and Global Renewables Alliance, Delivering on the UAE Consensus: Tracking progress toward tripling renewable energy capacity and doubling energy efficiency by 2030 (2026 edition, ISBN 978-92-9260-750-0). This includes:
data cited in that report from the IEA's World Energy Investment 2026 and Electricity 2026, BloombergNEF, Montel Analytics, China's National Energy Administration, Germany's Bundesnetzagentur, the NDC Registry of the United Nations Framework Convention on Climate Change and a Reuters report of 22 July 2026;
the text of the Outcome of the First Global Stocktake (United Nations Framework Convention on Climate Change, 2023), reproduced on page 2.
IRENA press release "Renewables Gain Ground, but Must Accelerate Towards the 2030 Goal" and IRENA's announcement of the release on X (21 September 2026).
International Energy Agency, World Energy Investment 2026 (28 May 2026; revised version, June 2026), pp. 9, 67, 95, 96; International Renewable Energy Agency, Transitioning away from fossil fuels (May 2026), pp. 26–27. Both were consulted for values cited in the IRENA tracking report.
International Energy Agency, Electricity 2026 (February 2026), pp. 10, 46, consulted for the value carried in Weekly Insight #17.
IRENA press releases "Global Goal of Tripling Renewables Needs USD 1.5 Trillion Investment Per Year" (11 October 2024) and "World Breaks Renewable Records but Must Move Faster to Hit 2030 Tripling Goal" (14 October 2025); IRENA article "Funding Grid and Storage Enhancement: The Call for Stronger Public-Private Collaboration" (8 January 2026).
This publication's Weekly Insights #9 (27 June 2026), #13 (30 July 2026), #17 (4 September 2026) and #19 (18 September 2026).
Quotations are limited to short excerpts with page references. Analysis by UzEnergyNews.
2025'te %23, 2035 için önerilen %35: COP31 öncesinde IEA elektrifikasyon ölçümleri, IRENA'nın üçe katlama ve verimlilik takibi, iki rapordaki şebeke yatırımı değerleri
Uluslararası Enerji Ajansı (IEA), elektriğin küresel nihai enerji tüketimindeki payını 2000'de %17, 2025'te %23 olarak ölçmektedir. IEA, 2035 için bu payı yürürlükteki politika ayarlarına dayanan senaryolarda yaklaşık %30, Yüksek Elektrifikasyon Senaryosu kapsamında %35 olarak vermektedir (IEA, Electrification – Special Report, 22.09.2026). Birleşmiş Milletler İklim Değişikliği Çerçeve Sözleşmesi 31. Taraflar Konferansı (COP31) Başkanlığı, 2035'e kadar %35'lik payı küresel hedef olarak önermektedir. Konferans 9-20 Kasım 2026 tarihlerinde Antalya'da toplanacaktır. Uluslararası Yenilenebilir Enerji Ajansı (IRENA), yıllık izleme raporunun üçüncü sayısını COP31 Başkanlığı ve Global Renewables Alliance ile birlikte 21.09.2026'da yayımlamıştır. Rapor, 2025 sonunda 5,15 teravat (TW) yenilenebilir kurulu güç ve aynı yıl içinde 693 gigavat (GW) ilave kaydetmektedir. 2030 ölçüt değeri 11,2 TW'tır; IRENA, bu değere ulaşmak için 2026-2030 döneminde gereken ilaveyi yılda yaklaşık 1,2 TW olarak hesaplamaktadır. Enerji yoğunluğu 2025'te %1,7 iyileşmiştir; IRENA, 2026-2030 dönemi için gereken hızı yılda %5,6 olarak hesaplamaktadır. Bu sayıda iki ölçüm serisi, her hedefin gerektirdiği hız ile kaydedilen hız ve iki rapordaki şebeke yatırımı değerleri kapsam ve fiyat bazıyla birlikte verilmektedir.
Yayın künyesi ve %35 önerisinin statüsü
IEA, Electrification – Special Report başlıklı raporu 22.09.2026'da yayımlamıştır. Rapor 198 sayfadır ve Creative Commons CC BY 4.0 lisansıyla yayımlanmıştır. Rapor, Türkiye ve Avustralya hükûmetlerinin talebiyle hazırlanmıştır. Türkiye, COP31 Başkanlığını, Avustralya ise COP31 Müzakere Başkanlığını üstlenecektir. Rapor, COP31 Başkanlığı ile IEA arasındaki stratejik ortaklık çerçevesinde hazırlanmıştır (IEA, s. 3, 15, 25). Raporun üç önsözü IEA İcra Direktörü, COP31 Dönem Başkanı adayı ve COP31 Müzakere Başkanı tarafından imzalanmıştır. IEA raporuna yapılan sayfa atıfları aşağıda "IEA, s." biçiminde verilmektedir.
IRENA, yıllık izleme serisinin üçüncü sayısı olan Delivering on the UAE Consensus: Tracking progress toward tripling renewable energy capacity and doubling energy efficiency by 2030 başlıklı raporu (ISBN 978-92-9260-750-0) COP31 Başkanlığı ve Global Renewables Alliance (GRA) ile birlikte yayımlamıştır. IRENA, 2024 başında Birleşik Arap Emirlikleri Mutabakatı (UAE Consensus) hedeflerinden ikisinin izlenmesinden sorumlu kuruluş olarak belirlenmiştir (IRENA, s. 2). IRENA, raporun yayımlandığını 21.09.2026'da resmî X hesabından duyurmuştur; IRENA'nın lansman basın bülteni yayını Climate Week NYC dönemine yerleştirmektedir. IRENA raporuna yapılan sayfa atıfları aşağıda "IRENA, s." biçiminde verilmektedir. COP31, 9-20 Kasım 2026 tarihlerinde Antalya'da toplanacaktır (IRENA, s. 3).
IRENA'nın izlediği iki hedef, Birinci Küresel Durum Değerlendirmesi sonuç metninin 28. paragrafından gelmektedir. Metin, 2023'te Dubai'de toplanan 28. Taraflar Konferansında (COP28) 198 Tarafça kabul edilmiştir. Paragraf, Tarafları "(a) Tripling renewable energy capacity globally and doubling the global average annual rate of energy efficiency improvements by 2030" (2030'a kadar küresel yenilenebilir enerji kapasitesinin üç katına, enerji verimliliği iyileşmesinin küresel ortalama yıllık hızının iki katına çıkarılması) hedefine katkıya çağırmaktadır (IRENA, s. 2).
%35'lik elektrifikasyon değeri iki raporda da COP31 Başkanlığının önerisi olarak yer almaktadır:
IRENA raporu (s. 9). COP31 Dönem Başkanı adayı, Başkanlığın küresel elektrifikasyon hedefini "to increase the share of electricity in global final energy consumption to 35% by 2035" (2035'e kadar elektriğin küresel nihai enerji tüketimindeki payını %35'e çıkarmak) biçiminde ilerleteceğini yazmaktadır. Önsöz, "a global invitation for all actors to align behind this target" (tüm aktörlere bu hedefin arkasında birleşmeleri için küresel bir davet) ifadesiyle çağrıda bulunmaktadır.
IEA raporu (s. 5). COP31 Dönem Başkanı adayı "35-by-35 target" (2035'e kadar %35 hedefi) ifadesini kullanmakta ve "Antalya will be the moment we commit to it together" (Antalya, bu hedefe birlikte bağlanacağımız an olacaktır) diye yazmaktadır.
IRENA raporu (s. 11). Avustralya İklim Değişikliği ve Enerji Bakanı, COP31 Müzakere Başkanı sıfatıyla, Avustralya'nın Türkiye ile birlikte "to make COP31 an 'Electrification COP'" (COP31'i bir "Elektrifikasyon COP'u" yapmak) amacıyla çalıştığını yazmaktadır.
IEA raporu %35 düzeyini "goal, currently under international discussion" (uluslararası düzeyde görüşülmekte olan hedef) olarak nitelemektedir (IEA, s. 16). İki rapor da %35 değerini Taraflar Konferansının kabul edilmiş bir kararı olarak kaydetmemektedir.
09.06.2026 itibarıyla 120 üçüncü nesil ulusal katkı beyanı (NDC 3.0) Birleşmiş Milletler İklim Değişikliği Çerçeve Sözleşmesine sunulmuştur (NDC Registry verisi, IRENA, s. 55'teki aktarım). Bu beyanlar küresel emisyonların %77'sini kapsamaktadır. Beyanların %67'si sayısal bir yenilenebilir enerji hedefi, %43'ü sayısal bir enerji verimliliği hedefi içermektedir (IRENA, s. 55).
IEA ölçüsü: elektriğin nihai enerji tüketimindeki payı, 2000-2035
IEA, elektrifikasyon oranını elektriğin toplam nihai enerji tüketimindeki payı olarak tanımlamaktadır (IEA, s. 28-31, 186-187):
Kimyasal hammadde gibi enerji dışı kullanımlar paydadan çıkarılmaktadır.
Geleneksel biyokütle paydaya dâhildir; IEA, bunun elektrifikasyon oranını düşürdüğünü belirtmektedir (IEA, s. 31).
Uluslararası deniz ve hava yakıtları dünya toplamında ulaştırma kalemine dâhildir.
Payda, Birleşmiş Milletler Sürdürülebilir Kalkınma Amacı göstergesi 7.2.1'in paydasıdır (IEA, s. 187).
Bu ölçüye göre elektrik, küresel nihai enerji tüketiminin 2000'de %17'sini, 2025'te %23'ünü oluşturmaktadır (IEA, s. 16, 31). Rapor metnindeki bu iki yuvarlanmış değere göre 2000-2025 döneminde ortalama artış yılda 0,24 puandır (hesap). IEA Şekil 1.5'ten okunan değerler payı 2000'de yaklaşık %16,7, 2008'de %18,3, 2018'de %20,8, 2020'de %21,9, 2025'te %23,4 olarak göstermektedir (IEA, s. 31). 2000 ve 2025 okumalarına göre ortalama artış yılda yaklaşık 0,27 puandır (hesap).
IEA raporu 2035 için üç değer vermektedir:
Yürürlükteki politika ayarlarında yaklaşık %30. Yürürlükteki politika ayarlarına dayanan senaryolarda ("today's policy settings") pay yaklaşık %30 ("around 30%") düzeyine ulaşmaktadır (IEA, s. 20). 48. sayfada aynı değer "slightly less than 30%" (%30'un biraz altında) olarak geçmektedir. Bu, 2025-2035 döneminde yılda yaklaşık 0,7 puana karşılık gelmektedir (hesap).
Yüksek Elektrifikasyon Senaryosu kapsamında %35 (IEA, s. 15, 46). Bu, 2025-2035 döneminde yılda ortalama 1,2 puan ve 2000-2025 dönemindeki yılda 0,24 puanlık ortalamanın 5 katıdır; iki hız da rapor metnindeki %17, %23 ve %35 yuvarlanmış değerlerinden hesaplanmıştır (hesap). Senaryo, IEA'nın 2050 Net Sıfır Emisyon Senaryosundan türetilmiştir (IEA, s. 16).
Maliyet-etkin elektrifikasyonun tamamında %33. Bu değer, 2025 teknoloji maliyetleri, enerji fiyatları ve finansman koşullarında tüketici açısından maliyet-etkin olan elektrifikasyonun tamamı gerçekleştiğinde oluşan paydır. Hesap sistem maliyetlerini içermemektedir (IEA, s. 51).
IEA raporu %33 değerini 15. ve 53. sayfalarda yıl belirtmeden ("today"), 51. sayfada 2035 için ("in 2035") vermektedir. Bu sayıda değer, 51. sayfadaki 2025 koşulları dayanağıyla verilmektedir. IEA, senaryolarının tahmin olmadığını ve tümünün aynı nüfus ve ekonomik büyüme varsayımlarını kullandığını belirtmektedir (IEA, s. 45).
Sektör bazında elektrik, 2025'te binalarda nihai enerji kullanımının yaklaşık %40'ını, sanayide %28'ini, ulaştırmada yaklaşık %2'sini karşılamaktadır (IEA, s. 30, 31, 88). Yüksek Elektrifikasyon Senaryosu kapsamında 2035 payları binalarda yaklaşık %56, sanayide yaklaşık %39'dur; bu iki değer, Açıklanan Politikalar Senaryosu (STEPS) ile Yüksek Elektrifikasyon Senaryosunu karşılaştıran IEA Şekil 2.1'den (s. 49) okunmuştur. Ulaştırmada 2035 payı %13'tür (IEA, s. 49).
Küresel elektrik talebi 2025'te 28.500 teravat saati (TWh) aşmıştır (IEA, s. 27). 30.07.2026 tarihli Weekly Insight #13, başlangıç düzeyi olarak 28.600 TWh değerini vermiştir; bu değer IEA'nın 23.07.2026 tarihli Electricity Mid-Year Update raporundan alınmıştır. Yıllık talep artışı 2015-2025 döneminde ortalama 750 TWh'tir. IEA bu artışı Açıklanan Politikalar Senaryosunda yılda yaklaşık 925 TWh, Yüksek Elektrifikasyon Senaryosu kapsamında yılda yaklaşık 1.400 TWh olarak vermektedir (IEA, s. 51).
IRENA raporunda elektrifikasyon payı ve enerji verimliliği hedefi
IRENA, elektrifikasyonu enerji verimliliği hedefinin bir bileşeni olarak ölçmektedir. IRENA, UAE Consensus hedefine ulaşmak için elektriğin toplam nihai enerji tüketimindeki payının 2023'teki %23'ten 2030'a kadar yaklaşık %30'a yükselmesi gerektiğini belirtmektedir (IRENA, s. 39). 40. sayfa, 2035'e kadar %35'e ulaşmak için ek hızlanma gerektiğini belirtmekte ve bu değer için IRENA'nın Mayıs 2026 tarihli Transitioning away from fossil fuels raporuna atıf yapmaktadır (IRENA, s. 40). IRENA'nın 2023 ve 2030 sektör payları şöyledir (IRENA, s. 39):
binalar: %36 ve %53;
sanayi: %27 ve %31;
ulaştırma: %1 ve %7.
IRENA Şekil 7, toplam elektrifikasyon oranını 2022 ve 2023'te %23, 2024'te %24 olarak, 2025 için "N/A" (değer yok) olarak vermektedir; şeklin 3 numaralı notu son yıl değerlerinin IEA World Energy Statistics and Balances verisinden hesaplandığını belirtmektedir (IRENA, s. 40). 2024 için IEA Şekil 1.5 okuması yaklaşık %23,0'dır (IEA, s. 31). İki rapor da yaklaşık 1 puanlık farkı açıklamamaktadır. IRENA'nın sektör değerleri 2023, IEA'nınkiler 2025 yılına aittir; IRENA 39. sayfada sektör değerleri için kaynak belirtmemektedir. İki sektör değer kümesi farklı baz yıllarına dayandığından bu sayıda ayrı verilmekte, satır satır karşılaştırılmamaktadır.
IRENA, enerji yoğunluğunu toplam birincil enerji arzının gayrisafi yurt içi hasılaya bölümü olarak ölçmektedir; hasıla 2025 satın alma gücü paritesiyle hesaplanmaktadır (IRENA, s. 38). Enerji yoğunluğu 2025'te %1,7 iyileşmiştir (IRENA, s. 16, 38). IRENA Şekil 6, iyileşme oranını 2022 için %2,0, 2023 ve 2024 için ayrı ayrı %1,1 olarak vermektedir (IRENA, s. 38). IRENA, enerji verimliliğini 2022 düzeyine göre ikiye katlama hedefini 2023-2030 döneminde yılda %4 iyileşme olarak ifade etmektedir. 2023-2025 döneminde kaydedilen hızlardan sonra 2026-2030 için gereken ortalama yılda %5,6'dır (IRENA, s. 7, 38); bu, 2025 hızının 3,3 katıdır (hesap). IRENA'nın güncellenmiş Planlanan Enerji Senaryosu 2026-2030 için yılda yaklaşık %3 vermektedir (IRENA, s. 38). IRENA Genel Direktörünün önsözü, UAE Consensus hedeflerinin dünyayı 1,5°C ile uyumlu patikada tutmaya artık yetmeyebileceğini belirtmektedir: "the UAE Consensus goals may no longer be sufficient to keep the world on 1.5°C-compatible pathway" (IRENA, s. 7).
Yenilenebilir kurulu güç: 2025 sonunda 5,15 TW, 2030 için 11,2 TW ölçüt değeri
Yenilenebilir enerji kurulu gücü 2025 sonunda 5,15 teravata (TW), yani 5.155 gigavata (GW) ulaşmıştır; 1 TW 1.000 GW'a eşittir (IRENA, s. 23, 27). 2025'teki ilave 693 GW'tır. Büyüme hızı %15,5'in biraz üzerindedir; 2024'te bu hız %15,1'dir (IRENA, s. 23). Aynı rapordaki GRA önsözü 2025 ilavesini 692 GW olarak vermektedir (IRENA, s. 13); burada ana metindeki 693 GW kullanılmaktadır.
2025 ilavesinin teknolojiye göre dağılımı şöyledir (IRENA, s. 25-26):
güneş fotovoltaik: 513 GW, toplamın yaklaşık dörtte üçü;
rüzgâr: 158 GW, bunun 150 GW'ı karada;
pompalı depolama hariç hidroelektrik: 18,3 GW;
biyoenerji, jeotermal, yoğunlaştırılmış güneş enerjisi ve deniz enerjisi birlikte: yaklaşık 4 GW, bunun %72'si biyoenerji.
Değişken yenilenebilir kaynaklar 2025'teki net yenilenebilir ilavenin %96,9'unu oluşturmaktadır (IRENA, s. 25).
2030 ölçüt değeri 11.174 GW'tır ve 11,2 TW'a yuvarlanmaktadır. IRENA bu değeri World Energy Transitions Outlook raporundaki analizden türetmiştir; bu analiz COP28 hedefinin istatistiksel dayanağını oluşturmaktadır. IRENA değeri seri boyunca süreklilik için korumaktadır (IRENA, s. 25).
IRENA, ölçüt değere ulaşmak için 2026-2030 döneminde gereken ilaveyi 6,02 TW olarak hesaplamaktadır. Bu, yılda ortalama yaklaşık 1,2 TW ve %16,7 bileşik yıllık büyüme demektir; 2025 sayısında bu oran %16,6'dır (IRENA, s. 23). Raporun temel bulgular sayfası ve IRENA Şekil 2 yıllık ortalamayı 1.204 GW olarak vermektedir (IRENA, s. 16, 27). Gereken yıllık ortalama, 2025 ilavesinin 1,74 katıdır (hesap).
2025'teki %15,5 büyüme hızı sürdürülürse kurulu güç 2030 sonunda 10,6 TW'a ulaşmakta ve yaklaşık 0,6 TW açık kalmaktadır (IRENA, s. 23). IRENA bu açığı Kuzey Amerika'nın 2025 sonundaki 612 GW yenilenebilir kurulu gücüyle karşılaştırmaktadır (IRENA, s. 24). Seride belirtilen açık şöyledir:
2024 sayısında 1,49 TW (IRENA, s. 13'teki aktarım);
2025 sayısında 0,9 TW (IRENA, s. 23'teki aktarım);
2026 sayısında 0,6 TW (IRENA, s. 23).
Teknoloji bazında 2026-2030 döneminde gereken ortalama yıllık ilave güneş fotovoltaikte 614 GW'tır (IRENA Şekil 2 etiketi, s. 27). Rüzgârda bu değer 449 GW, hidroelektrikte 34 GW'tır (IRENA, s. 26). Ölçüt değere ulaşıldığında değişken yenilenebilir kaynaklar 2030'da toplam kurulu gücün yaklaşık %62'sini (yaklaşık %42 güneş, %20 rüzgâr) oluşturmaktadır; 2025'te bu pay yaklaşık %35'tir (IRENA, s. 23).
Teknolojiye göre yenilenebilir kurulu güç (GW)
Teknoloji
2024 sonu
2025 sonu
2030 ölçüt değeri
Güneş fotovoltaik
1.876
2.388
5.457
Kara rüzgârı
1.050
1.200
3.040
Deniz rüzgârı
83
91
494
Hidroelektrik (pompalı depolama hariç)
1.278
1.296
1.465
Biyoenerji
153
155
343
Yoğunlaştırılmış güneş enerjisi
7
8
197
Jeotermal
15
16
105
Deniz enerjisi
0,5
0,5
72
Toplam
4.462
5.155
11.174
Kaynak: IRENA, Şekil 3, s. 28. Güneş fotovoltaik, hidroelektrik, biyoenerji, jeotermal ve yoğunlaştırılmış güneş enerjisinin 2025 değerleri ile 1.291 GW'lık 2025 rüzgâr toplamı 25-26. sayfalardaki metinde de yer almaktadır. Kaynaktaki yuvarlama nedeniyle satırların toplamı toplam satırıyla tam örtüşmemektedir.
IRENA, Çin'de işletmeye alma işlemlerinin Haziran 2025'te yürürlüğe giren fiyatlama reformu öncesine çekildiğini kaydetmektedir. Yalnız Mayıs 2025'te yaklaşık 93 GW güneş kurulmuştur (IRENA, s. 57). Bu taban karşısında Çin'in güneş ilavesi 2026'nın ilk yarısında yıllık bazda %66, rüzgâr ilavesi yaklaşık %25 düşmüştür (Reuters haberi, IRENA, s. 57'deki aktarım). IRENA Genel Direktörünün önsözü "indications of a potential slowdown in capacity expansion" (kapasite artışında olası bir yavaşlamaya ilişkin işaretler) ifadesini içermektedir (IRENA, s. 7). 01.10.2026 itibarıyla 2026 tam yıl kurulu güç istatistikleri yayımlanmamıştır.
2025'te işletmeye alınan şebeke ölçeğindeki yenilenebilir kapasitenin %90'ı, yeni kurulan en ucuz fosil yakıtlı seçenekten daha düşük maliyetle elektrik üretmiştir. Küresel ağırlıklı ortalama seviyelendirilmiş elektrik maliyeti megavat saat başına kara rüzgârında 33 dolar, güneş fotovoltaikte 44 dolar, deniz rüzgârında 78 dolardır. Çin hariç tutulduğunda güneş fotovoltaik ve kara rüzgârı değerleri megavat saat başına 55 ve 51 dolardır (IRENA, s. 32). Batarya depolama ilavesi 2025'te 112 GW ve 307 gigavat saate (GWh) ulaşmış, güç bazında 2024'e göre %48 artmıştır (BloombergNEF verisi, IRENA, s. 46'daki aktarım).
İki rapordaki yatırım değerleri: kapsam, yıl ve fiyat bazı
Bu bölümün metnindeki tutarlar, aksi belirtilmedikçe Amerika Birleşik Devletleri doları cinsinden ve 2025 fiyatlarıyladır; 1 trilyon 1.000 milyara eşittir. Önceki sayılarda yer alan değerler tablosu, her satırın fiyat bazını ayrı bir sütunda vermektedir.
Yenilenebilir enerji ve enerji verimliliği. Yenilenebilir enerji üretim kapasitesine yatırım 2025'te 625 milyar dolar, 2024'te 641 milyar dolardır. 2025 tutarının 417 milyar doları güneş fotovoltaik, 155 milyar doları rüzgâr, 37 milyar doları hidroelektrik, 12 milyar doları biyoenerjidir (IRENA, s. 45, 47). IRENA bu yatırımı, yıllık kapasite ilavesinin her teknolojinin küresel ağırlıklı ortalama kurulum maliyetiyle çarpımı olarak hesaplamaktadır (IRENA, s. 45).
IRENA, 2026-2030 dönemi yenilenebilir enerji ihtiyacını 8,6 trilyon dolar, yılda ortalama yaklaşık 1,7 trilyon dolar (1.725 milyar) olarak vermektedir (IRENA, s. 45, 47). IRENA, teknoloji bazında yıllık yatırımın rüzgârda 2025 düzeyinin 5, hidroelektrikte 4 katına, biyoenerjide 10 katına çıkması gerektiğini belirtmektedir (IRENA, s. 45). Enerji verimliliği ve enerji tasarrufu yatırımı 2025'te 369 milyar dolardır (IRENA, s. 46-47; aynı raporun 16. sayfası 362 milyar dolar vermektedir). 2026-2030 dönemi için hesaplanan ihtiyaç yılda 3,2 trilyon (3.182 milyar) dolardır (IRENA, s. 46-47).
IRENA, yenilenebilir enerji, enerji verimliliği ile şebeke ve esneklik kalemlerinin toplamını 2025 için 1.518 milyar dolar, ihtiyacı yılda 5.782-5.889 milyar dolar olarak kaydetmektedir (IRENA, s. 47); kaynakta gösterilen bileşen değerleri yuvarlama nedeniyle bu toplamlardan 1 milyar dolar farklıdır (hesap). Toplam enerji yatırımı 2025'te 3,3 trilyon dolardır (IRENA, s. 46; IEA World Energy Investment 2026 aktarımı). IEA raporunda elektrik arzı ve şebekelere yatırımın 2026'da 1,6 trilyon dolara, son kullanım elektrifikasyonu dâhil 2 trilyon dolara ulaşması öngörülmektedir. Bu, 2026'daki küresel toplam enerji yatırımının yaklaşık %60'ıdır (IEA, s. 34).
IEA raporunda şebekeler. İletim ve dağıtım şebekelerine yatırım 2015'te yaklaşık 315 milyar dolar (IEA, s. 34; sayfa bu değer için fiyat bazı belirtmemektedir), 2020'de yaklaşık 295 milyar dolar, 2025'te 450 milyar dolardır. Bu yatırım, Net Sıfır Emisyon üretim karmasıyla Yüksek Elektrifikasyon Senaryosu kapsamında 2035'te yaklaşık 930 milyar dolara ulaşmaktadır (IEA, s. 145). 2035 değeri 2025 düzeyinin 2,07 katıdır ve 2025-2035 döneminde yılda yaklaşık %7,5 artışa karşılık gelmektedir (hesap). IEA'ya göre şebeke yatırımının yaklaşık üçte ikisi dağıtım şebekelerine yapılmaktadır (IEA, s. 59). IEA, küresel şebeke uzunluğunu yıl belirtmeden 85 milyon kilometrenin üzerinde, bunun yaklaşık 80 milyon kilometresini dağıtım şebekesi olarak vermektedir (IEA, s. 115). Aynı senaryoda şebeke uzunluğu 2035'te yaklaşık 115 milyon kilometreye ulaşmaktadır (IEA, s. 115-116).
IRENA raporunda şebeke ve esneklik. IRENA, 2025'te şebeke ve esneklik yatırımını 525 milyar dolar olarak kaydetmektedir (IRENA, s. 46). Bu toplam iki bileşenden oluşmaktadır; IRENA raporu ikisi için de IEA World Energy Investment 2026 raporuna atıf yapmaktadır:
422 milyar dolarlık şebeke altyapısı yatırımı; 2024'e göre %12 artmıştır (IRENA, s. 46; World Energy Investment 2026 aktarımı);
pompalı hidroelektrik dâhil 103 milyar dolarlık enerji depolama yatırımı; 2024'e göre %33 artmıştır (IRENA, s. 46; World Energy Investment 2026 aktarımı).
IRENA Şekil 8 etiketleri şebeke ve esneklik toplamını 2023 için 390 milyar dolar, 2024 için 455 milyar dolar olarak vermektedir; şeklin 2 numaralı notu son yıl değerlerinin IRENA, BloombergNEF ve IEA verilerinden derlendiğini belirtmektedir (IRENA, s. 47).
IRENA, 2026-2030 dönemi için yılda ortalama en çok 1 trilyon dolarlık ("up to USD 1 trillion") bir ihtiyaç vermektedir. Bunun yaklaşık 800 milyar doları şebeke, 200 milyar dolara kadar olan kısmı depolamadır (IRENA, s. 46). IRENA Şekil 8 bu aralığı yılda 874-981 milyar dolar olarak vermektedir (IRENA, s. 47). Bu aralık, 2025'teki 525 milyar dolarlık değerin 1,66-1,87 katıdır (hesap). IRENA raporu ayrıca IRENA'nın revize 1,5°C Senaryosu için 2030'a kadar yılda yaklaşık 902 milyar dolarlık şebeke yatırımı vermekte ve bu değer için IRENA'nın Mayıs 2026 tarihli Transitioning away from fossil fuels raporuna atıf yapmaktadır (IRENA, s. 64; sayfa bu değer için fiyat bazı belirtmemektedir). Bu değerin kaynağı aşağıdaki izleme noktalarında kaydedilmiştir.
Bu sayıda kullanılan 2025 değeri. IRENA raporu 2025 şebeke yatırımı için iki değer taşımaktadır:
şebeke altyapısı için 422 milyar dolar (IRENA, s. 46; World Energy Investment 2026 aktarımı);
iletim ve dağıtım için yaklaşık 450 milyar dolar (IRENA, s. 64; BloombergNEF ve IEA aktarımı).
IEA Electrification raporu 450 milyar dolar vermektedir (IEA, s. 145). IEA'nın World Energy Investment 2026 raporu, şebeke harcamasının 2025'te 45 milyar dolar artarak yaklaşık 450 milyar dolara ("nearly USD 450 billion") ulaştığını 2025 fiyatlarıyla kaydetmektedir (World Energy Investment 2026, s. 96). Bu sayıda IEA raporunda, IRENA raporunun 64. sayfasında ve World Energy Investment 2026'da yer alan 450 milyar dolarlık değer kullanılmaktadır. 422 milyar dolar ise IRENA'nın 525 milyar dolarlık şebeke ve esneklik toplamının şebeke bileşeni olarak verilmektedir. Batarya depolama yatırımı IEA raporunda 80 milyar dolardır (IEA, s. 145). IRENA raporunda pompalı hidroelektriği de kapsayan depolama yatırımı 103 milyar dolardır (IRENA, s. 46). İki değerin belirtilen kapsamları farklıdır; 103 milyar dolarlık değerin kaynağı aşağıdaki izleme noktalarında kaydedilmiştir.
Bu yayının önceki sayılarında yer alan değerler. Weekly Insight #9 ve #17, önceki yayınlardan şebeke değerleri vermiştir. Aşağıdaki her satır ayrı bir yayın, yıl, kapsam veya senaryodan gelen ayrı bir ölçümdür.
Yayın ve tarih (belirtildiyse)
Yıl veya dönem
Kapsam
Değer (milyar dolar)
Fiyat bazı
Yer aldığı sayı
IEA, World Energy Investment 2025
2024-2025
küresel şebeke yatırımı
yaklaşık 400
yayının kendi bazı; çevrilmedi
Weekly Insight #9 (27.06.2026)
IEA (#9'daki aktarım; yayın adı #9'da belirtilmemiştir)
yaklaşık 600 (hesap: yaklaşık 400'ün kabaca %50 üzeri; Electricity 2026, s. 10, 46)
yayının kendi bazı; çevrilmedi
#17
IEA, World Energy Investment 2026 (Mayıs 2026)
2026
küresel şebeke yatırımı (iletim ve dağıtım)
yaklaşık 550
2025 doları, piyasa kuru
#17
IRENA, "Funding Grid and Storage Enhancement: The Call for Stronger Public-Private Collaboration" (08.01.2026)
2030'a kadar yıllık, IRENA 1,5°C Senaryosu
şebeke yatırımı ihtiyacı
671
yayının kendi bazı; çevrilmedi
#17
IEA, Electrification (22.09.2026)
2025
küresel şebeke yatırımı (iletim ve dağıtım)
450
2025 doları, piyasa kuru
bu sayı
IEA, Electrification (22.09.2026)
2035, Yüksek Elektrifikasyon Senaryosu, Net Sıfır Emisyon üretim karması
küresel şebeke yatırımı (iletim ve dağıtım)
yaklaşık 930
2025 doları, piyasa kuru
bu sayı
IRENA izleme raporu (2026 sayısı)
2025
şebeke ve esneklik, depolama dâhil
525 (422 şebeke, 103 depolama)
2025 doları
bu sayı
IRENA izleme raporu (2026 sayısı)
2026-2030 yıllık ortalama, üçe katlama hesabı
şebeke ve esneklik, depolama dâhil
874-981 (s. 47); s. 46 en çok 1.000 vermektedir, bunun yaklaşık 800'ü şebeke, 200'e kadar olan kısmı depolamadır
2025 doları
bu sayı
IRENA izleme raporu (2026 sayısı), s. 64; IRENA Transitioning away from fossil fuels (Mayıs 2026) atfıyla
2030'a kadar yıllık, revize 1,5°C Senaryosu
şebeke
yaklaşık 902
s. 64'te belirtilmemiştir; çevrilmedi
bu sayı
Kaynaklar: IEA, Electrification, s. 145-146; IRENA izleme raporu, s. 46-47, 64; IEA, World Energy Investment 2026, s. 9, 95; IEA, Electricity 2026, s. 10, 46; IRENA'nın 08.01.2026 tarihli makalesi; önceki değerler Weekly Insight #9 ve #17'de yer aldığı biçimiyle. "2025 doları, piyasa kuru" IEA grafiklerinde belirtilen birimdir (World Energy Investment 2026, s. 95; Electrification, s. 146); "2025 doları" IRENA Şekil 8'in 1 numaralı notunda belirtilmektedir (s. 47). "Yayının kendi bazı; çevrilmedi" ifadesi fiyat bazı teyit edilmeyen satırları göstermektedir; bu değerler 2025 fiyatlarına çevrilmemiştir.
Bağlantı kuyrukları, kısıntı ve negatif fiyatlı saatler
İleri aşamadaki yaklaşık 2.500 GW yenilenebilir enerji, depolama ve büyük yük projesi şebeke bağlantı kuyruklarında beklemektedir (IRENA, s. 64; IEA Electricity 2026 aktarımı). 04.09.2026 tarihli Weekly Insight #17 aynı IEA kaynağından 2.500 GW'ın üzerinde bir değer vermiştir. 27.06.2026 tarihli Weekly Insight #9 ise yalnız ileri aşamadaki yenilenebilir projeler için yaklaşık 1.500 GW değerini vermiştir; iki değer farklı proje kümelerini kapsamaktadır.
IEA Electrification raporu, iki önlem grubunun sağlayabileceği ek bağlantı kapasitesini IEA Electricity 2026 raporuna atıfla şöyle vermektedir (IEA, s. 119):
IRENA raporu, iki önlem grubunun birlikte ileri aşamadaki 1.200-1.600 GW projenin bağlanmasına yetecek kapasite açabileceğini belirtmektedir (IRENA, s. 65; IEA Electricity 2026 aktarımı).
Kısıntı ve fiyat okumaları şöyledir:
Almanya, Fransa ve Hollanda 2025'te birlikte 3,9 TWh yenilenebilir üretimi kısmıştır; bu değer 2024'ün %21 üzerindedir (Montel Analytics verisi, IRENA, s. 63'teki aktarım).
Çin: ulusal ortalama kısıntı oranı 2025'te rüzgârda %5,7, güneşte %5,2'dir; 2023'te bu oranlar %2,7 ve %2,0'dır (Çin Ulusal Enerji İdaresi verisi, IRENA, s. 63'teki aktarım).
Almanya: negatif toptan fiyatlı saat sayısı 2023'te 301, 2024'te 457, 2025'te 573'tür (Almanya Federal Şebeke Ajansı [Bundesnetzagentur] verisi, IRENA, s. 66'daki aktarım).
60'tan fazla piyasa: ortalama negatif fiyatlı saat sayısı 2019'da 110'dan 2025'te 450'nin üzerine çıkmıştır (IEA, s. 58).
IRENA'nın revize 1,5°C Senaryosu kapsamında elektrik sisteminin esneklik ihtiyacı 2023-2030 döneminde günlük dengelemede 2,8, haftalıkta 2,6, aylıkta 2,3 kat artmaktadır (IRENA, s. 65).
Petrol ikamesi, ithalat faturası ve emisyonlar: IEA ve IRENA değerleri
IEA'nın 22.09.2026 tarihli basın bülteninin başlığı "Electrification takes centre stage as Hormuz shock spurs countries to seek to enhance energy security" (Hürmüz şoku ülkeleri enerji güvenliğini artırmaya yöneltirken elektrifikasyon ön plana çıkıyor) şeklindedir. IEA raporu, Şubat 2026'dan bu yana elektrifikasyonla ilgili yeni politika açıklayan 25 ülke saymaktadır (IEA, s. 15). Aynı raporun 36. sayfası bu sayımın başlangıcını Mart olarak vermektedir.
IEA, elektrikli otomobil, motosiklet, kamyon ve otobüslerin ikame ettiği petrol talebini yıl belirtmeden günde yaklaşık 2,3 milyon varil olarak vermektedir (IEA, s. 17, 34). IEA, elektrikli taşıtların 2035'teki ikamesini yürürlükteki politika ayarlarında ("today's policy settings") günde yaklaşık 10 milyon varil, Yüksek Elektrifikasyon Senaryosu kapsamında günde 18 milyon varil olarak vermektedir (IEA, s. 17).
Yüksek Elektrifikasyon Senaryosu kapsamında enerji ithalatçısı ülkelerin ithalat faturası 2035'te 2025'e göre yaklaşık dörtte bir düşmektedir. Bu azalış yılda yaklaşık 400 milyar dolardır; 2026'daki daha yüksek enerji fiyatlarıyla değerlendirildiğinde 500 milyar doların üzerine çıkmaktadır (IEA, s. 17). Son kullanım emisyonları aynı senaryoda 2035'e kadar yaklaşık %40 azalmaktadır. Azalışın yaklaşık 5 gigaton (Gt) karbondioksiti elektrifikasyondan, yaklaşık 3 Gt'u diğer önlemlerden gelmektedir (IEA, s. 18, 156).
IRENA raporuna göre yenilenebilir enerji 2025'te 480 milyar dolarlık fosil yakıt maliyetini ve 8,4 Gt karbondioksit emisyonunu önlemiştir (IRENA, s. 34). GRA önsözü, Hürmüz Boğazı'ndaki askerî çatışmanın petrol ve gaz arzında yol açtığı kısıta atıf yapmaktadır (IRENA, s. 13). 18.09.2026 tarihli Weekly Insight #19, Hürmüz Boğazı'ndan sıvılaştırılmış doğal gaz geçişlerini ve Avrupa Birliği depolama düzeylerini kaydetmiştir.
Yedi göstergede kaydedilen ve gereken değerler
Gösterge
Kaydedilen
Gereken veya senaryo değeri
Oran (hesap)
Kaynak
Elektriğin nihai enerji tüketimindeki payı, yıllık değişim
2000-2025'te yılda 0,24 puan (hesap)
%35'e ulaşmak için 2025-2035'te yılda 1,2 puan (hesap)
5,0
IEA, s. 15, 16, 31, 46
Yenilenebilir kapasite ilavesi
2025'te 693 GW
2026-2030'da yılda ortalama 1.204 GW
1,74
IRENA, s. 16, 23, 27
Enerji yoğunluğu iyileşmesi
2025'te %1,7
2026-2030'da yılda %5,6
3,3
IRENA, s. 16, 38
İletim ve dağıtım yatırımı
2025'te 450 milyar dolar
2035'te yaklaşık 930 milyar dolar (Yüksek Elektrifikasyon Senaryosu, Net Sıfır Emisyon üretim karması)
2,07
IEA, s. 145
Şebeke ve esneklik yatırımı
2025'te 525 milyar dolar
2026-2030'da yılda ortalama 874-981 milyar dolar
1,66-1,87
IRENA, s. 46-47
Yenilenebilir enerji yatırımı
2025'te 625 milyar dolar
2026-2030'da yılda ortalama 1.725 milyar dolar
2,76
IRENA, s. 45, 47
Enerji verimliliği ve tasarrufu yatırımı
2025'te 369 milyar dolar
2026-2030'da yılda ortalama 3.182 milyar dolar
8,6
IRENA, s. 46-47
Yatırım değerleri 2025 fiyatlarıyla dolar cinsindendir. Oranlar, gösterilen rapor değerlerinden bu sayıda hesaplanmıştır. İlk satırdaki yıllık puan değerleri IEA rapor metnindeki %17, %23 ve %35 yuvarlanmış değerlerinden hesaplanmıştır; 2000 ve 2025 için IEA Şekil 1.5 okumalarıyla (yaklaşık %16,7 ve %23,4) iki hız yılda yaklaşık 0,27 ve 1,16 puan, oran yaklaşık 4,3 olmaktadır (hesap).
İzleme noktaları: ölçülemeyen veya uzlaştırılamayan kalemler
Kalem
Durum
%35 hedefinin statüsü
İki raporda da COP31 Başkanlığının önerisi ve çağrısı olarak yer almaktadır; IEA raporu bu düzeyi "goal, currently under international discussion" (uluslararası düzeyde görüşülmekte olan hedef) olarak nitelemektedir (s. 16). İki rapor da Taraflar Konferansının kabul edilmiş bir kararını kaydetmemektedir; kabul konusu 9-20 Kasım 2026 tarihli COP31'e aittir (IRENA, s. 3).
2024 elektrifikasyon oranı: yaklaşık %23,0 veya %24
2024 için IEA Şekil 1.5 okuması yaklaşık %23,0'dır (IEA, s. 31). IRENA Şekil 7, IEA World Energy Statistics and Balances verisinden hesaplanan %24 değerini vermektedir (IRENA, s. 40, 3 numaralı not). İki rapor da farkı açıklamamaktadır. 2025 için IEA Şekil 1.5 okuması yaklaşık %23,4, rapor metnindeki değer %23'tür (IEA, s. 16, 31). Bu sayıdaki iki değer kümesinin farklı baz yıllarına dayandığı ifadesi yalnız sektör değerleri için geçerlidir.
2025 şebeke yatırımı: 422 veya 450 milyar dolar
IRENA raporu şebeke altyapısı için World Energy Investment 2026 atfıyla 422 milyar dolar (s. 46), iletim ve dağıtım için yaklaşık 450 milyar dolar (s. 64) vermektedir; IEA Electrification raporu 450 milyar dolar vermektedir (s. 145). World Energy Investment 2026, 2025 için "nearly USD 450 billion" (yaklaşık 450 milyar dolar) ve 2026'da ayrıca %17 artış (s. 96), 2026 için "around USD 550 billion in 2026, up nearly 20%" (2026'da yaklaşık 550 milyar dolar, yaklaşık %20 artış; s. 9) vermektedir; değerleri piyasa kurlarıyla 2025 dolarıdır. %17 oranı 450 milyar dolara uygulandığında 2026 için yaklaşık 527 milyar dolar elde edilmektedir (hesap). 422 milyar dolarlık değer World Energy Investment 2026 metninde bulunamamıştır.
2025 depolama yatırımı: 103 milyar dolar
IRENA raporu pompalı hidroelektrik dâhil enerji depolaması için 103 milyar dolar vermekte ve World Energy Investment 2026'ya atıf yapmaktadır (s. 46). Değer World Energy Investment 2026 metninde bulunamamıştır; bu yayın pompalı hidroelektrik depolamayı batarya depolama kalemi altında değil, yenilenebilir enerji kalemi altında saymaktadır (World Energy Investment 2026, s. 67). IEA Electrification raporu 2025 batarya depolama yatırımını 80 milyar dolar olarak vermektedir (s. 145). 525 milyar dolarlık toplamın 422 ve 103 milyar dolarlık bileşenlerinin ikisi de World Energy Investment 2026 metninde bulunamamıştır.
902 milyar dolarlık şebeke değerinin kaynağı
IRENA raporunun 64. sayfasında IRENA'nın Mayıs 2026 tarihli Transitioning away from fossil fuels raporuna atıfla verilmektedir. Değer bu raporun metninde bulunamamıştır; rapor 2026-2035 dönemi için şebekelere yılda yaklaşık 1 trilyon dolar (Tablo 1, s. 27), 2026-2030 dönemi için elektrik şebekeleri ve enerji esnekliğine toplam 5,5 trilyon dolar (s. 26) vermektedir.
IRENA'nın iki 1,5°C şebeke değeri: 671 ve 902 milyar dolar
Weekly Insight #17, IRENA'nın 08.01.2026 tarihli makalesinde IRENA 1,5°C Senaryosu kapsamında 2030'a kadar yıllık şebeke yatırımı ihtiyacı olarak verilen 671 milyar doları aktarmıştır. IRENA izleme raporu revize 1,5°C Senaryosu kapsamında 2030'a kadar yılda yaklaşık 902 milyar dolar vermekte (s. 64) ve revize senaryonun yayımlanacak World Energy Transitions Outlook 2026'da yer alacağını belirtmektedir (s. 25). İncelenen kaynaklar iki değeri uzlaştırmamaktadır.
IEA'nın %33 değerinin zamanı
IEA raporu maliyet-etkin payı 15. ve 53. sayfalarda yıl belirtmeden ("today"), 51. sayfada 2035 için ("in 2035") vermektedir; IEA basın bülteni 2035'e kadar ("by 2035") ifadesini kullanmaktadır. Bu sayıda değer, 51. sayfadaki dayanakla 2025 koşullarında verilmektedir.
Yürürlükteki politika ayarlarında ("today's policy settings") 2035 payı
"Around 30%" (yaklaşık %30; IEA, s. 20) ve "slightly less than 30%" (%30'un biraz altında; IEA, s. 48). İki sayfa da senaryo adı vermemektedir. 51. sayfa yılda yaklaşık 925 TWh'lik talep artışı değeri için Açıklanan Politikalar Senaryosu (STEPS) adını vermektedir; 49. sayfadaki IEA Şekil 2.1'in başlığında "STEPS and HES" (HES: Yüksek Elektrifikasyon Senaryosu) yer almaktadır. 2035 payı burada yürürlükteki politika ayarlarına dayanan senaryolarda yaklaşık %30 olarak verilmektedir.
25 ülke sayımının başlangıcı
"Since February 2026" (Şubat 2026'dan bu yana; IEA, s. 15) ve "Since March, around 25 countries" (Mart'tan bu yana yaklaşık 25 ülke; IEA, s. 36).
2025 güneş ve rüzgâr ilavesi
IEA raporu 35. sayfada yaklaşık 600 GW güneş ve yaklaşık 140 GW rüzgâr, 100. sayfada yaklaşık 630 GW ve yaklaşık 160 GW vermektedir. IRENA 513 GW ve 158 GW vermektedir (s. 25-26). IRENA, 26. sayfada verilerinin 31 Aralık itibarıyla ticari işletmedeki santralleri kapsadığını ve ağırlıklı olarak üye ülkelerin resmî bildirimlerinden derlendiğini belirtmektedir. Bu sayıda kapasite değerleri yalnız IRENA'dan alınmıştır.
Şekillerden alınan değerler
IEA Şekil 1.5 (2000-2025 payları) ve 49. sayfadaki IEA Şekil 2.1'den alınan değerler grafikten okunmuştur ve yaklaşıktır. IRENA Şekil 1, 2, 3, 6, 7 ve 8'den alınan değerler grafik etiketleridir. IRENA, Şekil 7'deki son yıl değerlerini IEA World Energy Statistics and Balances verisinden hesaplamakta (s. 40, 3 numaralı not), Şekil 8'deki son yıl değerlerini IRENA, BloombergNEF ve IEA verilerinden derlemektedir (s. 47, 2 numaralı not). 2024 kurulu güç değerleri, 2025 değerlerinden 2025 ilavesi düşüldüğünde elde edilen değerlerle yaklaşık 1 GW farkla örtüşmektedir. 455 milyar dolarlık 2024 şebeke ve esneklik değeri ise 2025 bileşenlerinin belirtilen %12 ve %33 artış oranlarıyla geriye indirgenmiş toplamından yaklaşık 1 milyar dolar farklıdır (hesap).
2025 enerji verimliliği yatırımı: 362 veya 369 milyar dolar
IRENA raporu 16. sayfada 362 milyar dolar, 46-47. sayfalarda 369 milyar dolar vermektedir; burada 369 milyar dolar kullanılmaktadır.
IRENA basın bülteninde 2025 enerji yoğunluğu iyileşmesi
IRENA'nın lansman basın bülteni enerji yoğunluğunun 2025'te yaklaşık %2 iyileştiğini ("improved by around 2%") belirtmektedir. Rapor %1,7 vermektedir (s. 16, 38); burada %1,7 kullanılmaktadır.
IRENA basın bülteninde "iki katından fazla" ifadesi
Lansman basın bülteni "nearly USD 1 trillion annually between 2026-2030, more than double 2025 levels" (2026-2030 döneminde yılda yaklaşık 1 trilyon dolar, 2025 düzeylerinin iki katından fazla) ifadesini kullanmaktadır. Rapor şebeke ve esneklik için yılda en çok 1 trilyon dolar ("up to USD 1 trillion"; s. 46) ve 874-981 milyar dolarlık bir aralık (s. 47) vermektedir. 2025'teki 525 milyar dolarlık şebeke ve esneklik toplamına göre 1 trilyon dolar 1,90 kat, aralık 1,66-1,87 kattır (hesap). Yalnız şebekeye ilişkin yaklaşık 800 milyar dolarlık ihtiyaç, 422 milyar dolarlık şebeke bileşeninin 1,90 katıdır (hesap).
IRENA sayıları arasında yatırım ihtiyacı
IRENA'nın 2024 sayısına ilişkin 11.10.2024 tarihli basın bülteni, yenilenebilir kapasite için 2024-2030 döneminde yılda 1,5 trilyon dolar vermektedir. IRENA'nın 2025 sayısına ilişkin 14.10.2025 tarihli basın bülteni, yenilenebilir enerji için 2025-2030 döneminde yılda en az 1,4 trilyon dolar vermektedir. 2026 sayısı, yenilenebilir enerji üretim kapasitesi için 2026-2030 döneminde 2025 fiyatlarıyla yılda 1,7 trilyon dolar vermektedir (s. 45, 47). Önceki değerlerin fiyat bazı teyit edilmediğinden üç değer burada karşılaştırılmamaktadır.
Çin, 2026 tam yıl
IRENA raporunda yalnız 2026 ilk yarısına ait değişimler yayımlanmıştır (s. 57). 01.10.2026 itibarıyla tam yıl istatistikleri yayımlanmamıştır.
Kaynaklar.
Uluslararası Enerji Ajansı, Electrification – Special Report (22.09.2026, CC BY 4.0) ve IEA'nın 22.09.2026 tarihli basın bülteni.
Uluslararası Yenilenebilir Enerji Ajansı, COP31 Başkanlığı ve Global Renewables Alliance, Delivering on the UAE Consensus: Tracking progress toward tripling renewable energy capacity and doubling energy efficiency by 2030 (2026 sayısı, ISBN 978-92-9260-750-0). Bu kaynak şunları da kapsamaktadır:
raporda aktarılan IEA World Energy Investment 2026 ve Electricity 2026, BloombergNEF, Montel Analytics, Çin Ulusal Enerji İdaresi, Almanya Federal Şebeke Ajansı (Bundesnetzagentur), Birleşmiş Milletler İklim Değişikliği Çerçeve Sözleşmesi NDC Registry verileri ve 22.07.2026 tarihli Reuters haberi;
raporun 2. sayfasında yer alan Birinci Küresel Durum Değerlendirmesi sonuç metni (Birleşmiş Milletler İklim Değişikliği Çerçeve Sözleşmesi, 2023).
IRENA'nın "Renewables Gain Ground, but Must Accelerate Towards the 2030 Goal" başlıklı basın bülteni ve raporun yayımlandığına ilişkin 21.09.2026 tarihli X duyurusu.
Uluslararası Enerji Ajansı, World Energy Investment 2026 (28.05.2026; revize sürüm, Haziran 2026), s. 9, 67, 95, 96; Uluslararası Yenilenebilir Enerji Ajansı, Transitioning away from fossil fuels (Mayıs 2026), s. 26-27. İki yayın, IRENA izleme raporunda atıf yapılan değerler için incelenmiştir.
Uluslararası Enerji Ajansı, Electricity 2026 (Şubat 2026), s. 10, 46; Weekly Insight #17'de yer alan değer için incelenmiştir.
IRENA'nın "Global Goal of Tripling Renewables Needs USD 1.5 Trillion Investment Per Year" (11.10.2024) ve "World Breaks Renewable Records but Must Move Faster to Hit 2030 Tripling Goal" (14.10.2025) başlıklı basın bültenleri; IRENA'nın "Funding Grid and Storage Enhancement: The Call for Stronger Public-Private Collaboration" başlıklı makalesi (08.01.2026).
Bu yayının Weekly Insight #9 (27.06.2026), #13 (30.07.2026), #17 (04.09.2026) ve #19 (18.09.2026) sayıları.
Alıntılar sayfa atıflı kısa pasajlarla sınırlıdır. Değerlendirme UzEnergyNews tarafından yapılmıştır.
WEEKLY INSIGHT #19 · GAS · LNG18 September 2026 · 16 min read EN · 12 dk TR · Global
Zero LNG Transits Through Hormuz Since 11 July: Europe's storage series, the price readings and the fourth-quarter estimates
Kpler recorded no laden liquefied natural gas transit through the Strait of Hormuz after 11 July 2026. The closure that began on 28 February removed more than 10 billion cubic feet a day of supply, about 20 per cent of global LNG trade, predominantly at Qatar's Ras-Laffan complex (United States Energy Information Administration, 28 April 2026). Qatar shipped 18 cargoes in the first six months of the conflict against 509 in the same period a year earlier, and the International Energy Agency measures Qatari and Emirati supply 35 billion cubic metres lower between March and June than in the same four months of 2025. European Union storage stood at 68.04 per cent, or 769.87 terawatt-hours, at 06:00 CEST on 13 September (Gas Infrastructure Europe, AGSI+), against a five-year seasonal comparison base that different sources place between 82 and 88 per cent. The Dutch front-month contract was assessed at 84.275 euros a megawatt-hour on 14 September and at 78.80 euros on 18 September. Four institutions place their fourth-quarter estimates between 45 and 80 euros a megawatt-hour. This edition sets out the transit series, the volumes withdrawn from the market, the price readings with their dates, and the injection mechanics behind the filling rate.
The closure sequence and the transit count
The closure of the Strait of Hormuz began on 28 February 2026. On 4 March the Islamic Revolutionary Guard Corps (IRGC) stated that it held full control over the strait, and QatarEnergy declared force majeure on its liquefied natural gas contracts on the same date (United States Energy Information Administration, 28 April 2026; secondary accounts carry 3 March for the declaration and the agency date is used here). An understanding reached on 17 June was followed by a renewed closure on 20 June; the ceasefire lapsed on 8 July, and on 12 July the IRGC Navy declared the strait formally closed. Reports of attacks and transit interruptions continued through mid-September (GlobalSecurity daily compilation, 16-17 September 2026).
Kpler recorded no laden LNG vessel transiting the strait in March, four in April, eight in May and 40 in June, and none after 11 July, when a vessel operated on behalf of Adnoc made the last recorded passage. The 40 June transits do not fit inside the three days between the 17 June understanding and the 20 June reclosure; the Kpler record places passages on dates through the month and includes a vessel entering the Gulf on 26 June. The observation window of the Energy Information Administration covers 1 March to 24 April and records no laden LNG transit in that window; the dates of the four April transits within the month have not been published. On the same count, 13 LNG vessels were in ballast, five were laden and four were berthed at terminals in the Gulf.
Total vessel traffic is counted differently by different methods. Kpler figures reported on 15 September show four transits that day against a ten-day average of 18, while Windward counted 12 transits on 16 September, of which three were broadcasting automatic identification system signals; the remainder were detected by satellite. The pre-conflict baseline was about 125 transits a day. For liquefied natural gas the measurement is separate: zero laden transits since 11 July. Weekly Insight #17 measured network financing and #18 the nuclear fuel chain; this edition measures gas and liquefied natural gas.
Volumes withdrawn from the market
The closure affected more than 10 billion cubic feet a day of global liquefied natural gas supply, about 20 per cent of global LNG trade, predominantly at Qatar's Ras-Laffan facility. More than 80 per cent of QatarEnergy's sales are contracted to Asia. United States LNG exports reached 17.9 billion cubic feet a day in March with terminal utilisation at 94 per cent, against 17.3 billion cubic feet a day and 91 per cent in February, and Henry Hub was 9 per cent below its 28 February level (United States Energy Information Administration, 28 April 2026).
Qatar shipped 18 cargoes in the first six months of the conflict against 509 in the same period of the previous year, a decline of 96 per cent, and gas sales not realised over those six months are placed at about 24 billion dollars, equal to about 20.7 billion euros at 1.1594 dollars to the euro (Euronews, 8 September 2026). Two of the 14 liquefaction trains are damaged, taking 17 per cent of Qatari capacity — about 12.8 million tonnes a year — out of service, with repair stated at three to five years; Qatari and Emirati volumes are 36 million tonnes below the 2025 level for the year to date, of which about 20 million tonnes have been covered by United States and Canadian cargoes (The National, 14 September 2026).
On the International Energy Agency measure, Qatari and Emirati supply between March and June was 35 billion cubic metres lower than in the same four months of 2025, with production in those months down about 80 per cent. Production outside the Gulf rose 18 per cent, or about 27 billion cubic metres, covering some three quarters of the Gulf shortfall. Global LNG output was 4 per cent, or 8 billion cubic metres, lower over the same four months and is flat year on year for 2026 as a whole. The three readings close against each other: 35 billion cubic metres withdrawn less 27 billion replaced leaves the 8 billion measured as the global shortfall. Global gas demand is measured 0.5 per cent, or about 20 billion cubic metres, lower in 2026, the third annual contraction of the decade, and the cumulative 2026-2030 supply loss is estimated at 140 billion cubic metres (International Energy Agency, Gas Market Report Q3-2026 and statement of 7 July 2026).
Three cargoes were moved by ship-to-ship transfer off Oman and the United Arab Emirates in August, destined for India and Japan. Each transfer adds more than one million dollars and 30 to 35 hours of additional voyage time (Euronews, 8 September 2026, on Kpler and Vortexa data).
Price readings, each with its date
The readings below are stated with the date and the instrument on which each was made. Front-month futures, weekly averages and forward spot assessments are not interchangeable and are not combined here. Two sources state year-to-date percentage changes on bases that differ from one another; those percentages are listed among the watch points rather than reproduced in the table.
Date
Indicator
Reading
Source
Week of 24 April 2026
TTF
14.80 dollars a million British thermal units, 35 per cent above 28 February
EIA, 28 April 2026
Week of 24 April 2026
JKM
16.02 dollars a million British thermal units, 51 per cent above 28 February
EIA, 28 April 2026
Second quarter 2026 average
TTF / Platts JKM
about 16 dollars (+32 per cent year on year) / 17.5 dollars (+45 per cent)
IEA, Gas Market Report Q3-2026
20 August 2026
TTF front month
65 euros a megawatt-hour, highest since March
Euronews, 20 August 2026
4 September 2026
TTF front month
72.50 euros a megawatt-hour; weekly gain above 8 per cent, fourth consecutive weekly increase; highest since 2023
Reuters, reported 4 September 2026
6 September 2026
TTF October contract / November-March strip
72.90 / 70.90 euros a megawatt-hour
Citigroup analysis, reported 6 September 2026
14 September 2026, 07:50 Amsterdam
TTF front month
84.275 euros a megawatt-hour, equal to 97.31 dollars; intraday gain 6 per cent; above the January 2023 level
Mansfield Energy daily note, 14 September 2026 (single source)
15 September 2026
North-east Asia spot LNG, four to eight weeks forward
28.40 dollars a million British thermal units, 2.70 dollars higher on the week
Energy Intelligence
15 September 2026
South-west Europe spot LNG
27.50 dollars a million British thermal units, 3.00 dollars higher on the week
Energy Intelligence
17 September 2026
Brent settlement
104.82 dollars a barrel
Market compilation; no dated primary release identified
18 September 2026
TTF front month
78.80 euros a megawatt-hour, an intraday reading; intraday gain 3.20 per cent
TradingEconomics
Converted at 3.412 million British thermal units to the megawatt-hour, the 14 September European front-month reading of 97.31 dollars a megawatt-hour equals 28.5 dollars a million British thermal units. The north-east Asian spot assessment for 15 September is 28.40 dollars and the south-west European assessment 27.50 dollars. The three readings fall within about one dollar of each other; they are one day apart and are made on different instruments, a front-month futures contract in the first case and forward spot assessments in the other two.
Injection economics: the seasonal spread and terminal utilisation
When the near-dated contract trades above the forward-dated one, gas bought for injection cannot be sold forward at a price that covers its purchase cost, and the commercial incentive to fill storage is removed irrespective of available physical capacity. The summer 2026 contract traded 0.5 euros a megawatt-hour above the winter 2026 contract in January 2026 (Timera Energy, 26 January 2026). From 1 April the summer-winter spread averaged minus 1.2 euros a megawatt-hour within a band of minus 1 to minus 2.5 euros, and injections ran 20 per cent below the previous year at about 200 million cubic metres a day, a rate implying 70 per cent filling on 1 November (European Gas Hub, 13 May 2026).
The European Union Agency for the Cooperation of Energy Regulators reported on 7 July 2026 that unfavourable winter-summer price differences weaken the incentive to fill storage, with regasification capacity providing partial compensation. Initiative Energien Speichern stated on 8 September 2026 that the insufficient injection incentive arises from the high prices caused by the Hormuz closure together with a summer-winter difference that has at times been negative. The latest injection rate on the AGSI+ reading of 13 September 2026 is 0.19 percentage points a day.
Physical import capacity is measured separately. European Union LNG import capacity stands at 242 billion cubic metres a year, 76 billion cubic metres of which was added between 2021 and 2025, and average terminal utilisation was 55 per cent in the first quarter of 2026 against 51 per cent in 2025 and 42 per cent in 2024 (IEEFA European LNG Tracker; European Commission). The utilisation measurement and the injection-rate measurement are two separate readings and are stated together.
The storage series and the comparison base
European Union storage readings are set out below with their dates. The five-year seasonal comparison base is stated between 82 and 88 per cent depending on the source, and each reading below carries the base used by the source that published it.
Date
Reading
Comparison base stated by the source
Source
1 April 2026 (end of winter)
28 per cent
five-year average 41 per cent
EIA, 28 April 2026; ACER, 7 July 2026
2 July 2026
about 49 per cent
below the ten-year average and below 2025
ACER, 7 July 2026
1 August 2026
57.1 per cent
lowest on record for that calendar day
Euronews, 20 August 2026
15 August 2026
60.8 per cent
below recent years
GIE, reported by S&P Global, 17 August 2026
4 September 2026
about 62 per cent
below the five-year seasonal average
Reuters, 4 September 2026
6 September 2026
66.59 per cent
base not stated
derived AGSI+ reading
13 September 2026, 06:00 CEST
68.04 per cent, 769.87 terawatt-hours
five-year base stated between 82 and 88 per cent across sources; the gap is 13.96 points against 82 per cent and 19.96 points against 88 per cent
GIE AGSI+
mid-September 2026 (cut-off date not stated)
65 per cent
average 82 per cent
ABN AMRO, Gas Market Strategist
Germany, early September 2026
about 53 per cent, lowest for that date in 15 years of records
about 71 per cent a year earlier
INES, 8 September 2026
Germany, mid-September 2026
about 55 per cent, about 136 terawatt-hours
reserved capacity about 83 per cent
INES and press reports
Two readings for the same week differ: 65 per cent in the ABN AMRO note, which does not state its cut-off date, and 68.04 per cent on the AGSI+ reading of 13 September. The difference of about three points has not been reconciled in a published series.
The European Union filling target is 90 per cent, attainable on any date between 1 October and 1 December, with a deviation of up to 10 percentage points permitted in difficult market conditions; the regime has been extended to 31 December 2027 (European Parliament and Council documents). The same assessment of 7 July 2026 stated that meeting the 90 per cent target requires European Union LNG imports about 13 per cent above the 2025 level, while the 80 per cent level is attainable at 2025 import volumes. For Germany, Initiative Energien Speichern calculates that about 77 per cent is technically attainable on 1 November and that, in an extreme cold winter, the gap on individual January days exceeds 25 per cent of daily demand.
Fourth-quarter estimates from four institutions
Four institutions have published fourth-quarter estimates. The attributions below are by institution and title; individual names are not reproduced.
Institution
Estimate
Date
ABN AMRO (senior energy economist)
45-50 euros a megawatt-hour in the fourth quarter if Hormuz reopens; 70-80 euros if it remains closed
publication date not verified
Oxford Economics (economist)
about 60 euros a megawatt-hour on average across the fourth quarter of 2026 and the first quarter of 2027; euro-area headline inflation 3.5 per cent in the second half of 2026 against 3 per cent in the baseline
20 August 2026
Citigroup
probability-weighted winter estimate of 61 euros a megawatt-hour, against market pricing of 72.90 euros for October and 70.90 for November-March
6 September 2026
Rabobank (energy strategist)
60 euros a megawatt-hour average in the fourth quarter of 2026; 42 euros as the 2027 baseline and 50-60 euros in an infrastructure-damage scenario
8 September 2026
Three of the four estimates for the winter fall between 60 and 61 euros a megawatt-hour, and the fourth is stated as a range conditional on the strait. The market front-month contract was assessed at 84.275 euros on 14 September and 78.80 euros on 18 September. The difference between the institutional estimates and the traded front month is between about 18 and 24 euros a megawatt-hour on those two dates.
The electricity link
Coal fell to its lowest recorded share of European generation in 2025 (Ember, European Electricity Review 2026), which narrows the margin available from coal-to-gas switching. The share of hours in which gas set the wholesale electricity price in individual member states, and the day-ahead price bands recorded during the periods of tension, could not be tied to a dated primary release and are listed among the watch points.
Three further factors slowed injection over the 2026 summer: gas-fired generation raised by the southern European heatwave, Norwegian offshore maintenance outages and delays to Qatari LNG deliveries (Reuters, 4 September 2026).
Eurasia: pipeline volumes and the region's exposure
Indicator
Reading
Source
Gazprom deliveries to Kazakhstan, Kyrgyzstan and Uzbekistan, 2026
about 70 per cent higher
Times of Central Asia
Russian gas deliveries to Uzbekistan
6.48 billion cubic metres in 2025 (+15 per cent); above 10 billion cubic metres expected for 2026
IEA; Times of Central Asia
Uzbek gas production, first half of 2026
18.3 billion cubic metres, 16.4 per cent lower year on year
Times of Central Asia; Kursiv
Türkiye LNG imports
11.1 billion cubic metres in January-October 2025, 24.55 per cent of total gas imports; 16.6 billion cubic metres projected for 2026 (publication date of the projection not stated)
S&P Global Commodity Insights
Azerbaijani gas exports, first half of 2026
about 13 billion cubic metres in total; the first Trans Adriatic Pipeline expansion was completed in January 2026, adding 1.2 billion cubic metres a year
Caspian News, 21 July 2026
Central Asia imports no liquefied natural gas, and its exposure to the closure runs through pipeline volumes and domestic tariffs rather than through cargo pricing. That exposure has not been measured in a published series and is not quantified here.
The 19 June entry in this record
This publication carried a Top Story on 19 June 2026 under the title "Hormuz Set to Reopen and Brent Drops Below $80: A Gulf De-escalation That Reshapes the Map for Caspian Exporters", published at 08:00 on that date. The measurement current on the day of publication was a Brent price below 80 dollars a barrel and an understanding reached on 17 June; that entry recorded the understanding as extending the ceasefire by 60 days. The ceasefire lapsed on 8 July, 19 days after the entry. June carries 40 laden LNG transits on the Kpler count, the only month of 2026 with a material figure. The closure resumed on 20 June, the last laden LNG transit was recorded on 11 July and the IRGC Navy declaration followed on 12 July. Brent settled at 104.82 dollars a barrel on 17 September 2026 (market compilation; no dated primary release identified).
No separate follow-up on the status of the strait was published after 20 June. The consequences of the closure were carried in two later entries: Weekly Insight #13 of 30 July 2026, which recorded that the closure had removed nearly 20 per cent of global LNG supply, and the Top Story of 3 August 2026 on the Kirkuk-Ceyhan corridor, which recorded Iraqi oil shipments down by more than 80 per cent and monthly revenues falling from about 6 billion dollars to under 2 billion. The archive Top Stories carry no separate page and no permanent link; the 19 June entry is cited here by date and title, and the archive card carries its original headline without a correction note.
Watch points: what could not be measured
The following items are stated as unmeasured rather than estimated.
Item
Status
Daily transit count
Method-dependent. Kpler figures reported by Reuters show four transits on 15 September and a ten-day average of 18; Windward counted 12 on 16 September, three of them broadcasting AIS. The difference arises from satellite detection of vessels with transponders switched off. A single daily figure cannot be stated.
LNG vessels in the Gulf
The count reports 21 vessels waiting, while the composition published alongside it — 13 in ballast, five laden, four berthed — sums to 22. A single total cannot be stated.
Dates of the four April transits
Not published. The Energy Information Administration window of 1 March to 24 April records no laden transit, and the placement of the April transits within the month has not been reconciled in a published series. If both counts hold, the four transits fall between 25 and 30 April; that window is derived here and is not published as such.
Transit count against cargo count
The 52 laden transits recorded between March and June and the 18 Qatari cargoes recorded over six months measure different sets: transits through the strait regardless of origin in the first case, delivered Qatari cargoes in the second. The two have not been reconciled in a published series.
Consistency of the 4 September storage reading
The reading of about 62 per cent on 4 September implies a fill of 2.3 percentage points a day to the 66.59 per cent reading of 6 September, against 0.06 to 0.27 points a day in every other segment of the series. The reading is carried as published and is not adjusted here; which of the two readings is the outlier has not been established.
Pre-conflict daily transit baseline
The figure of about 125 transits a day is carried without a dated attribution; no source for it is listed in the sources paragraph and it could not be tied to a published series.
Euro-dollar basis
Two rates are implied on this page and neither is dated: 1.1594 in the conversion of 24 billion dollars to 20.7 billion euros, which is arithmetic performed here rather than a source reading, and 1.1547 implied by the pairing of 84.275 euros with 97.31 dollars. The basis and date of each could not be established.
Five-year storage comparison base
Stated between 82 and 88 per cent across sources; a single base could not be established.
Basis of the 35 and 27 billion cubic metre figures
Stated in one account on an annualised basis and consistent in this text with the four-month period reading; the International Energy Agency's own basis could not be confirmed against the primary release.
Year-to-date percentage changes in gas prices
Two sources state 130 per cent above the start of the year at 65 euros (20 August) and 143 per cent at 78.80 euros (18 September), which imply start-of-year bases of 28.26 and 32.43 euros a megawatt-hour. The bases differ and are not reproduced here.
The 14 September reading of 84.275 euros
Single-source. Independent compilations place the peak of about 84 euros in early September and 16 September in a band of 77.58 to 78.03 euros; the date was not confirmed by a second source.
The weekly change to 18 September
TradingEconomics states this reading as 2 per cent lower on the week and the first weekly decline in six weeks. The 18 September leg is an intraday reading; the basis and time of the 11 September leg are not published. No settlement pair for the two dates was established from a published source, so the weekly percentage is not carried in the price table above.
Period of the 24 billion dollars of unrealised sales
Stated here as the first six months of the conflict on the reporting source; the relationship to QatarEnergy's own statements could not be verified.
Gas price-setting hours and day-ahead bands
The share of hours in which gas set the price in Italy, Germany, the Netherlands, Spain and Portugal, and the Italian and French day-ahead bands during the periods of tension, rest on market compilations; no dated primary release was identified.
Brent settlement of 104.82 dollars
Market compilation; no dated primary release identified.
Additional 5-point deviation from the filling target
Reported in secondary accounts as available by Commission decision; the article reference could not be confirmed in the regulation texts and it is not stated in the body.
Publication date of the ABN AMRO estimate and the cut-off of its 65 per cent reading
Not verified by direct access; two retrieval attempts timed out.
Qatari reloading schedule
Not published. Executives of four major producers stated on 14 September that exports would not return to normal levels immediately on a reopening; no date was given.
Institutional winter projection from the International Energy Agency
The fourth-quarter 2026 Gas Market Report has not been published; October is expected.
Saudi pipeline incident of 17 September and crude volumes rerouted around Hormuz
Not verifiable from a primary source; the source page returned an access error.
European LNG import outturn for 2026
Not measured. The available projection of 145 million tonnes is dated December 2025 and rests on pre-closure assumptions.
Direct exposure of Uzbekistan and Central Asia
Not measured; the region imports no LNG and the linkage runs through pipeline imports and domestic tariffs.
Sources cited in text and figures: United States Energy Information Administration, Today in Energy (28 April 2026); International Energy Agency, Gas Market Report Q3-2026 and statement of 7 July 2026; European Union Agency for the Cooperation of Energy Regulators (7 July 2026); Kpler transit and vessel data, including its statement on LNG transits since 11 July; Euronews (20 August and 8 September 2026) on Kpler and Vortexa data; The National (14 September 2026); Energy Intelligence spot LNG assessments (15 September 2026); Mansfield Energy daily note (14 September 2026); Reuters (4 September 2026); Citigroup analysis reported 6 September 2026; ABN AMRO Gas Market Strategist; Oxford Economics (20 August 2026); Rabobank commentary reported 8 September 2026; Initiative Energien Speichern (8 September 2026); Gas Infrastructure Europe, AGSI+ (13 September 2026); S&P Global Commodity Insights (17 August 2026); Timera Energy (26 January 2026); European Gas Hub (13 May 2026); IEEFA European LNG Tracker; European Commission and European Parliament documents on the storage regulation; Ember, European Electricity Review 2026; TradingEconomics (18 September 2026); Windward and GlobalSecurity daily compilations (16-17 September 2026); Caspian News (21 July 2026); Times of Central Asia and Kursiv; and this publication's own archive entries of 19 June, 30 July and 3 August 2026. Copyrighted material is not reproduced. Analysis by UzEnergyNews.
11 Temmuz'dan Bu Yana Hürmüz'den Sıfır LNG Geçişi: Avrupa'nın depolama serisi, fiyat okumaları ve dördüncü çeyrek tahminleri
Kpler, 11 Temmuz 2026'dan sonra Hürmüz Boğazı'ndan yüklü hiçbir sıvılaştırılmış doğal gaz (LNG) gemisi geçişi kaydetmemiştir. 28 Şubat'ta başlayan kapanış, ağırlıklı olarak Katar'ın Ras-Laffan tesisinde olmak üzere günde 10 milyar fit küpün üzerinde arzı — küresel LNG ticaretinin yaklaşık %20'sini — piyasa dışında bırakmıştır (Amerika Birleşik Devletleri Enerji Enformasyon İdaresi, 28.04.2026). Katar, çatışmanın ilk altı ayında 18 kargo sevk etmiştir; bir önceki yılın aynı döneminde bu sayı 509'dur. Uluslararası Enerji Ajansı, Katar ve Birleşik Arap Emirlikleri arzını Mart-Haziran döneminde 2025'in aynı dört ayına göre 35 milyar metreküp daha düşük ölçmektedir. Avrupa Birliği depolama doluluğu 13 Eylül 06:00 CEST itibarıyla %68,04 — 769,87 TWh — düzeyindedir (Gas Infrastructure Europe, AGSI+); beş yıllık mevsim karşılaştırma tabanı kaynaklara göre %82 ile %88 arasında değişmektedir. Hollanda ön ay kontratı 14 Eylül'de 84,275 EUR/MWh, 18 Eylül'de 78,80 EUR/MWh olarak değerlendirilmiştir. Dört kurumun dördüncü çeyrek tahminleri 45 ile 80 EUR/MWh arasındadır. Bu sayıda geçiş serisi, piyasadan çekilen hacimler, tarihleriyle birlikte fiyat okumaları ve doluluk hızının arkasındaki enjeksiyon mekanizması verilmektedir.
Kapanış dizisi ve geçiş sayısı
Hürmüz Boğazı'nın kapanışı 28 Şubat 2026'da başlamıştır. 4 Mart'ta İran İslam Devrimi Muhafızları Ordusu (IRGC) boğaz üzerinde tam denetim beyanında bulunmuş, QatarEnergy aynı tarihte LNG sözleşmelerinde mücbir sebep ilan etmiştir (Amerika Birleşik Devletleri Enerji Enformasyon İdaresi, 28.04.2026; ikincil kaynaklar ilan tarihini 3 Mart olarak vermekte, burada ajans tarihi kullanılmaktadır). 17 Haziran'da varılan mutabakatın ardından 20 Haziran'da yeniden kapanış gerçekleşmiş, ateşkes 8 Temmuz'da sona ermiş, 12 Temmuz'da IRGC Donanması boğazı resmen kapalı ilan etmiştir. Saldırı ve geçiş kesintisi bildirimleri Eylül ortasında sürmektedir (GlobalSecurity günlük derlemesi, 16-17.09.2026).
Kpler kayıtlarında boğazdan yüklü LNG gemisi geçişi Mart'ta sıfır, Nisan'da dört, Mayıs'ta sekiz, Haziran'da 40'tır; 11 Temmuz'dan sonra geçiş kaydedilmemiştir. Son geçiş, Adnoc adına işletilen bir gemiyle 11 Temmuz'da yapılmıştır. Haziran'daki 40 geçiş, 17 Haziran mutabakatı ile 20 Haziran'daki yeniden kapanış arasındaki üç güne sığmamaktadır; Kpler kaydı geçişleri ay içinde farklı tarihlere yerleştirmekte ve 26 Haziran'da Körfez'e giren bir gemiyi de kapsamaktadır. Enerji Enformasyon İdaresi'nin gözlem aralığı 1 Mart-24 Nisan'ı kapsamakta ve bu aralıkta yüklü LNG geçişi kaydetmemektedir; Nisan'daki dört geçişin ay içindeki tarihleri yayımlanmamıştır. Aynı sayımda Körfez'de 13 LNG gemisi balastta, beşi yüklü, dördü terminallerde rıhtımdadır.
Toplam gemi trafiği yönteme göre farklı sayılmaktadır. 15 Eylül'de aktarılan Kpler verisi o gün için dört geçiş ve 10 günlük ortalama olarak 18 geçiş göstermekte; Windward 16 Eylül'de 12 geçiş saymakta, bunların üçü otomatik tanımlama sistemi sinyali yayımlamaktadır, kalanı uydu ile tespit edilmiştir. Çatışma öncesi taban günde yaklaşık 125 geçiştir. Sıvılaştırılmış doğal gaz için ölçüm ayrıdır: 11 Temmuz'dan bu yana yüklü geçiş sıfırdır. Weekly Insight #17 şebeke finansmanını, #18 nükleer yakıt zincirini ölçmüştü; bu sayı gaz ve sıvılaştırılmış doğal gazı ölçmektedir.
Piyasadan çekilen hacimler
Kapanış, küresel LNG arzında günde 10 milyar fit küpün üzerinde bir hacmi — küresel LNG ticaretinin yaklaşık %20'sini — ağırlıklı olarak Katar'ın Ras-Laffan tesisinde etkilemiştir. QatarEnergy satışlarının %80'den fazlası Asya'ya sözleşmelidir. Amerika Birleşik Devletleri LNG ihracatı Mart'ta günde 17,9 milyar fit küpe, terminal kullanımı %94'e ulaşmıştır; Şubat değerleri günde 17,3 milyar fit küp ve %91'dir. Henry Hub aynı dönemde 28 Şubat düzeyinin %9 altındadır (Enerji Enformasyon İdaresi, 28.04.2026).
Katar çatışmanın ilk altı ayında 18 kargo sevk etmiştir; bir önceki yılın aynı döneminde 509 kargo sevk edilmiştir ve azalış %96'dır. Bu altı ayda gerçekleşmeyen gaz satışları yaklaşık 24 milyar dolar olarak verilmektedir; 1 euro = 1,1594 dolar kuruyla yaklaşık 20,7 milyar euroya karşılık gelmektedir (Euronews, 08.09.2026). On dört sıvılaştırma treninin ikisi hasarlıdır; bu, Katar kapasitesinin %17'sini, yılda yaklaşık 12,8 milyon tonu devre dışı bırakmakta, onarım süresi üç ila beş yıl olarak açıklanmaktadır. Katar ve Birleşik Arap Emirlikleri hacimleri yıl başından bu yana 2025 düzeyinin 36 milyon ton altındadır; bunun yaklaşık 20 milyon tonu Amerika Birleşik Devletleri ve Kanada kargolarıyla karşılanmıştır (The National, 14.09.2026).
Uluslararası Enerji Ajansı ölçümünde Katar ve Birleşik Arap Emirlikleri arzı Mart-Haziran döneminde 2025'in aynı dört ayına göre 35 milyar metreküp daha düşük, aynı aylardaki üretim ise yaklaşık %80 daha azdır. Körfez dışındaki üretim %18 — yaklaşık 27 milyar metreküp — artmış ve Körfez açığının yaklaşık dörtte üçünü karşılamıştır. Küresel LNG üretimi aynı dört ayda %4, yani 8 milyar metreküp daha düşüktür; 2026 bütününde yıllık değişim yataydır. Üç okuma birbirini kapatmaktadır: çekilen 35 milyar metreküpten yerine konan 27 milyar metreküp düşüldüğünde küresel açık olarak ölçülen 8 milyar metreküp kalmaktadır. Küresel gaz talebi 2026'da %0,5 — yaklaşık 20 milyar metreküp — daha düşük ölçülmektedir ve bu, on yılın üçüncü yıllık daralmasıdır. 2026-2030 birikimli arz kaybı 140 milyar metreküp olarak tahmin edilmektedir (Uluslararası Enerji Ajansı, Gas Market Report Q3-2026 ve 07.07.2026 açıklaması).
Ağustos ayında Umman ve Birleşik Arap Emirlikleri açıklarında gemiden gemiye aktarma yöntemiyle üç kargo taşınmış, kargolar Hindistan ve Japonya'ya yönlendirilmiştir. Her aktarma bir milyon doların üzerinde ek maliyet ve 30-35 saat ek seyir süresi getirmektedir (Euronews, 08.09.2026; Kpler ve Vortexa verileri).
Fiyat okumaları, her biri kendi tarihiyle
Aşağıdaki okumalar, yapıldıkları tarih ve gösterge ile birlikte verilmektedir. Ön ay vadeli kontrat, haftalık ortalama ve ileri teslim spot değerlendirmesi birbirinin yerine kullanılamaz ve burada birleştirilmemiştir. İki kaynağın yıl başına göre verdiği yüzde değişimler birbirinden farklı taban ima ettiğinden tabloya alınmamış, izleme noktalarında kaydedilmiştir.
Tarih
Gösterge
Okuma
Kaynak
24 Nisan 2026 haftası
TTF
14,80 dolar/MMBtu; 28 Şubat'a göre %35 yüksek
EIA, 28.04.2026
24 Nisan 2026 haftası
JKM
16,02 dolar/MMBtu; 28 Şubat'a göre %51 yüksek
EIA, 28.04.2026
2026 ikinci çeyrek ortalaması
TTF / Platts JKM
yaklaşık 16 dolar (yıllık +%32) / 17,5 dolar (+%45)
IEA, Gas Market Report Q3-2026
20.08.2026
TTF ön ay
65 EUR/MWh; Mart'tan bu yana en yüksek
Euronews, 20.08.2026
04.09.2026
TTF ön ay
72,50 EUR/MWh; haftalık artış %8'in üzerinde, üst üste dördüncü haftalık artış; 2023'ten bu yana en yüksek
Reuters, 04.09.2026 aktarımı
06.09.2026
TTF Ekim kontratı / Kasım-Mart şeridi
72,90 / 70,90 EUR/MWh
Citigroup analizi, 06.09.2026 aktarımı
14.09.2026, 07:50 Amsterdam
TTF ön ay
84,275 EUR/MWh = 97,31 dolar/MWh; gün içi artış %6; Ocak 2023 düzeyinin üzerinde
Mansfield Energy günlük notu, 14.09.2026 (tek kaynak)
15.09.2026
Kuzeydoğu Asya spot LNG, 4-8 hafta ileri teslim
28,40 dolar/MMBtu; haftalık +2,70 dolar
Energy Intelligence
15.09.2026
Güneybatı Avrupa spot LNG
27,50 dolar/MMBtu; haftalık +3,00 dolar
Energy Intelligence
17.09.2026
Brent kapanış
104,82 dolar/varil
Piyasa derlemesi; tarihli birincil yayın belirlenememiştir
18.09.2026
TTF ön ay
78,80 EUR/MWh, gün içi okuma; gün içi +%3,20
TradingEconomics
Megavat saat başına 3,412 MMBtu çevrimiyle, 14 Eylül'deki 97,31 dolar/MWh düzeyindeki Avrupa ön ay okuması 28,5 dolar/MMBtu'ya karşılık gelmektedir. Kuzeydoğu Asya spot değerlendirmesi 15 Eylül için 28,40 dolar, Güneybatı Avrupa değerlendirmesi 27,50 dolardır. Üç okuma birbirinden yaklaşık bir dolar içinde kalmaktadır; okumalar bir gün arayla ve farklı göstergeler üzerinde — ilki ön ay vadeli kontrat, diğer ikisi ileri teslim spot değerlendirmesi — yapılmıştır.
Enjeksiyon ekonomisi: mevsimsel fark ve terminal kullanımı
Yakın vadeli kontrat ileri tarihli kontrattan yüksek işlem gördüğünde, depoya alınan gaz ileri tarihe satıldığında alış maliyetini karşılamamakta ve fiziksel kapasiteden bağımsız olarak depolama doldurma teşviki ortadan kalkmaktadır. Ocak 2026'da yaz 2026 kontratı kış 2026 kontratının 0,5 EUR/MWh üzerinde işlem görmüştür (Timera Energy, 26.01.2026). 1 Nisan'dan itibaren yaz-kış farkı ortalama −1,2 EUR/MWh olmuş, günlük değerler −1 ile −2,5 EUR/MWh arasında seyretmiş, enjeksiyon bir önceki yıla göre %20 düşük ve günde yaklaşık 200 milyon metreküp düzeyinde gerçekleşmiştir; bu hız 1 Kasım için %70 doluluğa karşılık gelmektedir (European Gas Hub, 13.05.2026).
Avrupa Birliği Enerji Düzenleyicileri İşbirliği Ajansı 07.07.2026 tarihli değerlendirmesinde, elverişsiz kış-yaz fiyat farklarının depolama doldurma teşvikini zayıflattığını, yeniden gazlaştırma kapasitesinin kısmi telafi sağladığını bildirmiştir. Initiative Energien Speichern 08.09.2026 tarihli açıklamasında, yetersiz enjeksiyon teşvikinin Hürmüz kapanışından kaynaklanan yüksek fiyatlar ile zaman zaman negatife dönen yaz-kış farkından doğduğunu belirtmiştir. 13.09.2026 tarihli AGSI+ okumasında son enjeksiyon hızı günde 0,19 puandır.
Fiziksel ithalat kapasitesi ayrı ölçülmektedir. Avrupa Birliği LNG ithalat kapasitesi yılda 242 milyar metreküptür ve bunun 76 milyar metreküpü 2021-2025 arasında eklenmiştir; terminallerde ortalama kullanım 2026 birinci çeyreğinde %55, 2025'te %51, 2024'te %42'dir (IEEFA European LNG Tracker; Avrupa Komisyonu). Kullanım ölçümü ile enjeksiyon hızı ölçümü iki ayrı okumadır ve burada birlikte verilmektedir.
Depolama serisi ve karşılaştırma tabanı
Avrupa Birliği depolama okumaları aşağıda tarihleriyle verilmektedir. Beş yıllık mevsim karşılaştırma tabanı kaynaklara göre %82 ile %88 arasında değişmekte, her okuma yayımlayan kaynağın kullandığı tabanla birlikte yazılmaktadır.
Tarih
Okuma
Kaynağın belirttiği taban
Kaynak
01.04.2026 (kış sonu)
%28
beş yıl ortalaması %41
EIA, 28.04.2026; ACER, 07.07.2026
02.07.2026
yaklaşık %49
on yıl ortalamasının ve 2025'in altında
ACER, 07.07.2026
01.08.2026
%57,1
o takvim günü için kayıtlardaki en düşük
Euronews, 20.08.2026
15.08.2026
%60,8
önceki yılların altında
GIE; S&P Global aktarımı, 17.08.2026
04.09.2026
yaklaşık %62
beş yıl mevsim ortalamasının altında
Reuters, 04.09.2026
06.09.2026
%66,59
taban belirtilmemiş
AGSI+ türevi okuma
13.09.2026, 06:00 CEST
%68,04 — 769,87 TWh
beş yıllık taban kaynaklara göre %82-%88; fark %82 tabanında 13,96 puan, %88 tabanında 19,96 puandır
GIE AGSI+
Eylül ortası 2026 (kesim tarihi belirtilmemiş)
%65
ortalama %82
ABN AMRO, Gas Market Strategist
Almanya, Eylül başı 2026
yaklaşık %53; 15 yıllık kayıtta o tarih için en düşük
bir yıl önce yaklaşık %71
INES, 08.09.2026
Almanya, Eylül ortası 2026
yaklaşık %55 — yaklaşık 136 TWh
rezerve kapasite yaklaşık %83
INES ve basın aktarımları
Aynı haftaya ilişkin iki okuma farklıdır: kesim tarihini belirtmeyen ABN AMRO notunda %65, 13 Eylül tarihli AGSI+ okumasında %68,04. Yaklaşık üç puanlık fark yayımlanmış bir seride uzlaştırılmamıştır.
Avrupa Birliği doldurma hedefi %90 olup 1 Ekim ile 1 Aralık arasında herhangi bir tarihte sağlanabilmekte, zor piyasa koşullarında 10 puana kadar sapmaya izin verilmektedir; rejim 31.12.2027'ye uzatılmıştır (Avrupa Parlamentosu ve Konsey belgeleri). Aynı 07.07.2026 tarihli değerlendirme, %90 hedefinin sağlanması için Avrupa Birliği LNG ithalatının 2025 düzeyinin yaklaşık %13 üzerine çıkmasının gerektiğini, %80 düzeyinin ise 2025 ithalat hacimleriyle ulaşılabilir olduğunu bildirmiştir. Almanya için Initiative Energien Speichern, 1 Kasım'da teknik olarak yaklaşık %77 doluluğa ulaşılabileceğini, aşırı soğuk bir kışta tekil Ocak günlerinde açığın günlük talebin %25'ini aştığını hesaplamaktadır.
Dört kurumun dördüncü çeyrek tahmini
Dört kurum dördüncü çeyrek tahmini yayımlamıştır. Atıflar kurum adı ve unvan ile verilmekte, kişi adları yazılmamaktadır.
Kurum
Tahmin
Tarih
ABN AMRO (kıdemli enerji ekonomisti)
Hürmüz açılırsa dördüncü çeyrekte 45-50 EUR/MWh; kapalı kalırsa 70-80 EUR/MWh
yayın tarihi doğrulanamadı
Oxford Economics (ekonomist)
2026 dördüncü çeyreği ile 2027 birinci çeyreği ortalaması yaklaşık 60 EUR/MWh; avro alanı manşet enflasyonu 2026'nın ikinci yarısında %3,5, temel senaryoda %3
20.08.2026
Citigroup
Olasılık ağırlıklı kış tahmini 61 EUR/MWh; piyasa fiyatlaması Ekim için 72,90, Kasım-Mart için 70,90 EUR/MWh
06.09.2026
Rabobank (enerji stratejisti)
2026 dördüncü çeyrek ortalaması 60 EUR/MWh; 2027 temel senaryosu 42 EUR/MWh, altyapı hasarı senaryosunda 50-60 EUR/MWh
08.09.2026
Dört tahminin üçü kış için 60-61 EUR/MWh aralığında, dördüncüsü boğazın durumuna bağlı bir aralık olarak açıklanmıştır. Piyasa ön ay kontratı 14 Eylül'de 84,275 EUR/MWh, 18 Eylül'de 78,80 EUR/MWh olarak değerlendirilmiştir. Kurum tahminleri ile işlem gören ön ay arasındaki fark bu iki tarihte yaklaşık 18 ile 24 EUR/MWh arasındadır.
Elektrik bağlantısı
Kömürün Avrupa üretimindeki payı 2025'te kayıtlardaki en düşük düzeye inmiştir (Ember, European Electricity Review 2026); bu, kömürden gaza geçişle elde edilebilecek marjı daraltmaktadır. Gazın toptan elektrik fiyatını belirlediği saat paylarının üye ülke bazındaki dağılımı ve gerilim dönemlerinde kaydedilen gün öncesi fiyat aralıkları tarihli bir birincil yayına bağlanamamış, izleme noktalarında kaydedilmiştir.
2026 yazında enjeksiyonu yavaşlatan üç etken daha ölçülmüştür: Güney Avrupa sıcak dalgasında artan gazla üretim, Norveç açık deniz bakım duruşları ve Katar LNG teslimatlarındaki gecikmeler (Reuters, 04.09.2026).
Avrasya: boru hattı hacimleri ve bölgenin maruziyeti
Gösterge
Okuma
Kaynak
Gazprom'un Kazakistan, Kırgızistan ve Özbekistan'a sevkiyatı, 2026
yaklaşık %70 artış
Times of Central Asia
Rusya'dan Özbekistan'a gaz sevkiyatı
2025'te 6,48 milyar metreküp (+%15); 2026 için 10 milyar metreküpün üzeri beklenmektedir
IEA; Times of Central Asia
Özbekistan gaz üretimi, 2026 ilk yarı
18,3 milyar metreküp; yıllık %16,4 azalış
Times of Central Asia; Kursiv
Türkiye LNG ithalatı
Ocak-Ekim 2025'te 11,1 milyar metreküp, toplam gaz ithalatının %24,55'i; 2026 öngörüsü 16,6 milyar metreküp (öngörünün yayın tarihi belirtilmemiştir)
S&P Global Commodity Insights
Azerbaycan gaz ihracatı, 2026 ilk yarı
toplam yaklaşık 13 milyar metreküp; Trans Adriyatik Boru Hattı'nın ilk genişlemesi Ocak 2026'da tamamlanmış, yılda 1,2 milyar metreküp eklenmiştir
Caspian News, 21.07.2026
Orta Asya sıvılaştırılmış doğal gaz ithal etmemekte, kapanışa maruziyeti kargo fiyatlaması üzerinden değil boru hattı hacimleri ve iç tarifeler üzerinden kurulmaktadır. Bu maruziyet yayımlanmış bir seride ölçülmemiştir ve burada sayısallaştırılmamıştır.
19 Haziran kaydı
Bu yayın 19 Haziran 2026'da, saat 08:00 damgasıyla "Hormuz Set to Reopen and Brent Drops Below $80: A Gulf De-escalation That Reshapes the Map for Caspian Exporters" başlıklı bir Top Story yayımlamıştır. Yayın günü geçerli ölçüm, 80 doların altında bir Brent fiyatı ve 17 Haziran'da varılan mutabakattır; o kayıt mutabakatı ateşkesi 60 gün uzatan bir düzenleme olarak aktarmıştır. Ateşkes, kayıttan 19 gün sonra, 8 Temmuz'da sona ermiştir. Haziran ayı Kpler sayımında 40 yüklü LNG geçişi taşımaktadır; 2026'nın kayda değer sayı içeren tek ayıdır. Kapanış 20 Haziran'da yeniden başlamış, son yüklü LNG geçişi 11 Temmuz'da kaydedilmiş, IRGC Donanması beyanı 12 Temmuz'da gelmiştir. Brent 17 Eylül 2026'da 104,82 dolar/varil kapanmıştır (piyasa derlemesi; tarihli birincil yayın belirlenememiştir).
20 Haziran'dan sonra boğazın durumuna ilişkin ayrı bir takip yazısı yayımlanmamıştır. Kapanışın sonuçları iki kayıtta işlenmiştir: 30 Temmuz 2026 tarihli Weekly Insight #13, kapanışın küresel LNG arzının yaklaşık beşte birini piyasa dışında bıraktığını kaydetmiştir; 3 Ağustos 2026 tarihli Kirkuk-Ceyhan Top Story'si, Irak petrol sevkiyatının %80'den fazla düştüğünü ve aylık gelirlerin yaklaşık 6 milyar dolardan 2 milyar doların altına indiğini kaydetmiştir. Arşivdeki Top Story kayıtlarının ayrı sayfası ve kalıcı bağlantısı bulunmadığından 19 Haziran kaydına tarih ve başlıkla atıf yapılmaktadır; arşiv kartı özgün başlığını düzeltme notu olmaksızın taşımaktadır.
İzleme noktaları: ölçülemeyenler
Aşağıdaki kalemler tahmin edilmemiş, ölçülemedi olarak kaydedilmiştir.
Kalem
Durum
Günlük geçiş sayısı
Yönteme bağlıdır. Reuters aktarımındaki Kpler verisi 15 Eylül için dört geçiş ve 10 günlük ortalama 18 geçiş göstermekte; Windward 16 Eylül'de 12 geçiş saymakta, bunların üçü AIS sinyali yayımlamaktadır. Fark, vericisi kapalı gemilerin uydu ile tespit edilmesinden doğmaktadır. Tek bir günlük sayı verilememektedir.
Körfez'deki LNG gemisi sayısı
Sayım 21 geminin beklediğini bildirmekte, yanında yayımlanan döküm — 13 balastta, beşi yüklü, dördü rıhtımda — 22'ye toplanmaktadır. Tek bir toplam verilememektedir.
Nisan'daki dört geçişin tarihleri
Yayımlanmamıştır. Enerji Enformasyon İdaresi'nin 1 Mart-24 Nisan aralığı yüklü geçiş kaydetmemekte, Nisan geçişlerinin ay içindeki yeri yayımlanmış bir seride uzlaştırılmamıştır. İki sayım birlikte doğruysa dört geçiş 25-30 Nisan aralığına düşmektedir; bu pencere burada türetilmiştir, yayımlanmış değildir.
Geçiş sayımı ile kargo sayımı
Mart-Haziran arasında kaydedilen 52 yüklü geçiş ile altı ayda kaydedilen 18 Katar kargosu farklı kümeleri ölçmektedir: ilki menşeden bağımsız olarak boğazdan geçen gemileri, ikincisi teslim edilen Katar kargolarını. İkisi yayımlanmış bir seride uzlaştırılmamıştır.
4 Eylül depolama okumasının tutarlılığı
4 Eylül için verilen yaklaşık %62 okuması, 6 Eylül'deki %66,59 okumasına kadar günde 2,3 puanlık bir dolum ima etmektedir; serinin diğer bütün dilimlerinde hız günde 0,06 ile 0,27 puan arasındadır. Okuma yayımlandığı gibi taşınmakta, burada düzeltilmemektedir; iki okumadan hangisinin aykırı olduğu belirlenememiştir.
Çatışma öncesi günlük geçiş tabanı
Günde yaklaşık 125 geçiş rakamı tarihli atıf olmaksızın taşınmaktadır; kaynak paragrafında bu değerin kaynağı yer almamakta ve yayımlanmış bir seriye bağlanamamıştır.
Euro-dolar kur bazı
Sayfada iki kur ima edilmektedir ve ikisi de tarihsizdir: 24 milyar doların 20,7 milyar euroya çevriminde 1,1594 — bu çevrim kaynağın okuması değil burada yapılan aritmetiktir — ve 84,275 euro ile 97,31 dolar eşlemesinin ima ettiği 1,1547. Her ikisinin bazı ve tarihi belirlenememiştir.
Beş yıllık depolama karşılaştırma tabanı
Kaynaklar arasında %82 ile %88 arasında değişmektedir; tek bir taban belirlenememiştir.
35 ve 27 milyar metreküplük değerlerin bazı
Bir aktarımda yıllıklandırılmış baz olarak verilmekte, bu metinde dört aylık dönem okumasıyla tutarlı çıkmaktadır; Uluslararası Enerji Ajansının kendi bazı birincil yayına karşı teyit edilememiştir.
Gaz fiyatlarında yıl başına göre yüzde değişim
İki kaynak 65 EUR düzeyinde (20 Ağustos) yıl başına göre %130, 78,80 EUR düzeyinde (18 Eylül) %143 artış vermektedir; bu değerler 28,26 ve 32,43 EUR/MWh düzeyinde iki farklı yıl başı tabanı ima etmektedir. Tabanlar farklı olduğundan yüzdeler yeniden yayımlanmamıştır.
14 Eylül tarihli 84,275 EUR/MWh okuması
Tek kaynaklıdır. Bağımsız derlemeler yaklaşık 84 EUR düzeyindeki zirveyi Eylül başına, 16 Eylül'ü 77,58-78,03 EUR aralığına koymaktadır; tarih ikinci bir kaynakla teyit edilememiştir.
18 Eylül'e kadarki haftalık değişim
TradingEconomics bu okumayı haftalık %2 düşüş ve altı haftanın ilk haftalık gerilemesi olarak vermektedir. 18 Eylül bacağı gün içi okumadır; 11 Eylül bacağının bazı ve saati yayımlanmamıştır. İki tarih için yayımlanmış bir kaynaktan kapanış çifti belirlenememiş olduğundan haftalık yüzde yukarıdaki fiyat tablosunda taşınmamaktadır.
24 milyar dolarlık gerçekleşmeyen satışın dönemi
Burada, aktaran kaynağa dayanarak çatışmanın ilk altı ayı olarak verilmiştir; QatarEnergy'nin kendi beyanlarıyla ilişkisi doğrulanamamıştır.
Gazın fiyat belirlediği saat payları ve gün öncesi fiyat aralıkları
İtalya, Almanya, Hollanda, İspanya ve Portekiz için saat payları ile gerilim dönemlerindeki İtalya ve Fransa gün öncesi fiyat aralıkları piyasa derlemelerine dayanmakta, tarihli birincil yayın belirlenememiştir.
104,82 dolarlık Brent kapanışı
Piyasa derlemesidir; tarihli birincil yayın belirlenememiştir.
Doldurma hedefinde 5 puanlık ek sapma
İkincil aktarımlarda Komisyon kararıyla kullanılabildiği bildirilmekte, düzenleme metinlerinde madde atfı teyit edilememiştir; gövdede yer verilmemiştir.
ABN AMRO tahmininin yayın tarihi ve %65 okumasının kesim tarihi
Doğrudan erişimle teyit edilememiştir; iki erişim denemesi zaman aşımına uğramıştır.
Katar'ın yeniden yükleme takvimi
Açıklanmamıştır. Dört büyük üreticinin yöneticileri 14 Eylül'de, boğaz açılsa dahi ihracatın normal düzeyine hemen dönmeyeceğini belirtmiş, tarih vermemiştir.
Uluslararası Enerji Ajansının kış projeksiyonu
2026 dördüncü çeyrek Gas Market Report henüz yayımlanmamıştır; Ekim beklenmektedir.
17 Eylül'deki Suudi boru hattı olayı ve Hürmüz dışına yönlendirilen ham petrol hacmi
Birincil kaynaktan doğrulanamamıştır; kaynak sayfası erişim hatası vermiştir.
Avrupa'nın 2026 LNG ithalat gerçekleşmesi
Ölçülememiştir. Eldeki 145 milyon tonluk öngörü Aralık 2025 tarihlidir ve kapanış öncesi varsayımlara dayanmaktadır.
Özbekistan ve Orta Asya'nın doğrudan maruziyeti
Ölçülememiştir; bölge LNG ithal etmemekte, bağ boru hattı ithalatı ve iç tarifeler üzerinden kurulmaktadır.
Metinde ve şekillerde kullanılan kaynaklar: Amerika Birleşik Devletleri Enerji Enformasyon İdaresi, Today in Energy (28.04.2026); Uluslararası Enerji Ajansı, Gas Market Report Q3-2026 ve 07.07.2026 açıklaması; Avrupa Birliği Enerji Düzenleyicileri İşbirliği Ajansı (07.07.2026); Kpler geçiş ve gemi verileri ile 11 Temmuz sonrası LNG geçişlerine ilişkin açıklaması; Euronews (20.08.2026 ve 08.09.2026; Kpler ve Vortexa verileriyle); The National (14.09.2026); Energy Intelligence spot LNG değerlendirmeleri (15.09.2026); Mansfield Energy günlük notu (14.09.2026); Reuters (04.09.2026); 06.09.2026 tarihli Citigroup analizi aktarımı; ABN AMRO Gas Market Strategist; Oxford Economics (20.08.2026); 08.09.2026 tarihli Rabobank değerlendirmesi aktarımı; Initiative Energien Speichern (08.09.2026); Gas Infrastructure Europe, AGSI+ (13.09.2026); S&P Global Commodity Insights (17.08.2026); Timera Energy (26.01.2026); European Gas Hub (13.05.2026); IEEFA European LNG Tracker; depolama düzenlemesine ilişkin Avrupa Komisyonu ve Avrupa Parlamentosu belgeleri; Ember, European Electricity Review 2026; TradingEconomics (18.09.2026); Windward ve GlobalSecurity günlük derlemeleri (16-17.09.2026); Caspian News (21.07.2026); Times of Central Asia ve Kursiv; bu yayının 19 Haziran, 30 Temmuz ve 3 Ağustos 2026 tarihli arşiv kayıtları. Telif hakkı korunan içerik yeniden yayımlanmamaktadır. Değerlendirme UzEnergyNews tarafından yapılmıştır.
WEEKLY INSIGHT #18 · NUCLEAR · FUEL11 September 2026 · 10 min read · EN/TR · Global
The Fuel Behind the Buildout: uranium supply, enrichment capacity and the reactor pipeline
Reactor construction programmes from India to Central Asia depend on three measurable inputs: mine output, conversion and enrichment capacity, and long-term supply contracts. World mine production reached 60,213 tonnes of uranium in 2024 and covered 90 per cent of reactor requirements, against 76 per cent in 2022 (World Nuclear Association, updated 20 January 2026). Kazatomprom reported 25,839 tonnes for 2025 on a 100 per cent basis and guides to 27,500-29,000 tonnes for 2026, below the nominal subsoil-use level it had set for the year; Navoiyuran of Uzbekistan reported 7,000 tonnes against 5,200 the year before. Eighty reactors totalling 87,046 megawatts gross are under construction, and the association's reference case puts 2040 requirements a little above 150,000 tonnes against 68,920 tonnes in 2025. In enrichment, 42.8 per cent of capacity sits with one supplier and 20.3 per cent with a second. This edition sets out the producers, the buyers and the contracts, with the dated schedules on which they depend.
Mine output: the producers and the 2026 guidance
World uranium mine production was 60,213 tonnes of uranium (tU) in 2024, of which Kazakhstan supplied 38.6 per cent, Canada 23.8 per cent and Namibia 12.2 per cent (World Nuclear Association, updated 20 January 2026). Mine output covered 76 per cent of reactor requirements in 2022, 83 per cent in 2023 and 90 per cent in 2024, leaving about 6,700 tU to secondary supply in 2024 on the same basis. No comparable world total has been published for 2025, and the figures below are company statements on their own stated bases rather than a country aggregate.
Kazatomprom produced 25,839 tU in 2025 on a 100 per cent basis — the measure that covers its joint ventures — against 13,519 tU attributable to the company itself (fourth-quarter operations and trading update, 2 February 2026). For 2026 it guides to 27,500-29,000 tU on the 100 per cent basis, unchanged at its 21 August 2026 results, having already cut its nominal subsoil-use level for the year from 32,777 tU to 29,697 tU — about 3,000 tU, or some 5 per cent of world primary supply, the larger part at the Budenovskoye joint venture (World Nuclear News, 22 August 2025). The company states that the guidance depends on sulphuric acid supply; commissioning of its TQZ acid plant has moved to the third quarter of 2027 or the first quarter of 2028, a delay of six to twelve months. First-half 2026 output was 13,291 tU, with inventories of 8,245 tU at 30 June. Cameco produced 21.0 million pounds of U3O8 in 2025 on its own share basis, about 8,077 tU.
Uzbekistan's Navoiyuran reported 7,000 tonnes for 2025 against 5,200 tonnes in 2024, an increase of 35 per cent, on revenue of 1,112 million dollars, a realised price of 69.5 dollars a pound and a total cash cost of 27 dollars (company statement, 13 April 2026). The bulletin expresses these volumes as tonnes of U3O8, while the association carries the same figures as tU in its country profile; the two bases differ by a factor of 0.848 and are not reconciled here. The association's 2024 world table shows Uzbekistan at an estimated 4,000 tU, below the company's own 5,200 tonnes for that year. The Qizilkok deposit entered commercial in-situ recovery production with a fifteen-year life and peak output of 1,200 tonnes a year; Nurlikum Mining — Orano 45 per cent, Navoiyuran 45 per cent, Itochu 10 per cent — is developing South Djengeldi at a first-phase cost of 214 million dollars over three years for an average of about 500 tU a year. A 2022 presidential decree sets a 2030 national target of 7,100 tU against a base of 3,500 tU.
Namibia produced 7,333 tU in 2024 on the association's world table and 8,507 tU on its country profile, which sums Husab at 5,611, Rössing at 2,205 and Langer Heinrich at 691; both figures are published by the association and both are stated here. Ownership of the three mines runs through Chinese entities in each case: Husab through Taurus Minerals, 60 per cent held by a CGN-led vehicle; Rössing 68.6 per cent through a CNNC subsidiary; and Langer Heinrich, operated by Paladin Energy, 25 per cent through CNNC Overseas. Niger's output fell from 2,020 tU in 2022 to 962 tU in 2024; the SOMAÏR operation at Arlit, held 63.4 per cent by Orano and 36.6 per cent by the state holding Sopamin, was nationalised in June 2025, and Orano — which had stated in December 2024 that it lost operational control — filed for ICSID arbitration on 20 January 2025 and obtained a tribunal order halting the sale or transfer of stockpiled uranium.
Conversion and enrichment: capacity, concentration and the sanctions calendar
Enrichment capacity totalled 68,076 thousand separative work units (SWU) a year in 2025 and is projected at 77,784 thousand in 2030 on the association's tabulation of 4 September 2026, an increase of 14.3 per cent. Rosatom holds 42.8 per cent of the 2025 total, Urenco 25.4 per cent, CNNC 20.3 per cent and Orano 11.0 per cent; the CNNC figure is the association's estimate derived from the domestic reactor fleet and is marked as such. On the 2030 projection the shares are 38.3, 23.1, 23.4 and 12.9 per cent respectively, and CNNC accounts for 45.7 per cent of the total capacity added between the two dates. Capacity outside Rosatom is 57.2 per cent of the 2025 total and 61.7 per cent of the 2030 projection.
The announced additions are dated. Orano's Georges Besse II extension adds 2.5 million SWU, about 30 per cent of capacity, for some 1.7 billion euros, with first production in 2028 and full commissioning in 2030. Urenco's capacity is projected 700,000 SWU higher in 2030 than in 2025 on the same tabulation. Centrus had produced more than 1,900 kilograms of high-assay low-enriched uranium (HALEU) by June 2026 under its demonstration contract, and the Department of Energy allocated 900 million dollars in January 2026 for commercial production targeting 12 tonnes a year in 2029; the award was announced on 1 July 2026 at a total value of 1.07 billion dollars including purchase options. Rosatom's GC-9+ centrifuge replacement was completed at Zelenogorsk in July 2025 and began at Seversk in December 2025 for completion in 2027. The United States banned imports of Russian low-enriched uranium from August 2024; the waiver authority expires at the start of 2028 and the ban runs to the end of 2040. In the European Union, all operators of VVER reactors had contracted alternative fuel from non-Russian suppliers by the end of 2025 (Euratom Supply Agency annual report for 2025).
The enrichment price averaged about 200 dollars a SWU at the end of June 2026, against 60 dollars in March 2016 and 92 dollars in March 2022. TradeTech's long-term U3O8 indicator stood at 93 dollars a pound on 31 March 2026 and 95 dollars on 31 May 2026, a level the service reports as equal to its peak of May 2007 to March 2008. Realised sales prices ran below both indicators: Kazatomprom's group average was 65.32 dollars a pound in 2025 and 67.88 in the first half of 2026, and Navoiyuran's was 69.5 dollars in 2025.
The reactor pipeline and the 2040 requirement
Eighty reactors totalling 87,046 megawatts gross are under construction on the association's count of 8 September 2026; the International Energy Agency counts 78 gigawatts across fifteen countries, with half the capacity in China, in its Global Energy Review 2026. The two totals are stated on gross and net bases with different cut-off dates and are not interchangeable. Ten reactors totalling 12.2 gigawatts started construction in 2025, nine of them in China; 3 gigawatts were connected and 3 gigawatts retired, leaving the world total at 420 gigawatts. Reactor uranium requirements were 68,920 tU in 2025. The association's Nuclear Fuel Report of 5 September 2025 puts reference-case requirements a little above 150,000 tU in 2040, with an upper case above 204,000 and a lower case above 107,000, on installed capacity rising from 398 gigawatts in June 2025 to 746 gigawatts in 2040; the report states that existing mines will meet resource exhaustion in the mid-2030s.
Central Asia: two producers without conversion or enrichment
Uzbekistan and Kazakhstan rank among the world's largest uranium producers and both have contracted the fuel for their first reactors from outside; neither has conversion or enrichment capacity, and Kazakhstan's Ulba plant fabricates fuel assemblies without enriching. Uzbekistan's plant in the Farish district of Jizzakh region is configured as two VVER-1000 units and two RITM-200N units of 55 megawatts each, about 2,110 megawatts in total, under a contract capped at 9.5 billion dollars; first concrete for the base plate was poured on 4 June 2026 together with the construction licence, and the schedule runs from the first small modular unit in 2029 to the first large unit in 2033. A fuel supply agreement between Uzatom and Rosatom was concluded in September 2025. On 2 September 2026 a presidential briefing proposed a joint venture with leading foreign engineering companies for project management, technical control and independent expertise; the published text does not name Rosatom, and Uzatom stated on 4 September that the participants and timetable had not been determined. Local content stands at 21 per cent, or 1.9 billion dollars, against a target of at least 30 per cent. In Kazakhstan, a Rosatom-led consortium was selected on 14 June 2025 for the Balkhash plant — two VVER-1200 units, 2,400 megawatts, at Ulken — with an intergovernmental agreement in May 2026 and an engineering, procurement and construction contract signed on 3 September 2026 at the Eastern Economic Forum in Vladivostok; construction is to begin in 2027 and commissioning is stated for the middle of the 2030s, and CNNC has been named preferred contractor for a second plant. In Türkiye, the four Akkuyu units of 4,800 megawatts are under construction, with a 2025 uranium requirement of 620 tU on the association's reactor table; 163 dummy fuel assemblies were loaded into the first unit as a full rehearsal of fuel loading, with completion reported on 9 June 2026.
Buyers, contracts and the timing difference
Deliveries of natural uranium to European Union utilities totalled 14,678 tU in 2025, of which 15.98 per cent — 2,346 tU — was of Russian origin, with four countries supplying more than 83 per cent of the total; Tenex held about 23 per cent of enrichment-service deliveries and about 24 per cent of conversion. United States utilities purchased 46.9 million pounds of U3O8 equivalent, 16 per cent below 2024, with Canada at 32 per cent and Kazakhstan at 28 per cent, and sent 63 per cent of their natural uranium feed to enrichers outside the country. The two markets are compared in the table below, on the delivery basis for the European Union and the purchase basis for the United States.
Russian share about 24%; 7,908 tU converted under separate contracts (60% of service deliveries)
—
Policy status
all EU VVER operators contracted non-Russian fuel by end-2025
Russian LEU imports banned from August 2024; waiver authority expires at the start of 2028; ban runs to end-2040
On the contracting side, Kazatomprom's extraordinary general meeting approved in April 2026 a long-term supply to the Directorate of Purchase and Stores of India's Department of Atomic Energy, valued above 4 billion dollars; the transaction exceeded half the company's book value and therefore required a shareholder vote, which carried with 92.9 per cent of votes cast. India also signed a nine-year agreement with Cameco on 2 March 2026 for about 22 million pounds of U3O8 over 2027-2035, worth some 2.6 billion Canadian dollars. A framework with Uzbekistan was reported on 30 August 2026 without a signed contract, and the existing Uzbek long-term agreement expires in 2026. Cameco's total long-term commitment portfolio stood at about 230 million pounds at the end of 2025. The dated schedules behind these volumes are set out in the table below. Enrichment capacity is projected 14.3 per cent higher in 2030 than in 2025; the reference-case uranium requirement is stated for 2040; the individual plant and mine milestones fall between 2027 and 2033. The capacity projection and the requirement projection carry different end years and different scopes and are not compared here.
Milestone
Date
Kazatomprom TQZ sulphuric acid plant
Q3 2027 - Q1 2028
Balkhash construction start
2027
Orano Georges Besse II first production / full commissioning
2028 / 2030
Centrus commercial HALEU, 12 t/yr
2029
Uzbekistan NPP, first small modular unit
2029
Uzbekistan NPP, first VVER-1000
2033
Enrichment capacity projection
2030 (+14.3% on 2025)
Reference-case uranium requirement above 150,000 tU
2040
Sources cited in text and figures: World Nuclear Association — World Uranium Mining Production (20 January 2026), Uranium Enrichment (4 September 2026), World Nuclear Power Reactors and Uranium Requirements (8 September 2026), Uranium in Uzbekistan (11 June 2026), Uranium in Namibia (21 January 2026) and the Nuclear Fuel Report 2025 press statement (5 September 2025); Kazatomprom fourth-quarter 2025 operations and trading update (2 February 2026) and first-half 2026 results (21 August 2026); Navoiyuran full-year 2025 preliminary results (13 April 2026); Cameco fourth-quarter 2025 results (13 February 2026) and India supply agreement release (2 March 2026); Centrus Energy releases on the Department of Energy HALEU award (5 January 2026 and 1 July 2026); Orano statements on Georges Besse II and on the Niger arbitration (20 January 2025); Euratom Supply Agency annual report for 2025; United States Energy Information Administration, Uranium Marketing Annual Report 2025; International Energy Agency, Global Energy Review 2026 — Nuclear; IAEA Power Reactor Information System; TradeTech monthly price indicators; World Nuclear News (22 August 2025; 11 August 2026; 1 September 2026; 3 September 2026); NucNet (10 June 2026); Anadolu Agency (9 June 2026); American Nuclear Society; president.uz (2 September 2026), gazeta.uz, spot.uz and Interfax. Copyrighted material is not reproduced. Analysis by UzEnergyNews.
Yapım Programının Yakıtı: uranyum arzı, zenginleştirme kapasitesi ve reaktör hattı
Hindistan'dan Orta Asya'ya uzanan reaktör inşa programları ölçülebilir üç girdiye dayanmaktadır: maden üretimi, dönüşüm ve zenginleştirme kapasitesi, uzun vadeli tedarik sözleşmeleri. Dünya maden üretimi 2024'te 60.213 ton uranyuma ulaşmış ve reaktör ihtiyacının %90'ını karşılamıştır; aynı oran 2022'de %76'dır (World Nuclear Association, 20.01.2026 güncellemesi). Kazatomprom 2025 için %100 bazında 25.839 ton açıklamış, 2026 için 27.500-29.000 ton kılavuzu vermiştir; kılavuz, şirketin yıl için belirlediği nominal maden hakkı seviyesinin altındadır. Özbekistan'ın Navoiyuran şirketi 2025 için 7.000 ton bildirmiştir, 2024 rakamı 5.200 tondur. İnşa halinde 80 ünite ve 87.046 MW brüt kapasite bulunmakta, birliğin referans senaryosu 2040 ihtiyacını 150.000 tonun biraz üzerine koymaktadır; 2025 ihtiyacı 68.920 tondur. Zenginleştirme halkasında kapasitenin %42,8'i tek bir tedarikçide, %20,3'ü ikinci bir tedarikçidedir. Bu sayıda üreticiler, alıcılar ve sözleşmeler, bağlı oldukları tarihli takvimlerle birlikte verilmektedir.
Maden üretimi: üreticiler ve 2026 kılavuzu
Dünya uranyum maden üretimi 2024'te 60.213 tU olmuş; bunun %38,6'sını Kazakistan, %23,8'ini Kanada, %12,2'sini Namibya sağlamıştır (World Nuclear Association, 20.01.2026). Maden üretimi reaktör ihtiyacının 2022'de %76'sını, 2023'te %83'ünü, 2024'te %90'ını karşılamış; aynı baza göre 2024'te yaklaşık 6.700 ton ikincil arza kalmıştır. 2025 için karşılaştırılabilir bir dünya toplamı yayımlanmamıştır; aşağıdaki rakamlar ülke toplamı değil, şirketlerin kendi belirttikleri bazlardaki beyanlarıdır.
Kazatomprom 2025'te %100 bazında — ortak girişimleri kapsayan ölçüde — 25.839 tU üretmiştir; şirkete atfedilebilir üretim 13.519 tU'dur (dördüncü çeyrek işletme ve ticaret güncellemesi, 02.02.2026). Şirket 2026 için %100 bazında 27.500-29.000 tU kılavuzu vermiş, 21.08.2026 sonuçlarında bunu değiştirmemiş, bundan önce 2026 nominal maden hakkı seviyesini 32.777 tU'dan 29.697 tU'ya indirmiştir; yaklaşık 3.000 tonluk azalış dünya birincil arzının yaklaşık %5'ine karşılık gelmekte, büyük kısmı Budenovskoye ortak girişimine düşmektedir (World Nuclear News, 22.08.2025). Şirket, kılavuzun sülfürik asit tedarikine bağlı olduğunu belirtmektedir; TQZ asit tesisinin devreye alınması 2027 üçüncü çeyreği ile 2028 birinci çeyreğine kaymış, gecikme 6-12 ay olarak açıklanmıştır. 2026'nın ilk yarısında üretim 13.291 tU olmuş, 30 Haziran itibarıyla stok 8.245 tU düzeyindedir. Cameco 2025'te kendi payı bazında 21,0 milyon libre U3O8 — yaklaşık 8.077 tU — üretmiştir.
Özbekistan'ın Navoiyuran şirketi 2025 için 7.000 ton bildirmiştir; 2024 rakamı 5.200 tondur ve artış %35'tir. Aynı beyanda gelir 1.112 milyon dolar, gerçekleşen ortalama fiyat 69,5 dolar/libre, toplam nakit maliyet 27 dolar olarak açıklanmıştır (13.04.2026). Şirket bülteni bu hacimleri U3O8 tonu olarak ifade etmekte, birlik ülke profilinde aynı rakamları tU sütununda taşımaktadır; iki baz arasında 0,848 katsayısı bulunmakta ve burada tek baza indirgenmemektedir. Birliğin 2024 dünya tablosunda Özbekistan tahmini 4.000 tU ile yer almakta, bu değer şirketin aynı yıl için açıkladığı 5.200 tonun altında kalmaktadır. Qizilkok yatağı ticari yerinde çözelti üretimine geçmiş olup ömrü 15 yıl, zirve üretimi yılda 1.200 tondur. Orano %45, Navoiyuran %45, Itochu %10 paylı Nurlikum Mining, Güney Djengeldi sahasını üç yılda 214 milyon dolarlık birinci faz yatırımıyla ortalama yılda yaklaşık 500 tU üretim için geliştirmektedir. 2022 tarihli Cumhurbaşkanlığı kararı 2030 için 3.500 tU tabanına karşılık 7.100 tU ulusal hedef koymaktadır.
Namibya 2024'te birliğin dünya tablosunda 7.333 tU, ülke profilinde 8.507 tU üretim göstermektedir; ülke profili Husab'ı 5.611, Rössing'i 2.205, Langer Heinrich'i 691 ton olarak toplamaktadır ve birlik iki rakamı da yayımladığı için ikisi de burada verilmektedir. Üç madenin sahiplik yapısı da Çin merkezli kuruluşlardan geçmektedir: Husab, %60'ı CGN öncülüğündeki bir yapıda olan Taurus Minerals üzerinden; Rössing %68,6 ile bir CNNC iştiraki üzerinden; işletmeciliğini Paladin Energy'nin yaptığı Langer Heinrich ise %25 ile CNNC Overseas üzerinden. Nijer'in üretimi 2022'de 2.020 tU iken 2024'te 962 tU'ya inmiştir; Arlit'teki SOMAÏR işletmesi — %63,4 Orano, %36,6 devlet holdingi Sopamin — Haziran 2025'te kamulaştırılmış, Aralık 2024'te operasyonel kontrolü kaybettiğini açıklayan Orano 20.01.2025'te ICSID tahkimine başvurmuş ve tahkim heyetinden stoktaki uranyumun satış ve devrini durduran karar almıştır.
Dönüşüm ve zenginleştirme: kapasite, yoğunlaşma ve yaptırım takvimi
Zenginleştirme kapasitesi 2025'te yılda 68.076 bin ayırma iş birimi (SWU), 2030 projeksiyonunda 77.784 bin SWU'dur; artış %14,3'tür (World Nuclear Association, 04.09.2026). 2025 toplamının %42,8'i Rosatom'da, %25,4'ü Urenco'da, %20,3'ü CNNC'de, %11,0'ı Orano'dadır; CNNC rakamı birliğin yurt içi reaktör parkından türettiği tahmindir ve bu şekilde işaretlenmiştir. 2030 projeksiyonunda paylar sırasıyla %38,3, %23,1, %23,4 ve %12,9 olmakta, iki tarih arasındaki kapasite artışının %45,7'si CNNC'den gelmektedir. Rosatom dışındaki kapasite 2025 toplamının %57,2'si, 2030 projeksiyonunun %61,7'sidir.
Açıklanan kapasite ilaveleri tarihlidir. Orano'nun Georges Besse II genişlemesi 2,5 milyon SWU — kapasitede yaklaşık %30 artış — eklemekte, yaklaşık 1,7 milyar euro tutmakta, ilk üretimi 2028'e, tam devreye alınmayı 2030'a bağlamaktadır. Urenco'nun kapasitesi aynı tabloda 2030'da 2025'e göre 700.000 SWU daha yüksek projekte edilmektedir. Centrus, gösterim sözleşmesi kapsamında Haziran 2026'ya kadar 1.900 kilogramın üzerinde yüksek tahlilli düşük zenginleştirilmiş uranyum (HALEU) üretmiştir; Amerika Birleşik Devletleri Enerji Bakanlığı Ocak 2026'da ticari HALEU üretimi için 900 milyon dolar tahsis etmiş, hedef 2029'da yılda 12 ton olarak konmuş, 01.07.2026'da duyurulan sözleşmenin toplam değeri alım opsiyonlarıyla birlikte 1,07 milyar dolar olarak açıklanmıştır. Rosatom'un GC-9+ santrifüj yenilemesi Zelenogorsk'ta Temmuz 2025'te tamamlanmış, Seversk'te Aralık 2025'te başlamış, bitişi 2027'ye konmuştur. Amerika Birleşik Devletleri, Rus menşeli düşük zenginleştirilmiş uranyum ithalatını Ağustos 2024'ten itibaren yasaklamıştır; muafiyet yetkisi 2028 başında sona ermekte, yasağın kendisi 2040 sonuna kadar sürmektedir. Avrupa Birliğinde VVER reaktörü işleten kuruluşların tamamı 2025 sonu itibarıyla Rus olmayan tedarikçilerle yakıt sözleşmesi bağlamıştır (Euratom Supply Agency 2025 yıllık raporu).
Zenginleştirme fiyatı Haziran 2026 sonunda ortalama 200 dolar/SWU düzeyindedir; aynı gösterge Mart 2016'da 60 dolar, Mart 2022'de 92 dolardır. TradeTech'in uzun vadeli U3O8 göstergesi 31.03.2026'da 93 dolar/libre, 31.05.2026'da 95 dolar/libredir; kuruluş bu düzeyi Mayıs 2007-Mart 2008 zirvesine eşit olarak bildirmektedir. Gerçekleşen satış fiyatları iki göstergenin de altında seyretmiştir: Kazatomprom Grup ortalaması 2025'te 65,32 dolar/libre, 2026'nın ilk yarısında 67,88 dolar; Navoiyuran'ın 2025 ortalaması 69,5 dolardır.
Reaktör hattı ve 2040 ihtiyacı
Birliğin 08.09.2026 sayımına göre inşa halinde 80 ünite ve 87.046 MW brüt kapasite bulunmaktadır; Uluslararası Enerji Ajansı Global Energy Review 2026'da 15 ülkede 78 GW saymakta ve kapasitenin yarısını Çin'e koymaktadır. İki toplam brüt ve net bazlarda, farklı kesim tarihleriyle açıklanmıştır ve birbirinin yerine kullanılamaz. 2025'te toplam 12,2 GW gücünde 10 reaktörün inşasına başlanmış, bunların dokuzu Çin'dedir; 3 GW şebekeye alınmış, 3 GW emekliye ayrılmış, dünya toplamı 420 GW'ta kalmıştır. Reaktörlerin 2025 uranyum ihtiyacı 68.920 tU'dur. Birliğin 05.09.2025 tarihli Nuclear Fuel Report çalışması 2040 ihtiyacını referans senaryoda 150.000 tonun biraz üzerine, üst senaryoda 204.000 tonun, alt senaryoda 107.000 tonun üzerine koymakta; kurulu gücü Haziran 2025'teki 398 GW'tan 2040'ta 746 GW'a çıkarmakta ve mevcut madenlerin 2030'ların ortasında kaynak tükenmesiyle karşılaşacağını belirtmektedir.
Orta Asya: dönüşüm ve zenginleştirme tesisi olmayan iki üretici
Özbekistan ve Kazakistan dünyanın en büyük uranyum üreticileri arasında yer almakta, ilk reaktörlerinin yakıtını ise dışarıdan sözleşmeye bağlamış bulunmaktadır; iki ülkede de dönüşüm veya zenginleştirme kapasitesi yoktur, Kazakistan'daki Ulba tesisi zenginleştirme yapmadan yakıt demeti üretmektedir. Özbekistan'ın Cizzah bölgesi Farish ilçesindeki santrali iki VVER-1000 ünitesi ile 55'er MW gücünde iki RITM-200N ünitesinden, toplam yaklaşık 2.110 MW'tan oluşmakta, sözleşme azami 9,5 milyar dolarla sınırlanmaktadır; temel plakasına ilk beton 04.06.2026'da inşaat lisansıyla birlikte dökülmüş, takvim ilk küçük modüler ünite için 2029'u, ilk büyük ünite için 2033'ü göstermektedir. Uzatom ile Rosatom arasındaki yakıt tedarik anlaşması Eylül 2025'te yapılmıştır. 02.09.2026 tarihli Cumhurbaşkanlığı sunumunda proje yönetimi, teknik kontrol ve bağımsız ekspertiz için önde gelen yabancı mühendislik şirketlerinin katılımıyla bir ortak girişim önerilmiş; yayımlanan metinde Rosatom adı geçmemiş, Uzatom 4 Eylül'de ortak mühendislik şirketinin katılımcılarının ve takviminin belirlenmediğini belirtmiştir. Yerli içerik %21 — 1,9 milyar dolar — düzeyinde olup hedef en az %30'dur. Kazakistan'da Balkhash santrali için — Ulken'de iki VVER-1200 ünitesi, 2.400 MW — Rosatom liderliğindeki konsorsiyum 14.06.2025'te seçilmiş, hükümetlerarası anlaşma Mayıs 2026'da imzalanmış, mühendislik, tedarik ve inşaat sözleşmesi 03.09.2026'da Vladivostok'taki Doğu Ekonomi Forumunda imzalanmıştır; inşaatın 2027'de başlaması, devreye alınmanın 2030'ların ortasında yapılması açıklanmıştır. İkinci santral için tercih edilen yüklenici olarak CNNC açıklanmıştır. Türkiye'de Akkuyu'nun 4.800 MW gücündeki dört ünitesi inşa halinde olup birliğin reaktör tablosunda 2025 uranyum ihtiyacı 620 tU'dur; birinci üniteye yakıt yüklemesinin tam provası olarak 163 temsilî yakıt demeti yüklenmiş, yüklemenin tamamlandığı 9 Haziran 2026'da bildirilmiştir.
Alıcılar, sözleşmeler ve takvim farkı
Avrupa Birliğindeki kuruluşlara 2025'te teslim edilen doğal uranyum 14.678 tU olmuş; bunun %15,98'i — 2.346 tU — Rus menşelidir ve dört ülke teslimlerin %83'ünden fazlasını sağlamaktadır. Tenex, zenginleştirme hizmeti teslimlerinin yaklaşık %23'ünü, dönüşümün yaklaşık %24'ünü karşılamıştır. Amerika Birleşik Devletleri'ndeki kuruluşlar 46,9 milyon libre U3O8 eşdeğeri satın almış, bu miktar 2024'ün %16 altında kalmıştır; menşe dağılımında Kanada %32, Kazakistan %28 pay almakta, zenginleştiricilere verilen doğal uranyum beslemesinin %63'ü ülke dışına gitmektedir. İki piyasa aşağıdaki tabloda, Avrupa Birliği için teslim bazında, Amerika Birleşik Devletleri için satın alım bazında karşılaştırılmaktadır.
Gösterge
Avrupa Birliği (Euratom Tedarik Ajansı, teslim edilen)
Amerika Birleşik Devletleri (EIA, satın alınan)
Toplam doğal uranyum
14.678 tU teslim
46,9 mn lb U3O8 eşdeğeri satın alım (yaklaşık 18.040 tU), 2024'e göre −%16
En büyük menşeler
Kanada ve Kazakistan
Kanada %32 · Kazakistan %28 · Avustralya %15 · Özbekistan %7 · ABD %7 · Namibya %4
BDT menşeli pay
%46,81
ayrıca belirtilmemiş
Rus menşeli doğal uranyum
2.346 tU · %15,98
2025 için açıklanmadı
Yoğunlaşma
dört ülke %83'ün, altı ülke %98'in üzerinde
—
Zenginleştirme hizmeti
Orano ve Urenco 8,84 mn SWU · Tenex 2,74 mn · diğer 0,55 mn (Tenex yaklaşık %23)
32 mn lb besleme; %37 yurt içi, %63 yurt dışı zenginleştiriciye
Dönüşüm
Rus payı yaklaşık %24; ayrı sözleşmelerle 7.908 tU dönüştürüldü (hizmet teslimlerinin %60'ı)
—
Politika durumu
AB'deki tüm VVER işletmecileri 2025 sonunda Rus olmayan yakıt sözleşmesi bağladı
Rus LEU ithalatı Ağustos 2024'ten itibaren yasak; muafiyet yetkisi 2028 başında bitiyor; yasak 2040 sonuna kadar
Sözleşme tarafında Kazatomprom olağanüstü genel kurulu, Hindistan Atom Enerjisi Dairesine bağlı Satın Alma ve Stoklar Müdürlüğüne 4 milyar doların üzerinde değerde uzun vadeli tedarik için Nisan 2026'da onay vermiştir; işlem şirketin defter değerinin yarısını aştığı için genel kurul gerekmiş, kullanılan oyların %92,9'uyla kabul edilmiştir. Hindistan ayrıca 02.03.2026'da Cameco ile 2027-2035 dönemi için yaklaşık 22 milyon libre U3O8 kapsayan, yaklaşık 2,6 milyar Kanada doları değerinde dokuz yıllık anlaşma imzalamıştır. Özbekistan ile çerçeve mutabakatı 30.08.2026'da bildirilmiş, sözleşme imzalanmamıştır; mevcut Özbek uzun vadeli sözleşmesi 2026'da sona ermektedir. Cameco'nun toplam uzun vadeli taahhüt portföyü 2025 sonunda yaklaşık 230 milyon libredir. Bu hacimlerin bağlı olduğu tarihli takvimler aşağıdaki tabloda verilmiştir. Zenginleştirme kapasitesi 2030'da 2025'e göre %14,3 daha yüksek projekte edilmekte, uranyum ihtiyacının referans senaryo değeri 2040 için açıklanmakta, tesis ve maden kilometre taşları 2027 ile 2033 arasına düşmektedir. Kapasite projeksiyonu ile ihtiyaç projeksiyonu farklı bitiş yıllarına ve farklı kapsamlara sahiptir ve burada karşılaştırılmamaktadır.
Kilometre taşı
Tarih
Kazatomprom TQZ sülfürik asit tesisi
2027 Ç3 - 2028 Ç1
Balkhash inşaat başlangıcı
2027
Orano Georges Besse II ilk üretim / tam devreye alma
2028 / 2030
Centrus ticari HALEU, yılda 12 t
2029
Özbekistan NGS, ilk küçük modüler ünite
2029
Özbekistan NGS, ilk VVER-1000
2033
Zenginleştirme kapasitesi projeksiyonu
2030 (2025'e göre +%14,3)
Referans senaryo uranyum ihtiyacı 150.000 tU üzeri
2040
Metinde ve şekillerde kullanılan kaynaklar: World Nuclear Association — World Uranium Mining Production (20.01.2026), Uranium Enrichment (04.09.2026), World Nuclear Power Reactors and Uranium Requirements (08.09.2026), Uranium in Uzbekistan (11.06.2026), Uranium in Namibia (21.01.2026), Nuclear Fuel Report 2025 basın açıklaması (05.09.2025); Kazatomprom 2025 dördüncü çeyrek işletme ve ticaret güncellemesi (02.02.2026) ve 2026 ilk yarı sonuçları (21.08.2026); Navoiyuran 2025 tam yıl ön sonuçları (13.04.2026); Cameco 2025 dördüncü çeyrek sonuçları (13.02.2026) ve Hindistan tedarik anlaşması bülteni (02.03.2026); Centrus Energy'nin Amerika Birleşik Devletleri Enerji Bakanlığı HALEU sözleşmesine ilişkin bültenleri (05.01.2026 ve 01.07.2026); Orano'nun Georges Besse II ve Nijer tahkimine ilişkin açıklamaları (20.01.2025); Euratom Supply Agency 2025 yıllık raporu; Amerika Birleşik Devletleri Enerji Enformasyon İdaresi, Uranium Marketing Annual Report 2025; Uluslararası Enerji Ajansı, Global Energy Review 2026 — Nükleer; Uluslararası Atom Enerjisi Ajansı Güç Reaktörü Bilgi Sistemi; TradeTech aylık fiyat göstergeleri; World Nuclear News (22.08.2025; 11.08.2026; 01.09.2026; 03.09.2026); NucNet (10.06.2026); Anadolu Ajansı (09.06.2026); American Nuclear Society; president.uz (02.09.2026), gazeta.uz, spot.uz ve Interfax. Telif hakkı korunan içerik yeniden yayımlanmamaktadır. Değerlendirme UzEnergyNews tarafından yapılmıştır.
WEEKLY INSIGHT #17 · CAPITAL MARKETS · GLOBAL4 September 2026 · 10 min read · EN/TR · Global
Who Finances the Grid? Lenders, sovereigns and the capital that has to reach emerging-market networks
On 2 September, the European Bank for Reconstruction and Development (EBRD) signed a 207-million-dollar loan to Enerjisa Enerji for distribution-grid modernisation in Türkiye, backed by a guarantee under the European Union's European Fund for Sustainable Development Plus (EFSD+) — on the bank's description, the first electricity-distribution project under the programme's Hi-Bar guarantee window. It is one entry in a year of grid lending that also includes a 750-million-dollar World Bank loan to Türkiye's transmission operator TEİAŞ, a World Bank-led lending package of about 561 million dollars for Pakistan's transmission operator, an 80-billion-yen Japanese green loan to India's Power Grid Corporation, and the World Bank's first regional electricity-market programme for Central Asia. The sums sit against stated requirements: global grid investment reaches about 550 billion dollars in 2026 on the International Energy Agency's latest count, the agency puts the 2030 requirement roughly 50 per cent above its earlier measure of about 400 billion, and IRENA's 1.5°C scenario calls for 671 billion a year. Emerging and developing economies outside China receive less than 30 per cent of global energy investment, and their cost of capital runs two to three times advanced-economy levels. This edition sets out who is lending what, on which terms, and through which instruments — loans, guarantees and regulated-asset-base reforms.
The Enerjisa transaction — for the operator of the Başkent, AYEDAŞ and Toroslar distribution regions — carries a seven-year tenor with a Turkish-lira disbursement option, and arrives with a first-loss guarantee layer from the European Union attached. Multilateral money with a guarantee wrapper, aimed at the distribution and transmission networks of emerging markets, is the pattern of the year's ledger. This edition compiles that ledger, the investment-versus-requirement numbers it works against, and the cost-of-capital arithmetic that decides where private capital follows.
The numbers on investment and need
Global grid investment reaches about 550 billion dollars in 2026, up roughly 20 per cent year on year, within total energy investment of 3.4 trillion dollars of which electricity takes about 60 per cent (IEA World Energy Investment 2026, May). The agency's Electricity 2026 report, published in February on an earlier count of about 400 billion, put the 2030 requirement roughly 50 per cent higher; IRENA's January 2026 assessment puts 1.5°C-aligned needs at 671 billion a year. The two 2030 figures come from different institutions and scenarios and are shown separately in the chart; the step from 400 to 550 likewise reflects the IEA's updated count between its February and May publications, not a one-year jump in spending. Emerging and developing economies outside China receive less than 30 per cent of total energy investment and about 20 per cent of power-sector investment (IEA). More than 2,500 gigawatts of projects — renewables, storage and large loads including data centres — sit in connection queues; the IEA estimates 750-900 gigawatts could be unlocked through flexible or curtailable connection agreements and 450-700 gigawatts through grid-enhancing technologies for advanced-stage projects. Prices of key grid equipment, transformers and cables among them, have roughly doubled in five years (IEA Electricity 2026).
The lenders' ledger, October 2025 to September 2026
The year's largest single loan is the World Bank's to TEİAŞ: approved at 748 million dollars in August 2025 — 708 million from the International Bank for Reconstruction and Development (IBRD) plus Clean Technology Fund tranches — and signed at 750 million on 6 October 2025, against Türkiye's stated 28-billion-dollar transmission investment programme to 2035. In Pakistan, the World Bank board approved 375.9 million dollars on 8 July 2026, the first phase of its multiphase engagement with the National Grid Company — formerly NTDC, whose restructuring is itself a component of the project — alongside tranches from the Asian Infrastructure Investment Bank (92.5 million) and the Islamic Development Bank (92.7 million), a lender total of about 561 million for a 500-kilovolt corridor and reactive-power management. In India, the Japan Bank for International Cooperation and Japanese commercial banks signed an 80-billion-yen green loan — about 550 million dollars — on 17 June 2026 for Power Grid Corporation's Khavda-Nagpur high-voltage direct-current link; India's National Electricity Plan for transmission puts requirements at about 109.5 billion dollars to 2032. In Central Asia, the World Bank approved its Regional Electricity Market, Interconnectivity and Trade (REMIT) programme on 22 January 2026: an indicative 1.018-billion-dollar, ten-year engagement whose approved first phase — 143.2 million dollars for Kyrgyzstan, Tajikistan, Uzbekistan and the coordinating dispatch centre CDC Energia — targets cross-border trade of at least 15 terawatt-hours a year and a more-than-tripling of transfer capacity to 16 gigawatts. The distinction between commitment and approval runs through the ledger: Mission 300 for Africa carries pledges above 50 billion dollars, against 15 billion in directly committed project financing plus 4.5 billion in mobilised co-financing as of 16 June 2026, with more than 50 million people connected. Earlier, in May 2025, the World Bank lent 100 million dollars — with 50 million in co-financing — to Uzbekistan's regional distribution operator for 6,000 kilometres of low-voltage lines, 1,200 transformers and 150,000 smart meters. On the guarantee side, the Multilateral Investment Guarantee Agency's cumulative issuance passed 100 billion dollars in April 2026, including guarantees of up to 1.48 billion for a portfolio of up to 23 AMEA Power projects; at COP30 in Belém, the Asian Development Bank, the World Bank and ASEAN announced a power-grid financing initiative of more than 12 billion dollars.
The IEA's Cost of Capital Observatory, in its 2025 update, puts the cost of capital for renewable and storage projects in emerging and developing economies at least twice advanced-economy levels, and for energy projects generally at two to three times, with economy-wide nominal financing costs 700-1,500 basis points above the United States and Europe. In its 2021 survey, financing accounted for about half of the levelised cost of solar in these economies, against 25-30 per cent in advanced markets. The 2025 survey of more than 1,700 projects found expectations split: about a quarter of respondents expected declines, more than half expected further increases. Regulation is one response: Uzbekistan's regulated-asset-base reform — whose first tariff decision took effect in August — is expected to carry a regulated post-tax return of 14-16 per cent, according to the Ministry of Economy and Finance (via Gazeta.uz, 27 August 2026), and the manager of the state-linked UzNIF portfolio argues that tariff liberalisation and full implementation of the regulated-asset-base model are the precondition for international capital to enter.
Operators, tenders and what to watch
Beyond lending, ownership and tendering models move capital into networks. India's Uttar Pradesh has moved two of its four distribution companies toward public-private partnership (2025-26). Uzbekistan's 2024 decree programme aims to transfer the management of regional distribution networks to private operators, with an investment target the government put at 4 billion dollars. The OECD's January 2026 working paper on transmission-grid financing points to competitively tendered independent transmission projects — Brazil's auctions and India's tariff-based competitive bidding — as the model most readily transferable to emerging markets. Watchpoints: the approval of REMIT's next phases; COP31 in Antalya on 9-20 November 2026, against the COP29 pledge of 25 million kilometres of grids and 1,500 gigawatts of storage capacity by 2030; Uzbekistan's full transition to regulated-asset-base tariffs, flagged for 2027-28; and the EFSD+ guarantee pipeline for further distribution transactions.
Sources cited in text and figures: IEA World Energy Investment 2026 (May 2026); IEA Electricity 2026 (February 2026); IRENA (January 2026); IEA Cost of Capital Observatory (2025 update; 2021 survey as noted); EBRD press release (2 September 2026); World Bank press releases (TEİAŞ approval, August 2025; REMIT, 22 January 2026; Uzbekistan distribution, 15 May 2025; Pakistan National Grid Company, 8 July 2026; Mission 300, 16 June 2026); MIGA (9 April 2026); TEİAŞ (6 October 2025); JBIC (17 June 2026); Press Information Bureau of India (National Electricity Plan-Transmission); Gazeta.uz (27 August 2026); gov.uz; OECD, Transmission Grid Financing (January 2026); Global Renewables Alliance (COP30 package, November 2025). Copyrighted material is not reproduced. Analysis by UzEnergyNews.
Şebekeyi Kim Finanse Ediyor? Kreditörler, devletler ve gelişen piyasa şebekelerine ulaşması gereken sermaye
Avrupa İmar ve Kalkınma Bankası (EBRD), 2 Eylül'de Türkiye'de dağıtım şebekesi modernizasyonu için Enerjisa Enerji'ye 207 milyon dolarlık kredi imzaladı; kredi, Avrupa Birliği'nin Sürdürülebilir Kalkınma İçin Avrupa Fonu Artı (EFSD+) garantisiyle destekleniyor — bankanın tanımıyla, programın Hi-Bar garanti penceresi kapsamındaki ilk elektrik dağıtım projesi. Bu, yılın şebeke kredisi defterindeki kalemlerden biri: defterde ayrıca Türkiye'nin iletim işletmecisi TEİAŞ'a 750 milyon dolarlık Dünya Bankası kredisi, Pakistan'ın iletim işletmecisine yaklaşık 561 milyon dolarlık Dünya Bankası öncülüğündeki kredi paketi, Hindistan Power Grid Corporation'a 80 milyar yenlik Japon yeşil kredisi ve Dünya Bankası'nın Orta Asya için ilk bölgesel elektrik piyasası programı yer alıyor. Tutarlar, açıklanmış gereksinimlerin karşısında duruyor: küresel şebeke yatırımı Uluslararası Enerji Ajansı'nın (IEA) güncel sayımıyla 2026'da yaklaşık 550 milyar dolara ulaşıyor; ajans 2030 gereksinimini, yaklaşık 400 milyarlık önceki ölçümünün kabaca yüzde 50 üzerinde veriyor; IRENA'nın 1,5°C senaryosu ise yılda 671 milyar diyor. Çin dışındaki gelişen ekonomiler küresel enerji yatırımının yüzde 30'undan azını alıyor; sermaye maliyetleri gelişmiş ekonomilerin iki-üç katı. Bu sayı, kimin neye, hangi şartla ve hangi araçla — kredi, garanti, düzenlenmiş varlık tabanı reformu — borç verdiğini ortaya koyuyor.
Enerjisa işlemi — Başkent, AYEDAŞ ve Toroslar dağıtım bölgelerinin işletmecisi için — yedi yıl vadeli ve Türk lirası kullandırım seçenekli; Avrupa Birliği'nden ilk-kayıp garanti katmanıyla geliyor. Garanti katmanıyla gelen çok taraflı finansmanın gelişen piyasaların dağıtım ve iletim şebekelerine yönelmesi, yılın defterinde tekrarlanan işlem yapısı. Bu sayı o defteri, karşısında durduğu yatırım-gereksinim rakamlarını ve özel sermayenin nereyi izlediğini belirleyen sermaye maliyeti aritmetiğini derliyor.
Yatırım ve gereksinim rakamları
Küresel şebeke yatırımı 2026'da yıllık yaklaşık yüzde 20 artışla 550 milyar dolara ulaşıyor; toplam enerji yatırımı 3,4 trilyon dolar ve elektriğin payı yaklaşık yüzde 60 (IEA World Energy Investment 2026, Mayıs). Ajansın Şubat'ta, yaklaşık 400 milyarlık önceki sayımla yayımlanan Electricity 2026 raporu 2030 gereksinimini bunun kabaca yüzde 50 üzerinde vermişti; IRENA'nın Ocak 2026 değerlendirmesi 1,5°C uyumlu ihtiyacı yılda 671 milyar olarak koyuyor. İki 2030 rakamı farklı kurum ve senaryolardan geliyor, grafikte ayrı gösteriliyor; 400'den 550'ye adım da harcamada bir yıllık sıçramayı değil, IEA'nın Şubat-Mayıs arasında güncellenen sayımını yansıtıyor. Çin dışındaki gelişen ekonomiler toplam enerji yatırımının yüzde 30'undan azını, elektrik sektörü yatırımının yaklaşık yüzde 20'sini alıyor (IEA). 2.500 gigavattan fazla proje — yenilenebilir, depolama ve veri merkezleri dâhil büyük yükler — bağlantı kuyruğunda; IEA, ileri aşamadaki projeler için 750-900 gigavatın esnek/kesintili bağlantı anlaşmalarıyla, 450-700 gigavatın şebeke güçlendirici teknolojilerle açılabileceğini hesaplıyor. Trafo ve kablo başta olmak üzere kilit şebeke ekipmanı fiyatları beş yılda kabaca ikiye katlandı (IEA Electricity 2026).
Kreditör defteri, Ekim 2025 - Eylül 2026
Yılın en büyük tekil kredisi Dünya Bankası'nın TEİAŞ kredisi: Ağustos 2025'te 748 milyon dolar olarak onaylandı — 708 milyonu Uluslararası İmar ve Kalkınma Bankası'ndan (IBRD), kalanı Temiz Teknoloji Fonu dilimlerinden — ve 6 Ekim 2025'te 750 milyon olarak imzalandı; Türkiye'nin 2035'e kadar açıkladığı iletim yatırım programı 28 milyar dolar. Pakistan'da Dünya Bankası kurulu, 8 Temmuz 2026'da 375,9 milyon doları onayladı — Ulusal Şebeke Şirketi (National Grid Company; eski adıyla NTDC, yeniden yapılandırması projenin bileşenlerinden) ile çok fazlı programın ilk fazı — yanında Asya Altyapı Yatırım Bankası (92,5 milyon) ve İslam Kalkınma Bankası (92,7 milyon) dilimleri; 500 kilovoltluk koridor ve reaktif güç yönetimi için kreditör toplamı yaklaşık 561 milyon. Hindistan'da Japonya Uluslararası İş Birliği Bankası (JBIC) ile Japon ticari bankaları, 17 Haziran 2026'da Power Grid Corporation'ın Khavda-Nagpur yüksek gerilim doğru akım hattı için 80 milyar yenlik — yaklaşık 550 milyon dolar — yeşil krediyi imzaladı; Hindistan'ın iletim için Ulusal Elektrik Planı 2032'ye kadarki gereksinimi yaklaşık 109,5 milyar dolar veriyor. Orta Asya'da Dünya Bankası, 22 Ocak 2026'da Bölgesel Elektrik Piyasası, Enterkonneksiyon ve Ticaret (REMIT) programını onayladı: endikatif 1,018 milyar dolarlık, on yıllık bir program; onaylı ilk fazı — Kırgızistan, Tacikistan, Özbekistan ve koordinasyon dispeçer merkezi CDC Energia için 143,2 milyon dolar — yılda en az 15 teravatsaat sınır ötesi ticaret ve transfer kapasitesinin üç katından fazla artışla 16 gigavata çıkarılması hedefliyor. Taahhüt ile onay ayrımı defterin tamamında geçerli: Afrika için Mission 300, 16 Haziran 2026 itibarıyla 50 milyar doları aşan taahhüde karşılık 15 milyar doğrudan taahhüt edilmiş proje finansmanı + 4,5 milyar mobilize eş-finansman taşıyor; 50 milyondan fazla kişi bağlandı. Daha önce, Mayıs 2025'te Dünya Bankası Özbekistan'ın bölgesel dağıtım işletmecisine 100 milyon dolar — 50 milyon eş-finansmanla — kredi açtı: 6.000 kilometre alçak gerilim hattı, 1.200 trafo, 150.000 akıllı sayaç. Garanti tarafında Çok Taraflı Yatırım Garanti Ajansı'nın (MIGA) kümülatif ihracı Nisan 2026'da 100 milyar doları aştı — 23 projeye kadar bir AMEA Power portföyü için 1,48 milyara varan garantiler dâhil; Belém'deki COP30'da Asya Kalkınma Bankası, Dünya Bankası ve ASEAN 12 milyar doları aşan bir şebeke finansman girişimi duyurdu.
IEA'nın Sermaye Maliyeti Gözlemevi, 2025 güncellemesinde gelişen ekonomilerdeki yenilenebilir ve depolama projelerinin sermaye maliyetini gelişmiş ekonomilerin en az iki katı, enerji projelerini genel olarak iki-üç katı olarak veriyor; ekonomi geneli nominal finansman maliyetleri ABD ve Avrupa'nın 700-1.500 baz puan üzerinde. 2021 anketinde bu ekonomilerde finansman, güneş projelerinin seviyelendirilmiş maliyetinin yaklaşık yarısını oluşturuyordu — gelişmiş piyasalarda yüzde 25-30. 1.700'den fazla projeyi kapsayan 2025 anketinde beklentiler bölünmüş durumda: katılımcıların yaklaşık dörtte biri düşüş, yarısından fazlası artış bekliyor. Regülasyon cevaplardan biri: ilk tarife kararı Ağustos'ta yürürlüğe giren Özbekistan düzenlenmiş varlık tabanı (RAB) reformunun, Ekonomi ve Maliye Bakanlığı'na göre vergi sonrası yüzde 14-16 regüle getiri taşıması bekleniyor (Gazeta.uz, 27 Ağustos 2026); devlet bağlantılı UzNIF portföyünün yöneticisi, tarife serbestleşmesi ile RAB modelinin tam uygulanmasını uluslararası sermayenin girişi için ön koşul olarak niteliyor.
İşletmeciler, ihaleler ve izlenecekler
Kredinin ötesinde, sahiplik ve ihale modelleri de şebekeye sermaye taşıyor. Hindistan'da Uttar Pradesh, dört dağıtım şirketinden ikisini kamu-özel ortaklığına yöneltti (2025-26). Özbekistan'ın 2024 tarihli kararname programı, bölgesel dağıtım şebekelerinin yönetimini özel işletmecilere devretmeyi amaçlıyor; hükümetin açıkladığı yatırım hedefi 4 milyar dolar. OECD'nin Ocak 2026 tarihli iletim şebekesi finansmanı çalışması, rekabetçi ihaleyle verilen bağımsız iletim projelerini — Brezilya ihaleleri ve Hindistan'ın tarife bazlı rekabetçi teklif modeli — gelişen piyasalara en kolay aktarılabilir model olarak gösteriyor. İzleme noktaları: REMIT'in sonraki fazlarının onayı; 9-20 Kasım 2026'da Antalya'daki COP31 — COP29'un 2030'a kadar 25 milyon kilometre şebeke ve 1.500 gigavat depolama kapasitesi taahhüdü karşısında; Özbekistan'ın 2027-28 için işaret edilen tam RAB geçişi; ve EFSD+ garanti hattının sonraki dağıtım işlemleri.
Metinde ve grafiklerde atıf yapılan kaynaklar: IEA World Energy Investment 2026 (Mayıs 2026); IEA Electricity 2026 (Şubat 2026); IRENA (Ocak 2026); IEA Sermaye Maliyeti Gözlemevi (2025 güncellemesi; 2021 anketi belirtildiği yerde); EBRD basın bülteni (2 Eylül 2026); Dünya Bankası basın bültenleri (TEİAŞ onayı, Ağustos 2025; REMIT, 22 Ocak 2026; Özbekistan dağıtım, 15 Mayıs 2025; Pakistan Ulusal Şebeke Şirketi, 8 Temmuz 2026; Mission 300, 16 Haziran 2026); MIGA (9 Nisan 2026); TEİAŞ (6 Ekim 2025); JBIC (17 Haziran 2026); Hindistan Basın Enformasyon Bürosu (Ulusal Elektrik Planı-İletim); Gazeta.uz (27 Ağustos 2026); gov.uz; OECD, Transmission Grid Financing (Ocak 2026); Global Renewables Alliance (COP30 paketi, Kasım 2025). Telif korumalı içerik yeniden üretilmemiştir. Analiz: UzEnergyNews.
WEEKLY INSIGHT #16 · INFRASTRUCTURE · EUROPE23 August 2026 · 10 min read · EN/TR · Europe
Europe's Data-Centre Map Is Being Redrawn: Power Constraints Push New Capacity Toward the Centre and East
In the second quarter of 2026, Europe delivered 685 megawatts of new data-centre capacity — and 252 megawatts of it, 37 per cent, went to the five hub markets of Frankfurt, London, Amsterdam, Paris and Dublin, with secondary and tertiary markets taking the rest (CBRE). In Amsterdam, London and Frankfurt, data centres consumed between 33 and 42 per cent of local electricity demand in 2023, and nearly 80 per cent in Dublin (Ember); reported grid-connection waits in the hub markets run to seven and ten years. A 69-page EY Europe Central study — AI and Energy: The Two-Way Dependency (May 2026; published online 30 June) — maps where growth is going instead: markets with grid headroom, land and low-carbon power, in a 33-country grouping that runs from the Nordics through Poland, Czechia, Romania and Greece to Türkiye, the Caucasus and Central Asia. This season's announcements are concentrated on that map — a fully leased 110-megawatt first phase at Seinäjoki in Finland, a 1.5-gigawatt AI hub opened to investors at Cernavodă in Romania, Microsoft taking the 230-megawatt Narvik campus in Norway — and so are its frictions: Denmark's operator paused new large-load connection agreements in March after its queue reached 60 gigawatts, and Ireland reopened Dublin applications in December for projects that bring their own dispatchable generation. Europe's share of global capacity was above 25 per cent in 2015 and 15 per cent in 2024, with about 12 per cent projected for 2030 — a relative decline: Europe grows about 9 per cent a year while the United States and China grow faster.
CBRE's second-quarter figures, reported on 18-19 August, show Europe delivering 685 megawatts of new data-centre capacity — 352 megawatts in colocation and 333 in self-build — of which 252 megawatts, or 37 per cent, landed in the FLAP-D hubs of Frankfurt, London, Amsterdam, Paris and Dublin; secondary and tertiary markets accounted for the rest. FLAP-D live capacity stood at about 3.8 gigawatts at mid-2026 on DC Byte's count, within a European total CBRE expects to reach 13 gigawatts by the end of the year. The EY Europe Central study published this summer describes the movement as structural and locates the constraint on the electricity side: local consumption shares, connection queues measured in years, with land and permitting on top. This edition sets out the numbers on both sides of the shift.
The constraint in the hubs
On EY's count, the five FLAP-D hubs held about 4.6 gigawatts in early 2025 — over 60 per cent of European capacity on that basis; DC Byte's narrower measure of live capacity puts them at about 3.8 gigawatts. The demand shares: in 2023, data centres consumed between 33 and 42 per cent of local electricity demand in Amsterdam, London and Frankfurt, and nearly 80 per cent in Dublin (Ember). Nationally, Irish data centres passed 22 per cent of electricity demand, from 5 per cent in 2015 (CSO/IEA); EirGrid's projection reaches 31 per cent by 2034. Dublin's connection regime changed in December: EirGrid had indicated in 2022 that new connections in the capital were unlikely before 2028, and the CRU's Large Energy Users Connection Policy of 12 December 2025 superseded its 2021 Direction — applications are open again, but only for projects that bring on-site or nearby dispatchable generation and contract at least 80 per cent of annual demand from new renewable capacity, the regime Weekly Insight #14 recorded as bring-your-own-power. Reported connection waits elsewhere: up to ten years in the United Kingdom and the Netherlands; up to seven in Germany — Amazon has said some of its European connections take up to seven years — and seven in Northern Virginia, the world's largest data-centre market, for comparison; about five in Hungary and about three in Poland on EY's comparison table; reported waits of up to three in Italy, two to three in Finland and about two in Norway. The United Kingdom has re-ordered its queue: connection applications had reached 722 gigawatts before the TMO4+ reform, which released 283 gigawatts of generation and storage projects plus 99 gigawatts of demand connections into the re-ordered process in late 2025.
Where the growth goes
EY's Europe Central grouping spans 33 countries — the Nordics, Poland and the Baltics, Czechia, Slovakia, Hungary, the Balkans, Romania, Greece and Türkiye, and eastward through Ukraine and the Caucasus to Central Asia, Kazakhstan and Uzbekistan included. At the end of 2025 the grouping held about 24 per cent of Europe's data-centre facilities; Poland, the Nordics, Türkiye, Czechia and Romania host about 63 per cent of those facilities, and the region's power mix is about 65 per cent low-carbon (EY). The announcements of recent months cluster in the same geography. In Norway, the Narvik campus announced in July 2025 as Stargate Norway — 230 megawatts with a 290-megawatt expansion option — changed offtaker in April: Nscale and OpenAI did not conclude an offtake agreement, and Microsoft took the capacity; Nscale and Nordkraft formed an operating venture, Nordscale, in July. In Finland, Pure Data Centres launched a 110-megawatt, 1.5-billion-euro first phase at Seinäjoki in July — fully leased at launch, with permits and grid connection in place and a campus potential above 550 megawatts. In Romania, the energy ministry opened expressions of interest on 15 April for the Black Sea AI Gigafactory: up to 4-5 billion euros and 1.5 gigawatts at Cernavodă, a second phase tied to the Doicești small-modular-reactor site, and commissioning targeted from the end of 2028. In Poland, the transmission operator PSE has allocated 1.2 gigawatts of connection capacity for data centres by 2034, within a plan to connect 53 gigawatts of renewables and 3.8 gigawatts of nuclear by the same date. In Greece, reporting this month describes declared investor interest of about 50 billion euros over ten years — 1.4 to 2.2 gigawatts of proposals, of which about 30 per cent hold a connection opinion, on the PwC study the reports cite. In Türkiye, the Turkcell-Google Cloud hyperscale regional data centre in Ankara — 3 billion dollars in total, Google's 2 billion over ten years alongside Turkcell's 1 billion — targets an initial 15 megawatts in 2028, with the Google Cloud region planned to go live in 2028-29 and Turkcell aiming to double its company-wide active capacity to 100 megawatts by 2032; the AI Action Plan in force since 18 August sets national targets of at least 1 gigawatt of AI and data-centre capacity and 10 terawatt-hours a year of low-carbon power purchase agreements by 2030. Connection limits have appeared at the destinations too: Energinet's Danish queue reached 60 gigawatts — about 14 gigawatts of it data centres — against a national peak near 7 gigawatts; the operator abolished first-come-first-served allocation on 1 February 2026 and paused new large-load connection agreements in March.
Measure
FLAP-D hubs
Europe Central (EY's 33-country grouping)
Installed capacity
~4.6 GW early 2025 — over 60% of Europe on EY's basis; ~3.8 GW live (DC Byte)
—
Share of Europe's facilities, end-2025
—
~24%; Poland, the Nordics, Türkiye, Czechia and Romania host ~63% of them (EY)
2035 projections: Denmark ~13%, Norway ~9%, Sweden >8% (EY)
Reported connection waits
Up to 7-10 years
About 2-5 years
Power mix
—
~65% low-carbon (EY)
Q2 2026 new capacity
252 of 685 MW — 37%
Secondary and tertiary markets took the rest (CBRE)
This season's markers
UK reform releases 283 GW + 99 GW demand; Ireland reopens under generation-and-renewables conditions
Narvik 230 MW to Microsoft · Seinäjoki 110 MW fully leased · Cernavodă 1.5 GW EoI · Ankara initial 15 MW (2028) · Greece ~€50bn declared interest · Denmark pauses large loads
The global frame
Global installed data-centre capacity was 60 gigawatts in 2020 and 114 gigawatts in 2025; the IEA base case reproduced by EY reaches 226 gigawatts by 2030 — growth of 13 per cent a year in 2020-25, with about 15 per cent a year assumed to the end of the decade. Europe's share of the global total was above 25 per cent in 2015 and 15 per cent in 2024 on the IEA's figures; EY's series puts 2020 at 22 per cent and projects about 12 per cent for 2030. The decline is relative, not absolute — Europe's capacity grows about 9 per cent a year to 2030 on the same projections; the United States and China grow faster. The IEA's Energy and AI report describes the mechanism that moves the load: training workloads tolerate latency and follow available power and land, while inference workloads sit near users — the same distinction that moves capacity between continents also moves it within Europe.
The siting variables and what to watch
EY's siting comparison scores markets on grid headroom and connection time, land availability, low-carbon supply, cooling climate, labour cost, water stress and connectivity. Its 2035 projections put data centres at about 13 per cent of national electricity demand in Denmark, about 9 per cent in Norway and above 8 per cent in Sweden. The sequence Weekly Insight #14 (5 August 2026) documented for jurisdictions taking this load — a connection queue, a cost-allocation fight and a tariff redesign — is now visible outside the hubs as well: Denmark's paused queue is the largest current example. Watchpoints: whether connection offers are issued under Ireland's December policy; whether the UK reform shortens reported hub waits; Energinet's paused queue and its 14-gigawatt data-centre share; and Türkiye's National AI Compute Strategy, due within six months of the AI Action Plan's publication.
Sources cited in text and figures: CBRE European Q2 2026 data-centre figures as reported by DCD and TNW (18-19 August 2026); EY Europe Central — AI and Energy: The Two-Way Dependency (May 2026; published online 30 June 2026); IEA — Energy and AI (2025) and IEA commentary on Europe's data-centre goals (November 2025); Ember — Grids for Data Centres (June 2025); CSO and IEA on Ireland's national share; EirGrid statements of 2022 and the CRU Large Energy Users Connection Policy (CRU2025236, 12 December 2025); Norton Rose Fulbright and HSF Kramer on the UK TMO4+ reform; Bloomberg (Northern Virginia, August 2024); The Register and Tom's Hardware (Amazon's European connections, February 2026); Nscale/Aker (Stargate Norway, July-August 2025), CNBC (Microsoft takeover, 15 April 2026) and Data Center Knowledge (Nordscale venture; Seinäjoki, July 2026); Energinet connection-queue reporting via TNW and DCD (2026); cursdeguvernare.ro, Balkan Green Energy News, ACTMedia and Energy Industry Review (Black Sea AI Gigafactory, April 2026); Prime East and Montel/Enerdata (PSE allocations); ProtoThema, citing a PwC study (Greece, 7 August 2026); CNBC, DCD and the Presidency's Invest Office (Turkcell-Google Cloud, November 2025). Prior UzEnergyNews reporting: Paying for the New Load (Weekly Insight #14, 5 August 2026); Türkiye's AI Action Plan Enters Into Force (18 August 2026). Copyrighted material is not reproduced. Analysis by UzEnergyNews.
Avrupa'nın Veri Merkezi Haritası Yeniden Çiziliyor: Güç Kısıtları Yeni Kapasiteyi Orta ve Doğu'ya İtiyor
2026'nın ikinci çeyreğinde Avrupa 685 megavat yeni veri merkezi kapasitesi devreye aldı — bunun 252 megavatı, yüzde 37'si, Frankfurt, Londra, Amsterdam, Paris ve Dublin'den oluşan beş merkez pazara gitti; kalanı ikincil ve üçüncül pazarlar aldı (CBRE). Amsterdam, Londra ve Frankfurt'ta veri merkezleri 2023'te yerel elektrik talebinin yüzde 33 ile 42'sini, Dublin'de yüzde 80'e yakınını tüketti (Ember); merkez pazarlarda bildirilen şebeke bağlantısı bekleme süreleri yedi ile on yıla uzanıyor. 69 sayfalık EY Europe Central çalışması — AI and Energy: The Two-Way Dependency (Mayıs 2026; 30 Haziran'da çevrimiçi yayımlandı) — büyümenin bunun yerine nereye gittiğini haritalıyor: İskandinavya'dan Polonya, Çekya, Romanya ve Yunanistan üzerinden Türkiye'ye, Kafkasya'ya ve Orta Asya'ya uzanan 33 ülkelik bir grupta, şebeke boşluğu, arazi ve düşük karbonlu güç sunan pazarlar. Bu sezonun duyuruları o haritada yoğunlaşıyor — Finlandiya Seinäjoki'de tamamı kiralanmış 110 megavatlık birinci faz, Romanya Cernavodă'da yatırımcılara açılan 1,5 gigavatlık yapay zekâ merkezi, Norveç Narvik'te 230 megavatlık kampüsü devralan Microsoft — sürtünmeleri de: Danimarka'nın işletmecisi, kuyruğu 60 gigavata ulaşınca Mart'ta yeni büyük yük bağlantı anlaşmalarını durdurdu; İrlanda ise Dublin başvurularını Aralık'ta yalnız kendi yönetilebilir üretimini getiren projelere yeniden açtı. Avrupa'nın küresel kapasitedeki payı 2015'te yüzde 25'in üzerinde, 2024'te yüzde 15'ti; 2030 için yaklaşık yüzde 12 öngörülüyor — göreli bir düşüş: Avrupa yılda yaklaşık yüzde 9 büyürken Amerika Birleşik Devletleri ve Çin daha hızlı büyüyor.
CBRE'nin 18-19 Ağustos'ta aktarılan ikinci çeyrek rakamları, Avrupa'nın 685 megavat yeni veri merkezi kapasitesi devreye aldığını gösteriyor — 352 megavatı ortak yerleşim (kolokasyon), 333'ü işletmelerin kendi kurduğu tesisler; bunun 252 megavatı, yani yüzde 37'si, Frankfurt, Londra, Amsterdam, Paris ve Dublin'den oluşan FLAP-D merkezlerine gitti; kalanı ikincil ve üçüncül pazarlar aldı. FLAP-D'nin devredeki kapasitesi DC Byte sayımıyla 2026 ortasında yaklaşık 3,8 gigavattı; CBRE, Avrupa toplamının yıl sonunda 13 gigavata ulaşmasını bekliyor. Bu yaz yayımlanan EY Europe Central çalışması hareketi yapısal olarak tanımlıyor ve kısıtı elektrik tarafına yerleştiriyor: yerel tüketim payları, yıllarla ölçülen bağlantı kuyrukları ve bunların üstüne arazi ile izinler. Bu sayı, kaymanın iki tarafındaki sayıları ortaya koyuyor.
Merkezlerdeki kısıt
EY sayımıyla beş FLAP-D merkezi 2025 başında yaklaşık 4,6 gigavat barındırıyordu — o baza göre Avrupa kapasitesinin yüzde 60'ından fazlası; DC Byte'ın yalnız devredeki kapasiteyi sayan daha dar ölçüsü yaklaşık 3,8 gigavat. Talep payları: 2023'te veri merkezleri Amsterdam, Londra ve Frankfurt'ta yerel elektrik talebinin yüzde 33 ile 42'sini, Dublin'de yüzde 80'e yakınını tüketti (Ember). Ülke genelinde İrlanda'da veri merkezleri elektrik talebinin yüzde 22'sini aştı — 2015'te yüzde 5'ti (CSO/IEA); EirGrid projeksiyonu 2034'e kadar yüzde 31'e ulaşıyor. Dublin'in bağlantı rejimi Aralık'ta değişti: EirGrid 2022'de başkentte yeni bağlantıların 2028'den önce olası olmadığını belirtmişti; CRU'nun 12 Aralık 2025 tarihli Büyük Enerji Kullanıcıları Bağlantı Politikası 2021 talimatının yerini aldı — başvurular yeniden açık, ama yalnız sahada veya yakınında yönetilebilir üretim getiren ve yıllık talebinin en az yüzde 80'ini yeni yenilenebilir kapasiteden sözleşmeye bağlayan projeler için; Weekly Insight #14'ün kendi-elektriğini-getir diye kaydettiği rejim. Başka pazarlarda bildirilen bağlantı bekleme süreleri: Birleşik Krallık ve Hollanda'da on yıla kadar; Almanya'da yedi yıla kadar — Amazon, Avrupa'daki bazı bağlantılarının yedi yılı bulduğunu söyledi — ve kıyas için, dünyanın en büyük veri merkezi pazarı Kuzey Virginia'da yedi yıl; EY'nin karşılaştırma tablosunda Macaristan'da yaklaşık beş, Polonya'da yaklaşık üç; İtalya'da üçe kadar, Finlandiya'da iki-üç, Norveç'te yaklaşık iki yıllık bildirimler. Birleşik Krallık kuyruğunu yeniden sıraladı: TMO4+ reformundan önce bağlantı başvuruları 722 gigavata ulaşmıştı; yeniden sıralanan süreç 2025 sonunda 283 gigavatlık üretim ve depolama projesi ile 99 gigavatlık talep bağlantısını sürece aldı.
Büyüme nereye gidiyor
EY'nin Europe Central grubu 33 ülkeyi kapsıyor — İskandinavya, Polonya ve Baltıklar, Çekya, Slovakya, Macaristan, Balkanlar, Romanya, Yunanistan ve Türkiye; doğuya doğru Ukrayna ve Kafkasya üzerinden Orta Asya'ya, Kazakistan ve Özbekistan dâhil. 2025 sonunda grup, Avrupa'daki veri merkezi tesislerinin yaklaşık yüzde 24'ünü barındırıyordu; Polonya, İskandinavya, Türkiye, Çekya ve Romanya bu tesislerin yaklaşık yüzde 63'üne ev sahipliği yapıyor ve bölgenin elektrik karması yaklaşık yüzde 65 düşük karbonlu (EY). Son ayların duyuruları aynı coğrafyada kümeleniyor. Norveç'te, Temmuz 2025'te Stargate Norway adıyla duyurulan Narvik kampüsü — 290 megavatlık genişleme opsiyonuyla 230 megavat — Nisan'da alıcı değiştirdi: Nscale ile OpenAI alım anlaşmasını sonuçlandırmadı ve kapasiteyi Microsoft aldı; Nscale ile Nordkraft, Temmuz'da Nordscale adlı işletme ortaklığını kurdu. Finlandiya'da Pure Data Centres, Temmuz'da Seinäjoki'de 110 megavatlık, 1,5 milyar euroluk birinci fazı başlattı — açılışta tamamı kiralanmış, izinleri ve şebeke bağlantısı hazır, kampüs potansiyeli 550 megavatın üzerinde. Romanya'da enerji bakanlığı 15 Nisan'da Black Sea AI Gigafactory için ilgi beyanlarını açtı: Cernavodă'da 4-5 milyar euroya ve 1,5 gigavata kadar; ikinci faz Doicești küçük modüler reaktör sahasına bağlı, devreye alma hedefi 2028 sonundan itibaren. Polonya'da iletim işletmecisi PSE, 2034'e kadar veri merkezleri için 1,2 gigavatlık bağlantı kapasitesi ayırdı — aynı tarihe kadar 53 gigavat yenilenebilir ve 3,8 gigavat nükleer bağlama planının içinde. Yunanistan'da bu ayki haberler, on yılda yaklaşık 50 milyar euroluk beyan edilmiş yatırımcı ilgisi aktarıyor — haberlerin atıf verdiği PwC çalışmasına göre 1,4 ile 2,2 gigavat arası teklif, yaklaşık yüzde 30'u bağlantı görüşü almış. Türkiye'de Ankara'daki Turkcell-Google Cloud hiper ölçekli bölgesel veri merkezi — toplam 3 milyar dolar; Google'ın on yılda 2 milyarı, Turkcell'in 1 milyarı — 2028'de 15 megavatlık başlangıç kapasitesini hedefliyor; Google Cloud bölgesinin 2028-29'da devreye girmesi planlanıyor ve Turkcell, şirket genelindeki aktif kapasitesini 2032'ye kadar 100 megavata katlamayı amaçlıyor; 18 Ağustos'tan beri yürürlükte olan Yapay Zekâ Eylem Planı, 2030'a kadar en az 1 gigavat yapay zekâ ve veri merkezi kapasitesi ile yılda 10 teravatsaat düşük karbonlu elektrik alım anlaşması ulusal hedeflerini koyuyor. Bağlantı sınırları varış pazarlarında da ortaya çıktı: Energinet'in Danimarka kuyruğu 60 gigavata ulaştı — yaklaşık 14 gigavatı veri merkezi — ülke puant talebi ise 7 gigavat civarında; işletmeci 1 Şubat 2026'da ilk-gelen-ilk-alır tahsisini kaldırdı ve Mart'ta yeni büyük yük bağlantı anlaşmalarını durdurdu.
Ölçü
FLAP-D merkezleri
Europe Central (EY'nin 33 ülkelik grubu)
Kurulu kapasite
2025 başında ~4,6 GW — EY bazında Avrupa'nın %60'ından fazlası; devrede ~3,8 GW (DC Byte)
—
Avrupa tesislerindeki pay, 2025 sonu
—
~%24; Polonya, İskandinavya, Türkiye, Çekya ve Romanya bunların ~%63'üne ev sahibi (EY)
2035 projeksiyonları: Danimarka ~%13, Norveç ~%9, İsveç >%8 (EY)
Bildirilen bağlantı beklemeleri
7-10 yıla kadar
Yaklaşık 2-5 yıl
Elektrik karması
—
~%65 düşük karbonlu (EY)
2026 2. çeyrek yeni kapasite
685 MW'ın 252'si — %37
Kalanı ikincil ve üçüncül pazarlar aldı (CBRE)
Bu sezonun işaretleri
BK reformu 283 GW + 99 GW talep bağlantısını sürece aldı; İrlanda üretim-ve-yenilenebilir koşullarıyla yeniden açıldı
Narvik 230 MW Microsoft'a · Seinäjoki 110 MW tamamı kiralı · Cernavodă 1,5 GW ilgi beyanı · Ankara başlangıç 15 MW (2028) · Yunanistan ~50 mlr € beyan edilmiş ilgi · Danimarka büyük yükleri durdurdu
Küresel çerçeve
Küresel kurulu veri merkezi kapasitesi 2020'de 60, 2025'te 114 gigavattı; EY'nin aktardığı IEA baz senaryosu 2030'da 226 gigavata ulaşıyor — 2020-25'te yılda yüzde 13 büyüme, on yılın sonuna kadar yılda yaklaşık yüzde 15 varsayımı. Avrupa'nın küresel toplamdaki payı IEA rakamlarıyla 2015'te yüzde 25'in üzerinde, 2024'te yüzde 15'ti; EY serisi 2020'yi yüzde 22 olarak veriyor ve 2030 için yaklaşık yüzde 12 öngörüyor. Düşüş mutlak değil göreli — aynı projeksiyonlarda Avrupa'nın kapasitesi 2030'a kadar yılda yaklaşık yüzde 9 büyüyor; Amerika Birleşik Devletleri ve Çin daha hızlı büyüyor. IEA'nın Energy and AI raporu yükü taşıyan mekanizmayı tanımlıyor: eğitim iş yükleri gecikmeye tolerans gösteriyor ve uygun güç ile araziyi izliyor; çıkarım iş yükleri ise kullanıcıya yakın duruyor — kapasiteyi kıtalar arasında taşıyan ayrım, Avrupa içinde de taşıyor.
Yerleşim değişkenleri ve izlenecekler
EY'nin yerleşim karşılaştırması pazarları şebeke boşluğu ve bağlantı süresi, arazi, düşük karbonlu arz, soğutma iklimi, iş gücü maliyeti, su stresi ve bağlanabilirlik üzerinden puanlıyor. 2035 projeksiyonları veri merkezlerini Danimarka'da ulusal elektrik talebinin yaklaşık yüzde 13'üne, Norveç'te yaklaşık yüzde 9'una, İsveç'te yüzde 8'in üzerine koyuyor. Weekly Insight #14'ün (5 Ağustos 2026) bu yükü alan ülkeler için belgelediği dizi — bağlantı kuyruğu, maliyet paylaşımı tartışması ve tarife yeniden tasarımı — artık merkezlerin dışında da görünür: Danimarka'nın durdurulan kuyruğu bugünkü en büyük örnek. İzleme noktaları: İrlanda'nın Aralık politikası altında bağlantı tekliflerinin fiilen verilip verilmeyeceği; Birleşik Krallık reformunun merkezlerdeki bildirilen beklemeleri kısaltıp kısaltmayacağı; Energinet'in durdurulan kuyruğu ve içindeki 14 gigavatlık veri merkezi payı; ve Yapay Zekâ Eylem Planı'nın yayımından itibaren altı ay içinde çıkması gereken Türkiye Ulusal Yapay Zekâ İşlem Gücü Stratejisi.
Metinde ve grafiklerde atıf yapılan kaynaklar: CBRE Avrupa 2026 2. çeyrek veri merkezi rakamları (DCD ve TNW aktarımıyla, 18-19 Ağustos 2026); EY Europe Central — AI and Energy: The Two-Way Dependency (Mayıs 2026; 30 Haziran 2026'da çevrimiçi yayımlandı); IEA — Energy and AI (2025) ve IEA'nın Avrupa veri merkezi hedefleri değerlendirmesi (Kasım 2025); Ember — Grids for Data Centres (Haziran 2025); İrlanda ulusal payı için CSO ve IEA; EirGrid'in 2022 açıklamaları ve CRU Büyük Enerji Kullanıcıları Bağlantı Politikası (CRU2025236, 12 Aralık 2025); BK TMO4+ reformu üzerine Norton Rose Fulbright ve HSF Kramer; Bloomberg (Kuzey Virginia, Ağustos 2024); The Register ve Tom's Hardware (Amazon'un Avrupa bağlantıları, Şubat 2026); Nscale/Aker (Stargate Norway, Temmuz-Ağustos 2025), CNBC (Microsoft devralması, 15 Nisan 2026) ve Data Center Knowledge (Nordscale ortaklığı; Seinäjoki, Temmuz 2026); Energinet bağlantı kuyruğu haberleri (TNW ve DCD, 2026); cursdeguvernare.ro, Balkan Green Energy News, ACTMedia ve Energy Industry Review (Black Sea AI Gigafactory, Nisan 2026); Prime East ve Montel/Enerdata (PSE tahsisleri); ProtoThema, bir PwC çalışmasına atıfla (Yunanistan, 7 Ağustos 2026); CNBC, DCD ve Cumhurbaşkanlığı Yatırım Ofisi (Turkcell-Google Cloud, Kasım 2025). Önceki UzEnergyNews yayınları: Paying for the New Load (Weekly Insight #14, 5 Ağustos 2026); Türkiye'nin Yapay Zekâ Eylem Planı Yürürlükte (18 Ağustos 2026). Telif korumalı içerik yeniden üretilmemiştir. Analiz: UzEnergyNews.
WEEKLY INSIGHT #15 · POWER TRANSITION · ASIA15 August 2026 · 10 min read · EN/TR · Asia
China Below 50 Per Cent Coal, India at a Record Renewable Month: The Two Share Milestones of Summer 2026
Within days of each other in late July and early August, the two largest developing power systems reported share milestones. China's National Energy Administration said coal-fired plants generated 2.5 trillion kilowatt-hours in the first half of 2026 — 49.7 per cent of electricity output, the first recorded half-year below one half — while renewable generation exceeded 40 per cent of the mix for the first time. Grid-India data showed July was India's highest renewable generation month on record: 36.25 billion kilowatt-hours, 20.0 per cent of generation on a definition that excludes large hydro, with coal's share at 65.7 per cent, its lowest in twelve months. The two milestones have different mechanics. In China, coal generation grew 3.4 per cent against consumption growth of 5.3 per cent and renewable growth of about 9 — a like-for-like share decline of about 0.9 points. In India, coal generation was 12.8 per cent higher than a year earlier and its share was above last July's; the July share fell from 69 per cent in June as record renewables met a second consecutive month of declining hydro. Neither is a volume exit from coal. This edition sets out both, in charts and one table.
On 30 July, China's National Energy Administration reported that coal-fired plants generated 2.5 trillion kilowatt-hours in the first half of 2026, or 49.7 per cent of the country's electricity output — the first recorded half-year below one half. On 1 August, Grid-India monthly data showed the strongest renewable generation month in India's record: 36.25 billion kilowatt-hours, up 30 per cent year on year, equal to 20.0 per cent of generation on the CEA's definition, which counts solar, wind, biomass and small hydro but not large hydro. The figures measure shares, not volumes: Chinese coal generation grew 3.4 per cent over the half, and India's grew 12.8 per cent in July as heatwave demand peaked. What differs is the arithmetic underneath. In China, clean supply and demand both outgrew coal. In India, the record month coincided with hydro output falling for a second consecutive month, and coal's share — while a twelve-month low — was higher than in July 2025. The distinction between share change and volume change runs through every number that follows.
China: coal at 49.7 per cent in the first half
Electricity consumption in the first half of 2026 was 5,099.9 terawatt-hours, up 5.3 per cent. On the output side, coal accounted for 2.5 trillion kilowatt-hours, or 49.7 per cent of generation. Renewable generation was close to 2 trillion kilowatt-hours, up about 9 per cent, and crossed 40 per cent of output for the first time, at 41.2 per cent; wind and solar together exceeded 1.2 trillion kilowatt-hours, equivalent to about a quarter of consumption. The annual series gives the milestone its scale: on Ember's dataset, coal's share was 69.6 per cent in 2015 and 54.3 per cent in 2025. The half-year figure comes from Chinese official statistics — a different basis, on which the first half of 2025 stood at about 50.6 per cent, making the like-for-like decline about 0.9 points — and a full-year 2026 share above 50 per cent remains possible for seasonal reasons. The 2025 backdrop: clean generation covered the whole of demand growth for the first time, and coal generation fell for the first time since 2015 — by 71 terawatt-hours on Ember's accounting, roughly 90 on Carbon Brief's early estimate. Power-sector CO2 fell 1.5 per cent in 2025; economy-wide emissions were flat or falling for 21 months before rising about 2 per cent in the first quarter of 2026 (CREA). Curtailment: 360 terawatt-hours of wind and solar were curtailed in the first half, up 49 per cent — more than the half's entire increase in consumption, which was about 257 terawatt-hours (CREA/GEM).
China added 315.1 gigawatts of solar and 119.3 gigawatts of wind in 2025 — both records. By June 2026, cumulative wind and solar reached 1.95 terawatts, up 16.8 per cent in a year, within a total fleet of 4.04 terawatts; non-fossil sources are above 60 per cent of installed capacity. The first half of 2026 ran at a different pace: 72.1 gigawatts of solar, down 66 per cent year on year, and 39 gigawatts of wind — 111 gigawatts against roughly 264 in the first half of 2025. Reporting ties the fall to the February 2025 pricing reform, which replaced fixed tariffs with contracts for difference and pulled connections forward ahead of a 1 June 2025 cutoff. The targets have moved regardless: the 1,200-gigawatt wind-and-solar goal for 2030 was passed six years early in 2024, and the NDC announced in September 2025 sets 3,600 gigawatts or more by 2035. Coal capacity: proposals reached a record 161 gigawatts in 2025 and 78 gigawatts was commissioned, a ten-year high; in the first half of 2026, 30 gigawatts entered service against 2.7 retired (CREA/GEM).
India: a record renewable month, with coal generation up 12.8 per cent
July's record is precise: 36.25 billion kilowatt-hours of renewable generation, up 30 per cent year on year, equal to 20.0 per cent of the month's 181.79 billion kilowatt-hours of total generation, which itself grew 10.4 per cent. Coal's share, 65.7 per cent, was the lowest in twelve months, down from 69 per cent in June — while coal generation rose 12.8 per cent from a year earlier and hydro output declined for a second consecutive month on weak rainfall. At 12:05 on 13 July, grid-connected solar and wind output reached 103.7 gigawatts, crossing 100 gigawatts for the first time and supplying 42.79 per cent of grid load at that instant. On the calendar-half measure the IEA uses, solar and wind produced 16.5 per cent of India's electricity in the first half of 2026, from 14.0 per cent a year earlier — solar up 31 per cent, wind up 12 per cent — while demand grew about 6 per cent and peak demand set a record of 270.8 gigawatts on 21 May. Capacity crossed two markers: non-fossil sources reached 300.5 gigawatts on 31 July — more than 54 per cent of the 552-gigawatt fleet, and over 60 per cent of the 500-gigawatt target for 2030 — and the first half's 29 gigawatts of solar and wind additions were a half-year record (solar 26 gigawatts, up 43 per cent, of which 6.4 rooftop under the PM Surya Ghar programme; wind 2.9, down 16 per cent). In 2025, fossil generation fell 3.3 per cent as solar and wind rose to 14 per cent of the mix, and India's solar additions passed the United States' for the first time — 38 against 35 gigawatts AC on Ember's count; Mercom's is 36.6. Coal pipeline: 23.5 gigawatts is under construction and 107.3 in pre-construction; official planning raises coal capacity from 223 to 283 gigawatts by 2031-32. Coal India's output fell 7.5 per cent in April-June as the company ran down about 28 million tonnes of pithead stocks and raised deliveries 3.5 per cent.
Share change and volume change, side by side
The table separates what moved from what it is often read as. In China, the share fell on a rising coal base: plus 3.4 per cent in volume, minus about 0.9 points in like-for-like share. In India, July's coal volume was 12.8 per cent higher than a year earlier and its share was above July 2025's; the twelve-month low is a within-year movement, produced by record renewables and two months of falling hydro. Both systems are adding coal capacity as they add record clean capacity. The global frame: China and India together account for more than a third of world electricity use, and world demand is growing 3.6 per cent this year on the IEA's mid-year update — both countries faster. On the crossing between renewables and coal in the world mix, the two reference datasets differ by scope: Ember's accounting has renewables ahead of coal already in 2025, at 33.9 against 33.0 per cent, while the IEA places the crossing in 2026. Watchpoints: China's full-year coal share and the post-reform additions pace; India's monsoon hydrology and summer coal burn; both countries' coal pipelines.
Measure
China
India
Latest share marker
Coal 49.7% of output · H1 2026 (NEA)
Coal 65.7% of generation · July 2026 (Grid-India)
Coal generation, same period
+3.4% year on year
+12.8% year on year
Like-for-like share change
−0.9 points (H1 2025: 50.6%)
+1.4 points vs July 2025; −3.3 vs June
Solar and wind
>1.2 tn kWh in H1 ≈ a quarter of consumption
16.5% of generation in H1 (IEA)
Demand growth
+5.3% (H1 consumption)
~+6% (H1)
H1 2026 additions
Solar 72.1 + wind 39 GW
Solar 26 + wind 2.9 GW
Capacity marker
Wind+solar 1.95 TW; non-fossil >60% of 4.04 TW
Non-fossil 300.5 GW; 54% of 552 GW
Stated goal
3,600+ GW wind+solar by 2035 (NDC)
500 GW non-fossil by 2030 (60% reached)
Coal build, latest
30 GW added vs 2.7 retired (H1 2026)
23.5 GW building; 107.3 GW pre-construction
Sources cited in text and figures: National Energy Administration press briefing of 30 July 2026, via Xinhua and gov.cn; Global Times/NEA; Ember via Our World in Data, annual dataset (accessed 15 August 2026); CREA/GEM — Built for Backup, Contracted to Run (6 August 2026) and the China coal-power H2 2025 report; Carbon Brief (13 January and 12 February 2026); pv magazine (28 January and 24 July 2026); September 2025 NDC announcement as reported by CSIS and Caixin; Grid-India/CEA July 2026 data as reported by Reuters (SaurEnergy and Business Recorder syndications, 1-2 August 2026); IEA Electricity Mid-Year Update 2026; Ember Global Electricity Review 2026; MNRE/PIB capacity release of 31 July 2026; JMK Research via Down To Earth; Mercom India; Global Energy Monitor — Boom and Bust Coal 2026; CEA National Electricity Plan; Business Standard (5 July 2026). Copyrighted material is not reproduced. Analysis by UzEnergyNews.
Çin'de Kömür İlk Kez Yüzde 50'nin Altında, Hindistan'da Rekor Yenilenebilir Ayı: 2026 Yazının İki Pay Eşiği
Temmuz sonu ile Ağustos başında, birkaç gün arayla, gelişmekte olan dünyanın en büyük iki elektrik sistemi pay eşikleri raporladı. Çin Ulusal Enerji İdaresi, kömür yakıtlı santrallerin 2026'nın ilk yarısında 2,5 trilyon kilovatsaat ürettiğini — elektrik üretiminin yüzde 49,7'si, kayıtlardaki ilk yüzde 50 altı yarıyıl — ve yenilenebilir üretimin ilk kez karmanın yüzde 40'ını aştığını açıkladı. Grid-India verileri ise Temmuz'un Hindistan tarihinin en yüksek yenilenebilir üretim ayı olduğunu gösterdi: 36,25 milyar kilovatsaat, büyük hidroyu dışlayan tanımla üretimin yüzde 20,0'ı; kömürün payı yüzde 65,7 ile on iki ayın en düşüğü. İki eşiğin mekaniği farklı. Çin'de kömür üretimi yüzde 3,4 büyürken tüketim yüzde 5,3, yenilenebilir üretim yaklaşık yüzde 9 büyüdü — benzer-benzere bazda yaklaşık 0,9 puanlık yıllık pay düşüşü. Hindistan'da ise kömür üretimi bir yıl öncesine göre yüzde 12,8 daha yüksekti ve payı geçen Temmuz'un üzerindeydi; Temmuz payı, rekor yenilenebilir üretim üst üste ikinci ay gerileyen hidroyla buluşunca Haziran'daki yüzde 69'dan düştü. İkisi de kömürden hacimsel bir çıkış değil. Bu sayı, iki tabloyu grafiklerle ve tek tabloyla ortaya koyuyor.
Çin Ulusal Enerji İdaresi 30 Temmuz'da, kömür yakıtlı santrallerin 2026'nın ilk yarısında 2,5 trilyon kilovatsaat, yani ülke elektrik üretiminin yüzde 49,7'sini ürettiğini raporladı — kayıtlardaki ilk yüzde 50 altı yarıyıl. Grid-India'nın aylık verileri ise 1 Ağustos'ta, Hindistan tarihinin en güçlü yenilenebilir üretim ayını gösterdi: yıllık yüzde 30 artışla 36,25 milyar kilovatsaat; güneş, rüzgâr, biyokütle ve küçük hidroyu sayan, büyük hidroyu dışlayan CEA tanımıyla üretimin yüzde 20,0'ı. Rakamlar hacmi değil payı ölçüyor: Çin'de kömür üretimi yarıyılda yüzde 3,4, Hindistan'da sıcak hava talebinin zirve yaptığı Temmuz'da yüzde 12,8 büyüdü. Farklı olan, altta yatan aritmetik. Çin'de temiz arz da talep de kömürden hızlı büyüdü. Hindistan'da ise rekor ay, hidro üretiminin üst üste ikinci ay gerilemesiyle çakıştı ve kömürün payı — on iki ayın düşüğü olmakla birlikte — Temmuz 2025'in üzerindeydi. Pay değişimi ile hacim değişimi ayrımı, izleyen her sayının içinden geçiyor.
Çin: ilk yarıda kömür yüzde 49,7
2026'nın ilk yarısında elektrik tüketimi 5.099,9 teravatsaat ile yüzde 5,3 arttı. Üretim tarafında kömür 2,5 trilyon kilovatsaat ile üretimin yüzde 49,7'sini oluşturdu. Yenilenebilir üretim yaklaşık yüzde 9 artışla 2 trilyon kilovatsaate yaklaştı ve yüzde 41,2 ile ilk kez üretimin yüzde 40'ını aştı; rüzgâr ile güneş birlikte 1,2 trilyon kilovatsaati geçti — tüketimin yaklaşık çeyreğine denk. Yıllık seri eşiğe ölçeğini veriyor: Ember veri setinde kömürün payı 2015'te yüzde 69,6, 2025'te yüzde 54,3 idi. Yarıyıl rakamı Çin resmî istatistiğinden geliyor — farklı bir baz; o bazda 2025'in ilk yarısı yaklaşık yüzde 50,6'ydı, yani benzer-benzere düşüş yaklaşık 0,9 puan — ve mevsimsel nedenlerle 2026 tam yıl payının yüzde 50'nin üzerine dönmesi mümkün. 2025 arka planı: temiz üretim ilk kez talep artışının tamamını karşıladı ve kömür üretimi 2015'ten bu yana ilk kez düştü — Ember hesabıyla 71, Carbon Brief'in erken tahminiyle yaklaşık 90 teravatsaat. Elektrik sektörü CO2'si 2025'te yüzde 1,5 azaldı; ekonomi genelinde emisyonlar 21 ay boyunca yatay veya düşüşteydi, 2026'nın ilk çeyreğinde ise yaklaşık yüzde 2 arttı (CREA). Kesinti: ilk yarıda 360 teravatsaat rüzgâr ve güneş üretimi kesildi, yıllık artış yüzde 49 — yarıyılın yaklaşık 257 teravatsaatlik tüketim artışının tamamından fazla (CREA/GEM).
Kapasite eklemeleri: 2025 rekoru, 2026 ilk yarı düşüşü
Çin 2025'te 315,1 gigavat güneş ve 119,3 gigavat rüzgâr ekledi — ikisi de rekor. Haziran 2026 itibarıyla kümülatif rüzgâr ve güneş, bir yılda yüzde 16,8 artışla 1,95 teravata ulaştı; toplam filo 4,04 teravat ve fosil-dışı kaynaklar kurulu gücün yüzde 60'ının üzerinde. 2026'nın ilk yarısı farklı bir tempoda ilerledi: güneşte yıllık yüzde 66 düşüşle 72,1 gigavat, rüzgârda 39 gigavat — 2025'in ilk yarısındaki yaklaşık 264 gigavata karşılık 111 gigavat. Haberler düşüşü, sabit tarifeleri fark sözleşmeleriyle değiştiren ve bağlantıları 1 Haziran 2025 eşiğinden önceye çeken Şubat 2025 fiyat reformuna bağlıyor. Hedefler yine de ilerledi: 2030 için konulan 1.200 gigavatlık rüzgâr-güneş hedefi 2024'te altı yıl erken aşıldı; Eylül 2025'te açıklanan ulusal katkı beyanı 2035'e 3.600 gigavat ve üzerini koyuyor. Kömür kapasitesi: öneriler 2025'te 161 gigavatla rekor kırdı ve 78 gigavat devreye girdi — on yılın en yükseği; 2026'nın ilk yarısında 30 gigavat hizmete girerken 2,7 gigavat emekli edildi (CREA/GEM).
Hindistan: rekor yenilenebilir ayı, yüzde 12,8 artan kömür üretimiyle
Temmuz rekoru net: yıllık yüzde 30 artışla 36,25 milyar kilovatsaat yenilenebilir üretim — ayın kendisi de yüzde 10,4 büyüyen 181,79 milyar kilovatsaatlik toplam üretimin yüzde 20,0'ı. Kömürün payı yüzde 65,7 ile on iki ayın en düşüğüydü, Haziran'daki yüzde 69'dan geriledi — ama kömür üretimi bir yıl öncesine göre yüzde 12,8 arttı ve hidro üretimi zayıf yağışlarla üst üste ikinci ay geriledi. 13 Temmuz'da saat 12.05'te şebekeye bağlı güneş ve rüzgâr çıkışı 103,7 gigavata ulaşarak ilk kez 100 gigavatı aştı ve o anda şebeke yükünün yüzde 42,79'unu karşıladı. IEA'nın kullandığı takvim-yarıyıl ölçüsünde güneş ve rüzgâr, 2026'nın ilk yarısında Hindistan elektriğinin yüzde 16,5'ini üretti — bir yıl önce yüzde 14,0; güneş yüzde 31, rüzgâr yüzde 12 arttı — talep yaklaşık yüzde 6 büyüdü ve zirve talep 21 Mayıs'ta 270,8 gigavatlık rekor kırdı. Kapasite iki eşiği geçti: fosil-dışı kaynaklar 31 Temmuz'da 300,5 gigavata ulaştı — 552 gigavatlık filonun yüzde 54'ünden fazlası ve 2030 için konulan 500 gigavat hedefinin yüzde 60'ından çoğu — ve ilk yarının 29 gigavatlık güneş-rüzgâr eklemesi bir yarıyıl rekoruydu (güneş yüzde 43 artışla 26 gigavat, bunun 6,4'ü PM Surya Ghar programı altındaki çatı üstü; rüzgâr yüzde 16 düşüşle 2,9). 2025'te fosil üretim yüzde 3,3 azalırken güneş ve rüzgâr karmanın yüzde 14'üne çıktı ve Hindistan'ın güneş eklemeleri ilk kez ABD'yi geçti — Ember sayımıyla 38'e karşı 35 gigavat AC; Mercom sayımı 36,6. Kömür boru hattı: 23,5 gigavat inşaatta, 107,3 gigavat inşaat öncesi aşamada; resmî planlama kömür kapasitesini 2031-32'ye kadar 223'ten 283 gigavata çıkarıyor. Coal India'nın üretimi Nisan-Haziran'da yüzde 7,5 düştü; şirket yaklaşık 28 milyon tonluk ocak-başı stoğunu eritti ve sevkiyatı yüzde 3,5 artırdı.
Pay değişimi ile hacim değişimi yan yana
Tablo, hareket edeni sıkça okunduğu şeyden ayırıyor. Çin'de pay, yükselen bir kömür tabanı üzerinde düştü: hacimde artı yüzde 3,4; benzer-benzere payda eksi yaklaşık 0,9 puan. Hindistan'da Temmuz'un kömür hacmi bir yıl öncesinden yüzde 12,8 yüksekti ve payı Temmuz 2025'in üzerindeydi; on iki ayın düşüğü, rekor yenilenebilir üretim ile iki aydır gerileyen hidronun ürettiği yıl-içi bir harekettir. İki sistem de rekor temiz kapasiteyle birlikte kömür kapasitesi eklemeye devam ediyor. Küresel çerçeve: Çin ile Hindistan birlikte dünya elektrik kullanımının üçte birinden fazlasını oluşturuyor ve dünya talebi IEA'nın yıl ortası güncellemesine göre bu yıl yüzde 3,6 büyüyor — iki ülke de bundan hızlı. Dünya karmasında yenilenebilir-kömür geçişinde iki referans veri seti kapsam farkıyla ayrışıyor: Ember muhasebesinde yenilenebilirler 2025'te yüzde 33,9'a karşı 33,0 ile kömürü zaten geçti; IEA geçişi 2026'ya koyuyor. İzleme noktaları: Çin'in tam yıl kömür payı ve reform sonrası ekleme temposu; Hindistan'ın muson hidrolojisi ve yaz kömür yakımı; iki ülkenin kömür boru hatları.
Ölçü
Çin
Hindistan
Son pay eşiği
Kömür, üretimin %49,7'si · H1 2026 (NEA)
Kömür, üretimin %65,7'si · Temmuz 2026 (Grid-India)
2035'e 3.600+ GW rüzgâr+güneş (ulusal katkı beyanı)
2030'a 500 GW fosil-dışı (%60'ı tamam)
Kömür inşası, son dönem
H1 2026: 30 GW devrede, 2,7 GW emekli
23,5 GW inşaatta; 107,3 GW inşaat öncesi
Metinde ve grafiklerde atıf yapılan kaynaklar: Ulusal Enerji İdaresi'nin 30 Temmuz 2026 basın toplantısı (Xinhua ve gov.cn üzerinden); Global Times/NEA; Ember — Our World in Data yıllık veri seti (erişim 15 Ağustos 2026); CREA/GEM — Built for Backup, Contracted to Run (6 Ağustos 2026) ve Çin kömür santralleri H2 2025 raporu; Carbon Brief (13 Ocak ve 12 Şubat 2026); pv magazine (28 Ocak ve 24 Temmuz 2026); Eylül 2025 ulusal katkı beyanı duyurusu (CSIS ve Caixin aktarımıyla); Grid-India/CEA Temmuz 2026 verileri (Reuters; SaurEnergy ve Business Recorder sendikasyonları, 1-2 Ağustos 2026); IEA Elektrik Yıl Ortası Güncellemesi 2026; Ember Küresel Elektrik İncelemesi 2026; MNRE/PIB 31 Temmuz 2026 kapasite açıklaması; JMK Research (Down To Earth aktarımıyla); Mercom India; Global Energy Monitor — Boom and Bust Coal 2026; CEA Ulusal Elektrik Planı; Business Standard (5 Temmuz 2026). Telif korumalı içerik yeniden üretilmemiştir. Analiz: UzEnergyNews.
WEEKLY INSIGHT #14 · TARIFF DESIGN · GLOBAL5 August 2026 · 11 min read · EN/TR · Global
Paying for the New Load: Tariff Design for Hyperscale Demand
Weekly Insight #12 established that grid connection, not chip supply, sets the pace of the artificial-intelligence build-out. This edition takes up the question that follows: who pays. The numbers are no longer hypothetical — PJM's independent market monitor attributes 29.4 billion dollars of capacity cost across the last four auctions, 46 percent of the total, to data-centre load, and household bills are absorbing system costs triggered by customers that did not exist five years ago. In response, a rulebook is forming: Ohio requires large data centres to pay for at least 85 percent of subscribed capacity for up to twelve years whether they use it or not; Virginia's new tariff class demands take-or-pay commitments and collateral of 1.5 million dollars per megawatt; Georgia routes every load above 100 megawatts into a bespoke contract; Texas obliges new large loads to install remote-disconnection equipment. With BloombergNEF projecting data centres at one fifth of US electricity by 2035, the design choices being made now will decide whether the artificial-intelligence build-out is financed by its beneficiaries or by everyone else.
Every previous edition of this column's data-centre coverage ended at the meter: whether the grid can connect the load, and how long the queue is. This one starts there. Once a hyperscale campus is connected, it becomes a participant in a shared cost system built over a century on an assumption that no longer holds — that new load arrives gradually, in small increments, spread across a service territory. A single artificial-intelligence campus now arrives in gigawatt blocks, on timelines measured in quarters, with corporate owners whose market capitalisation exceeds the utility's by more than an order of magnitude. OpenAI's twenty-five-year, 3.2-gigawatt supply agreement with Georgia Power — announced in July for a campus whose investment will exceed 30 billion dollars — is a single contract equal to more than a fifth of Uzbekistan's national peak load. Microsoft expects to spend around 175 billion dollars on capital investment in calendar 2026 — a figure restated from roughly 190 billion after an accounting change, with the spending plan itself unchanged. The question every regulator now faces is not whether this load comes, but who carries the system costs it brings with it.
The bill is already arriving
The clearest documented case remains the PJM Interconnection, the largest wholesale market in the United States. Its capacity auction — the mechanism that pays generators to be available — cleared at 28.92 dollars per megawatt-day for the 2024/25 delivery year and has since cleared at or near the regulatory price cap three times in a row: 329.17 dollars, then 333.44, then 325 for 2028/29, an auction that procured 138,318 megawatts for about 16.4 billion dollars and still fell 6,831 megawatts short of the reliability requirement. PJM's own simulation indicates the last auction would have cleared at 555 dollars without the cap. Attribution is documented rather than inferred: Monitoring Analytics, the market's independent monitor, calculates that data-centre load accounted for 29.4 billion of the 63.6 billion dollars of capacity cost across the last four auctions — 46 percent — including 6.3 billion of the 16.4 billion in the latest one. The pass-through is visible in retail bills: Pepco residential customers in Washington DC have paid about 21 dollars a month more since June 2025, roughly half of it capacity-driven, and analyst estimates — from Synapse Energy Economics at the conservative end to the Natural Resources Defense Council at the high end — put cumulative additional consumer cost across the region at 100 to 163 billion dollars by 2033. This is the political economy that tariff design now has to manage: costs caused disproportionately by one class of customer, socialised through mechanisms built for another era.
Why the old tariff book breaks
Classic rate design socialises network costs because its founding assumptions made that fair: load grew slowly, no single customer moved the system, and assets built for one generation of consumers were reliably used by the next. Hyperscale demand violates each assumption in turn. The loads are lumpy — tens or hundreds of megawatts at a single point — so the network reinforcements they trigger are traceable to specific customers in a way suburban growth never was. The loads are uncertain: BloombergNEF finds developers announce far more than they build, non-hyperscale projects take 8.4 years against 5.3 for the hyperscalers themselves, and speculative or duplicated requests inflate queues everywhere; constrained by the pace at which connections can physically be built, its base case still leaves a 19-gigawatt shortfall by 2035. And the loads are mobile in a way steel mills never were: a campus that faces an unattractive tariff in one state can be resited across a border within a planning cycle, which gives its owners bargaining power no previous industrial customer possessed. The result, if nothing changes, is a familiar asymmetry — if the load materialises, the developer profits; if it does not, the stranded network investment lands in everyone's bills. Tariff design for hyperscale demand is, at bottom, an exercise in reallocating that asymmetry.
The emerging rulebook
Within eighteen months, the outline of a new tariff architecture has appeared across jurisdictions that barely consulted each other, and its instruments are converging. The table summarises the leading cases.
Jurisdiction
Trigger
Core mechanism
Term and security
AEP Ohio (PUCO, Jul 2025)
>25 MW new data centres
Pay for ≥85% of subscribed capacity whether used or not; 4-year ramp
Up to 12 years; exit fee of 3 years of minimum charges; financial assurance
Dominion Virginia GS-5 (SCC; from Jan 2027)
≥25 MW
Take-or-pay: 85% of contracted network capacity, 60% of generation demand
Interconnection standards: tiered study fees of $100,000-$300,000, proof of site control; mandatory remote-disconnection equipment for firm load-shed
Statutory, ERCOT-wide
Ireland (CRU, Dec 2025)
New data centres, nationwide (over 10 MVA)
Bring-your-own-power: on-site generation or storage covering full demand, exportable to the grid
Binding connection condition
European Union (Dec 2025 guidance)
Connection queues generally
First-ready-first-served with maturity criteria, milestones and penalties
Framework, member-state rollout
Singapore (2026)
New data-centre capacity
Capacity allocated by government call rather than open connection
Administrative allocation
Three design instruments recur. Minimum-take obligations — Ohio's 85 percent, Virginia's 85/60 split — convert a speculative load forecast into a bankable revenue stream, so that the customer, not the rate base, carries volume risk. Security instruments — exit fees, collateral at 1.5 million dollars per megawatt, proof of site control — filter serious projects from queue speculation. And operational conditions — Texas's remote-disconnection mandate, Ireland's bring-your-own-power rule, PJM's developing flexible-connection frameworks — price the load's contribution to system stress rather than only its energy. Notably, the direction of travel is not hostile to the industry: Georgia's regime was in place before Georgia Power signed the largest corporate supply deal in its history, and the first contracts under the new rules were highlighted in the utility's own filings as evidence the framework works. Clear allocation of risk, it turns out, is something hyperscale buyers will pay for.
Principles, and why this travels
Underneath the case-by-case detail, the emerging rulebook enforces one principle: cost causation. Whoever triggers a system cost should carry it — with the corollary that a customer who accepts curtailability, brings storage, or firms its own supply should pay less, because it causes less. Getting this right matters in both directions. Tariffs that under-recover socialise the build-out and invite the political backlash already visible in blocked projects and windfall-tax debates; tariffs that over-recover push the load behind the meter entirely — BloombergNEF counts 124 gigawatts of announced on-site gas capacity, just over half of it with a target commissioning date — which strands the network another way and removes the flexibility the system could otherwise have used. The debate is no longer confined to the United States. Any grid that courts hyperscale investment — and governments from the Gulf to Central Asia and Southeast Asia are courting it explicitly — will face the same sequence: a connection queue, a cost-allocation fight, and a tariff redesign. The jurisdictions that write the rulebook before the load arrives will keep both their investors and their household customers; those that improvise afterwards will be arbitrating between them for a decade. The lesson of the PJM numbers is that the meter starts running before the rules are written.
Sources cited in text and figures: PJM Interconnection capacity auction reports for the 2024/25 to 2028/29 delivery years, with auction analysis reported by Utility Dive; Monitoring Analytics, PJM Independent Market Monitor (cost attribution, July 2026); Natural Resources Defense Council; Pepco billing data as reported in regional press; BloombergNEF — US Data Center Capacity Outlook (July 2026); Public Utilities Commission of Ohio order of 9 July 2025 and AEP Ohio settlement (POWER, Vorys, KJK analyses); Virginia State Corporation Commission and Dominion Energy GS-5 tariff filings (SCC fact sheet, February 2026; Forbes, June 2026); Georgia Public Service Commission rule of 23 January 2025 and Georgia Power filings; Texas Senate Bill 6 (2025) and PUCT draft rule 25.194 (Pillsbury, Mayer Brown, Bracewell analyses); Commission for Regulation of Utilities, Ireland (December 2025); European Commission connection guidance and Electrification Action Plan (July 2026); OpenAI-Georgia Power supply agreement (July 2026); Microsoft FY26 fourth-quarter results call. Copyrighted material is not reproduced. Analysis by UzEnergyNews.
Yeni Yükün Bedelini Kim Ödeyecek: Hiperölçek Talep İçin Tarife Tasarımı
Weekly Insight #12, yapay zekâ yatırım dalgasının hızını çip arzının değil şebeke bağlantısının belirlediğini ortaya koymuştu. Bu sayı, onu izleyen soruyu ele almaktadır: bedeli kim ödeyecek. Rakamlar artık varsayımsal değildir — PJM'in bağımsız piyasa izleyicisi, son dört ihaledeki 63,6 milyar dolarlık kapasite maliyetinin 29,4 milyarını, yani yüzde 46'sını veri merkezi yüküne bağlamaktadır ve beş yıl önce var olmayan müşterilerin tetiklediği sistem maliyetleri hane faturalarına yansımaktadır. Karşılık olarak bir kural kitabı şekillenmektedir: Ohio, büyük veri merkezlerinden abone oldukları kapasitenin en az yüzde 85'ini — kullansalar da kullanmasalar da — on iki yıla kadar ödemelerini istemekte; Virginia'nın yeni tarife sınıfı al-ya-da-öde taahhüdü ve megavat başına 1,5 milyon dolar teminat talep etmekte; Georgia 100 megavatın üzerindeki her yükü özel sözleşmeye yönlendirmekte; Teksas yeni büyük yüklere uzaktan kesme ekipmanı zorunluluğu getirmektedir. BloombergNEF veri merkezlerini 2035'te ABD elektriğinin beşte birine taşırken, bugün yapılan tasarım tercihleri yapay zekâ dalgasının kendi faydalanıcıları tarafından mı yoksa herkes tarafından mı finanse edileceğini belirleyecektir.
Bu kolonun veri merkezi kapsamındaki önceki her sayısı sayaçta bitiyordu: şebeke yükü bağlayabilecek mi ve kuyruk ne kadar uzun. Bu sayı oradan başlamaktadır. Hiperölçek bir kampüs bağlandığı anda, bir asırda ve artık geçerli olmayan bir varsayım üzerine kurulmuş ortak maliyet sisteminin katılımcısı hâline gelir: yeni yükün yavaş, küçük artışlarla ve hizmet bölgesine yayılmış biçimde geleceği varsayımı. Bir yapay zekâ kampüsü artık gigavatlık bloklar hâlinde, çeyreklerle ölçülen takvimlerle ve piyasa değeri şebeke şirketininkini bir mertebeden fazla aşan kurumsal sahiplerle gelmektedir. OpenAI'nin Georgia Power ile Temmuz'da duyurulan yirmi beş yıllık, 3,2 gigavatlık tedarik anlaşması — yatırımı 30 milyar doları aşacak bir kampüs için — tek başına Özbekistan'ın ulusal tepe yükünün beşte birinden fazlasına denk tek bir sözleşmedir. Microsoft, 2026 takvim yılında yaklaşık 175 milyar dolarlık yatırım harcaması beklemektedir — rakam, harcama planı değişmeksizin bir muhasebe değişikliği sonrası yaklaşık 190 milyardan güncellenmiştir. Her düzenleyicinin önündeki soru artık bu yükün gelip gelmeyeceği değil, beraberinde getirdiği sistem maliyetlerini kimin taşıyacağıdır.
Fatura çoktan gelmeye başladı
En açık belgelenmiş vaka, Amerika Birleşik Devletleri'nin en büyük toptan piyasası olan PJM Interconnection olmaya devam etmektedir. Üreticilere hazır bulunmaları için ödeme yapan mekanizma olan kapasite ihalesi, 2024/25 teslim yılında 28,92 dolar/MW-gün'den kapanmış; o günden bu yana üç kez üst üste düzenleyici tavandan veya tavana yakın kapanmıştır: 329,17 dolar, ardından 333,44, ardından 2028/29 için 325 — 138.318 megavatı yaklaşık 16,4 milyar dolara temin eden ve buna rağmen güvenilirlik gereğinin 6.831 megavat altında kalan bir ihale. PJM'in kendi benzetimi, son ihalenin tavan olmasaydı 555 dolardan kapanacağını göstermektedir. Sorumluluk ataması çıkarım değil, belgeye dayalıdır: piyasanın bağımsız izleyicisi Monitoring Analytics, son dört ihaledeki 63,6 milyar dolarlık kapasite maliyetinin 29,4 milyarını — yüzde 46 — veri merkezi yüküne bağlamakta; bu tutarın 6,3 milyarı son ihaledeki 16,4 milyarın içindedir. Yansıma perakende faturalarda görünürdür: Washington'daki Pepco mesken aboneleri Haziran 2025'ten bu yana ayda yaklaşık 21 dolar fazla ödemektedir ve bunun kabaca yarısı kapasite kaynaklıdır; analist tahminleri — muhafazakâr uçta Synapse Energy Economics, yüksek uçta Natural Resources Defense Council — bölge genelinde 2033'e kadar kümülatif ek tüketici maliyetini 100-163 milyar dolar aralığına koymaktadır. Tarife tasarımının artık yönetmek zorunda olduğu politik ekonomi budur: bir müşteri sınıfının orantısız biçimde tetiklediği maliyetlerin, başka bir çağ için kurulmuş mekanizmalarla toplumsallaştırılması.
Eski tarife kitabı neden bozuluyor
Klasik tarife tasarımı şebeke maliyetlerini toplumsallaştırır; çünkü kurucu varsayımları bunu adil kılıyordu: yük yavaş büyürdü, tek bir müşteri sistemi hareket ettiremezdi ve bir kuşağın tüketicileri için kurulan varlıklar bir sonraki kuşak tarafından güvenilir biçimde kullanılırdı. Hiperölçek talep bu varsayımların her birini sırayla bozmaktadır. Yükler topaklıdır — tek noktada onlarca veya yüzlerce megavat — dolayısıyla tetikledikleri şebeke güçlendirmeleri, banliyö büyümesinde hiçbir zaman olmadığı kadar belirli müşterilere izlenebilir durumdadır. Yükler belirsizdir: BloombergNEF geliştiricilerin inşa ettiklerinden çok daha fazlasını duyurduğunu, hiperölçekleyici-dışı projelerin hiperölçekleyicilerin 5,3 yılına karşılık 8,4 yıl sürdüğünü ve spekülatif ya da mükerrer başvuruların kuyrukları her yerde şişirdiğini tespit etmektedir; bağlantıların fiziksel olarak kurulabilme hızıyla sınırlı baz senaryosu, 2035'te hâlâ 19 gigavatlık açık bırakmaktadır. Ve yükler, çelik fabrikalarının hiçbir zaman olmadığı kadar hareketlidir: bir eyalette cazip olmayan tarifeyle karşılaşan kampüs, bir planlama döngüsü içinde sınırın ötesine taşınabilir; bu da sahiplerine önceki hiçbir sanayi müşterisinin sahip olmadığı bir pazarlık gücü verir. Hiçbir şey değişmezse sonuç tanıdık bir bakışımsızlıktır: yük gerçekleşirse kazancı geliştirici alır; gerçekleşmezse atıl şebeke yatırımı herkesin faturasına düşer. Hiperölçek talep için tarife tasarımı, özünde bu bakışımsızlığı yeniden paylaştırma çalışmasıdır.
Şekillenen kural kitabı
On sekiz ay içinde, birbirine neredeyse hiç danışmamış yargı bölgelerinde yeni bir tarife mimarisinin ana hatları belirdi ve araçları yakınsamaktadır. Tablo önde gelen vakaları özetlemektedir.
Yargı bölgesi
Eşik
Çekirdek mekanizma
Süre ve güvence
AEP Ohio (PUCO, Tem 2025)
>25 MW yeni veri merkezi
Abone kapasitenin ≥%85'i, kullanılsın kullanılmasın ödenir; 4 yıl kademelenme
12 yıla kadar; çıkış bedeli 3 yıllık asgari ücret; mali güvence
Dominion Virginia GS-5 (SCC; Oca 2027'den itibaren)
≥25 MW
Al-ya-da-öde: sözleşmeli şebeke kapasitesinin %85'i, üretim talebinin %60'ı
14 yıllık sözleşme; MW başına 1,5 mn $ teminat
Georgia PSC (Oca 2025)
≥100 MW
Zorunlu özel sözleşme: asgari fatura, mali garanti, kurul ön onayı; standart tarifeler kapalı
Uzun vadeli, müzakereli
Teksas SB6 (Haz 2025'ten itibaren)
Büyük yükler (75 MW+, yasada tanımlı)
Bağlantı standartları: 100.000-300.000 $ kademeli etüt ücreti, saha kontrolü kanıtı; kesin yük atmada uzaktan kesme ekipmanı zorunluluğu
Yasal, ERCOT genelinde
İrlanda (CRU, Ara 2025)
Yeni veri merkezleri, ülke geneli (10 MVA üzeri)
Kendi gücünü getir: tam talebi karşılayan yerinde üretim veya depolama, şebekeye verilebilir
Bağlayıcı bağlantı koşulu
Avrupa Birliği (Ara 2025 rehberi)
Bağlantı kuyrukları geneli
Önce-hazır-olana: olgunluk kriterleri, kilometre taşları ve cezalar
Çerçeve; üye ülke uygulaması
Singapur (2026)
Yeni veri merkezi kapasitesi
Kapasite açık bağlantı yerine devlet çağrısıyla tahsis edilir
İdari tahsis
Üç tasarım aracı tekrarlanmaktadır. Asgari alım yükümlülükleri — Ohio'nun yüzde 85'i, Virginia'nın 85/60 bölüşümü — spekülatif bir yük tahminini bankalaşabilir bir gelir akışına çevirir; hacim riskini tarife tabanı değil müşteri taşır. Güvence araçları — çıkış bedelleri, megavat başına 1,5 milyon dolarlık teminat, saha kontrolü kanıtı — ciddi projeleri kuyruk spekülasyonundan ayıklar. İşletme koşulları ise — Teksas'ın uzaktan kesme zorunluluğu, İrlanda'nın kendi gücünü getir kuralı, PJM'in geliştirmekte olduğu esnek bağlantı çerçeveleri — yükün yalnızca enerjisini değil, sistem stresine katkısını fiyatlar. Dikkat çekici olan, gidişatın sektöre düşman olmamasıdır: Georgia'nın rejimi, Georgia Power tarihinin en büyük kurumsal tedarik anlaşmasından önce yürürlükteydi ve yeni kurallar altındaki ilk sözleşmeler, çerçevenin çalıştığının kanıtı olarak şirketin kendi başvurularında vurgulandı. Anlaşılan o ki riskin net paylaştırılması, hiperölçek alıcıların bedel ödemeye razı olduğu bir şeydir.
İlkeler ve bu tartışmanın yolculuğu
Vaka ayrıntılarının altında, şekillenen kural kitabı tek bir ilkeyi uygulamaktadır: maliyet nedenselliği. Sistem maliyetini kim tetikliyorsa onu o taşımalıdır — ve doğal sonucu: kesilebilirliği kabul eden, depolama getiren veya kendi arzını sağlamlaştıran müşteri daha az ödemelidir, çünkü daha az maliyete neden olmaktadır. Bunu doğru kurmak iki yönde de önemlidir. Eksik tahsil eden tarifeler yatırım dalgasını toplumsallaştırır ve engellenen projelerle ek vergi tartışmalarında şimdiden görünen siyasi tepkiyi davet eder; fazla tahsil eden tarifeler ise yükü tamamen sayaç arkasına iter — BloombergNEF 124 gigavatlık duyurulmuş saha-içi gaz kapasitesi saymaktadır ve bunun yarıdan biraz fazlasının hedef devreye alma tarihi vardır — bu da şebekeyi başka bir yoldan atıl bırakır ve sistemin kullanabileceği esnekliği ortadan kaldırır. Tartışma artık Amerika Birleşik Devletleri ile sınırlı değildir. Hiperölçek yatırımına talip olan her şebeke — ve Körfez'den Orta Asya'ya ve Güneydoğu Asya'ya kadar hükûmetler buna açıkça taliptir — aynı sırayla karşılaşacaktır: bir bağlantı kuyruğu, bir maliyet paylaşımı kavgası ve bir tarife yeniden tasarımı. Kural kitabını yük gelmeden yazan yargı bölgeleri hem yatırımcılarını hem hane müşterilerini koruyacak; sonradan doğaçlama yapanlar ikisi arasında on yıl hakemlik edecektir. PJM rakamlarının dersi şudur: sayaç, kurallar yazılmadan önce işlemeye başlar.
Metinde ve grafiklerde atıf yapılan kaynaklar: PJM Interconnection 2024/25-2028/29 teslim yılı kapasite ihalesi raporları ve Utility Dive'ın ihale analizleri; Monitoring Analytics, PJM Bağımsız Piyasa İzleyicisi (maliyet ataması, Temmuz 2026); Natural Resources Defense Council; bölgesel basında aktarılan Pepco fatura verileri; BloombergNEF — ABD Veri Merkezi Kapasite Görünümü (Temmuz 2026); Ohio Kamu Hizmetleri Komisyonu'nun 9 Temmuz 2025 kararı ve AEP Ohio uzlaşması (POWER, Vorys, KJK analizleri); Virginia Eyalet Şirketler Komisyonu ve Dominion Energy GS-5 tarife dosyaları (SCC bilgi notu, Şubat 2026; Forbes, Haziran 2026); Georgia Kamu Hizmetleri Komisyonu'nun 23 Ocak 2025 kuralı ve Georgia Power başvuruları; Teksas Senato Yasası 6 (2025) ve PUCT taslak kuralı 25.194 (Pillsbury, Mayer Brown, Bracewell analizleri); İrlanda Enerji Düzenleme Komisyonu (Aralık 2025); Avrupa Komisyonu bağlantı rehberi ve Elektrifikasyon Eylem Planı (Temmuz 2026); OpenAI-Georgia Power tedarik anlaşması (Temmuz 2026); Microsoft 2026 mali yılı dördüncü çeyrek sonuç çağrısı. Telif korumalı içerik yeniden üretilmemiştir. Analiz: UzEnergyNews.
WEEKLY INSIGHT #13 · POWER TRANSITION · GLOBAL30 July 2026 · 10 min read · EN/TR · Global
The World's Power System at Mid-Year: The IEA's 2026 Update in Numbers
The International Energy Agency's Electricity Mid-Year Update, published on 23 July, resets the reference numbers for the world's power system: demand growth revised up to 3.6 percent for 2026 and 3.8 percent for 2027, consumption heading from 28,600 to about 30,700 terawatt-hours, renewables overtaking coal in 2026 after more than half a century of coal at the top, solar adding around 600 terawatt-hours a year, emissions broadly flat while demand accelerates, and a war-driven fuel shock that has split wholesale prices by region — more than 30 percent higher in the European Union and Japan, flat in the United States, about 45 percent lower in Australia. This edition presents the full dataset, in charts and tables.
Twice a year the IEA rebases the numbers every electricity analysis leans on, and the July edition lands in the middle of the most eventful year the power system has had since 2022: record heat, a record artificial-intelligence build-out, and the loss of nearly a fifth of global LNG supply after the closure of the Strait of Hormuz. Four findings organise the update. Demand growth is accelerating, not settling. The generation mix passes a historic threshold, with renewables overtaking coal after more than fifty years. Emissions plateau even as consumption surges. And the year's supply shock has priced very differently depending on what a power system burns. The numbers behind each follow.
Demand: the acceleration is broad-based
Global electricity demand grew 3 percent in 2025 and is now forecast to grow 3.6 percent in 2026 and 3.8 percent in 2027, lifting consumption from 28,600 terawatt-hours to about 30,700 terawatt-hours — an increment of more than 2,000 terawatt-hours in two years, comparable to adding a second India to the world's power system. The drivers are industrial electrification, air-conditioning, data centres and the electrification of transport and heating; the IEA flags a stronger-than-expected El Niño as an upside risk that would raise cooling demand further.
The geography matters as much as the total. India quadruples its pace, from 1.6 percent in 2025 to about 7 percent in 2026; China grows 5.5 percent, slightly above its 2025 rate; the United States adds close to 2 percent with data centres taking a large share of the increment; the European Union grows about 2 percent as industrial demand stabilises. Central Asia needs no forecast to illustrate the trend: Uzbekistan set six consecutive daily consumption records in a single July week and crossed 300 million kilowatt-hours a day for the first time.
Indicator
2025
2026 (f)
2027 (f)
Global demand growth
3.0%
3.6%
3.8%
Global consumption (TWh)
28,600
—
≈30,700
China
5.2%
5.5%
—
India
1.6%
≈7%
—
United States
—
≈2%
—
European Union
—
≈2%
—
Power-sector CO2
—
≈+1%
broadly flat
The mix: coal's half-century at the top ends
Renewables reached near parity with coal in 2025 and are forecast to overtake coal-fired output in 2026, taking their share of the generation mix from 33 percent in 2025 to 37 percent by 2027. Ember's dataset of 2025 actuals, covering 91 countries and about 93 percent of world demand, already reads renewables marginally ahead — 33.8 percent of generation against 33.0 percent for coal; the two institutions differ by decimal points and data vintage, not direction. Either way, the position coal has held for more than fifty years changes hands this year. The engine is solar, whose output rises by around 600 terawatt-hours in 2026, broadly matching its record 2025 expansion, with similar growth expected in 2027; solar also overtakes wind in 2026 to become the second-largest renewable source after hydropower. This is not a story of coal collapsing — absolute coal output remains close to its historic high, and price-driven switching from gas back to coal is under way in several Asian and European markets — but of renewables outgrowing everything else, with total renewable generation expanding more than 8 percent in 2026.
Generation indicator
Value
Source
Renewables share, 2025
33% (IEA) · 33.8% actual (Ember)
IEA · Ember
Coal share, 2025
33.0% actual (near parity)
Ember · IEA
Renewables share, 2027 (f)
37%
IEA
Renewable generation growth, 2026 (f)
more than 8%
IEA
Solar output growth, 2026 (f)
≈600 TWh — matching the 2025 record; similar in 2027
IEA
Solar vs wind
solar overtakes wind in 2026 (2nd-largest renewable after hydro)
IEA
Nuclear generation, 2027 (f)
more than +4%
IEA
Gas-fired output
broadly flat in 2026; rebound expected in 2027
IEA
Prices: one shock, four different bills
The closure of the Strait of Hormuz removed nearly 20 percent of global LNG supply, and the price consequences sorted the world's power markets by their fuel exposure. Wholesale electricity prices in the European Union and Japan stood more than 30 percent above their year-earlier level in the second quarter of 2026; the United States, insulated by domestic gas, was largely unchanged; India rose by less than 10 percent; Australia, riding a rapid build-out of renewables and battery storage, fell by about 45 percent. The lesson is structural rather than cyclical: exposure to imported fuel has become the single largest determinant of what an economy pays for electricity in a crisis, and the renewables share is the insulation. The countries at the favourable end of the divergence are not those with the cheapest fuel but those that need the least of it.
Market
Wholesale price, Q2 2026 vs Q2 2025
European Union
more than +30%
Japan
more than +30%
India
less than +10%
United States
largely unchanged
Australia
about −45%
Emissions and what the numbers change
The carbon arithmetic closes the set: the IEA expects power-sector emissions to rise by only about 1 percent in 2026 and to remain broadly flat in 2027, while demand grows at close to 4 percent — a system that adds an India-sized increment in two years while holding emissions level has, in engineering terms, already changed regimes. Precision about the mix milestone protects it from overclaiming: shares are measured in energy while reliability is tested in hours, and a grid can be renewable-majority on an annual basis yet fossil-dependent on a windless winter evening. What the mid-year numbers change is the centre of gravity of every planning question that follows. When the largest source of electricity is variable, the binding constraints migrate from fuel supply to system capability — storage, grids, interconnection, flexible demand and firm low-carbon capacity, the constraint set this publication has traced from the global grid investment shortfall to the connection queues pacing the artificial-intelligence build-out. Countries that treat the crossover as a finish line will discover, at the first hard winter or record summer, that it was the starting line.
Sources cited in text and figures: International Energy Agency — Electricity Mid-Year Update 2026 and its executive summary (23 July 2026): demand growth and consumption, generation shares, solar, wind, gas and nuclear output forecasts, regional wholesale price comparisons for Q2 2026, LNG supply disruption, El Niño risk and CO2 outlook; Ember — Global Electricity Review 2026 (July 2026): 2025 actual generation shares (91 countries, about 93 percent of global demand); Ministry of Energy of Uzbekistan via Gazeta.uz and Kun.uz (20-21 July 2026) for the Uzbek demand records cited as regional context. Charts by UzEnergyNews from the figures above; copyrighted charts and tables are not reproduced. Analysis by UzEnergyNews.
Yıl Ortasında Dünya Elektrik Sistemi: IEA'nın 2026 Güncellemesi Sayılarla
Uluslararası Enerji Ajansı'nın 23 Temmuz'da yayımlanan Yıl Ortası Elektrik Güncellemesi, dünya elektrik sisteminin referans sayılarını yeniden kurmaktadır: talep büyümesi 2026 için yüzde 3,6'ya ve 2027 için yüzde 3,8'e revize edilmiş; tüketim 28.600'den yaklaşık 30.700 teravat-saate yönelmiş; yenilenebilir kaynaklar, kömürün yarım yüzyılı aşan liderliğinin ardından 2026'da kömürü geçmekte; güneş yılda yaklaşık 600 teravat-saat eklemekte; talep ivmelenirken emisyonlar yatay seyretmekte; savaş kaynaklı yakıt şoku ise toptan fiyatları bölgesel olarak ayrıştırmıştır — Avrupa Birliği ve Japonya'da yüzde 30'un üzerinde artış, Amerika Birleşik Devletleri'nde yatay seyir, Avustralya'da yaklaşık yüzde 45 düşüş. Bu sayı, veri setinin tamamını grafik ve tablolarla sunmaktadır.
IEA, her elektrik analizinin dayandığı sayıları yılda iki kez yeniden temellendirir ve Temmuz baskısı, elektrik sisteminin 2022'den bu yana yaşadığı en hareketli yılın ortasına denk gelmektedir: rekor sıcaklar, rekor bir yapay zekâ yatırım dalgası ve Hürmüz Boğazı'nın kapanmasıyla küresel LNG arzının yaklaşık beşte birinin kaybı. Güncellemeyi dört bulgu düzenlemektedir. Talep büyümesi yavaşlamamakta, ivmelenmektedir. Üretim karması tarihi bir eşiği geçmekte, yenilenebilirler elli yılı aşkın sürenin ardından kömürü geride bırakmaktadır. Tüketim sıçrarken emisyonlar platoya oturmaktadır. Yılın arz şoku ise sistemin ne yaktığına bağlı olarak çok farklı fiyatlanmıştır. Her birinin arkasındaki sayılar aşağıdadır.
Talep: ivme geniş tabanlı
Küresel elektrik talebi 2025'te yüzde 3 büyümüştür; artık 2026'da yüzde 3,6 ve 2027'de yüzde 3,8 büyümesi öngörülmektedir. Tüketim 28.600 teravat-saatten yaklaşık 30.700 teravat-saate çıkmaktadır — iki yılda 2.000 teravat-saati aşan bir artış; dünya elektrik sistemine ikinci bir Hindistan eklemekle kıyaslanabilir. Sürükleyiciler sanayi elektrifikasyonu, klima yükü, veri merkezleri ile ulaşım ve ısıtmanın elektrifikasyonudur; Ajans, beklenenden güçlü bir El Niño'yu soğutma talebini daha da artırabilecek yukarı yönlü risk olarak işaretlemektedir.
Coğrafya, toplam kadar önemlidir. Hindistan hızını dörde katlamaktadır: 2025'teki yüzde 1,6'dan 2026'da yaklaşık yüzde 7'ye. Çin, 2025 hızının hafif üzerinde, yüzde 5,5 büyümektedir; Amerika Birleşik Devletleri, artışın büyük bölümü veri merkezlerinden gelmek üzere yüzde 2'ye yakın; Avrupa Birliği ise sanayi talebi istikrar kazanırken yaklaşık yüzde 2 büyümektedir. Orta Asya'da eğilimin tahmine ihtiyacı yoktur: Özbekistan tek bir Temmuz haftasında art arda altı günlük tüketim rekoru kırmış ve günlük 300 milyon kilovat-saat eşiğini ilk kez aşmıştır.
Gösterge
2025
2026 (t)
2027 (t)
Küresel talep büyümesi
%3,0
%3,6
%3,8
Küresel tüketim (TWh)
28.600
—
≈30.700
Çin
%5,2
%5,5
—
Hindistan
%1,6
≈%7
—
Amerika Birleşik Devletleri
—
≈%2
—
Avrupa Birliği
—
≈%2
—
Elektrik sektörü CO2
—
≈+%1
büyük ölçüde yatay
Karma: kömürün yarım asırlık liderliği bitiyor
Yenilenebilir kaynaklar 2025'te kömürle neredeyse başa baş noktaya ulaşmıştır ve 2026'da kömür kaynaklı üretimi geçmeleri öngörülmektedir; üretim karmasındaki payları 2025'teki yüzde 33'ten 2027'de yüzde 37'ye çıkmaktadır. 91 ülkeyi ve dünya talebinin yaklaşık yüzde 93'ünü kapsayan Ember'in 2025 gerçekleşme verisi, yenilenebilirleri şimdiden ince farkla önde okumaktadır: üretimin yüzde 33,8'i, kömürün yüzde 33,0'üne karşı. İki kurum arasındaki fark ondalık basamak ve veri dönemi farkıdır, yön farkı değildir. Her iki durumda da kömürün elli yılı aşkın süredir elinde tuttuğu konum bu yıl el değiştirmektedir. Motor güneştir: güneş üretimi 2026'da yaklaşık 600 teravat-saat artarak 2025'in rekor genişlemesini aşağı yukarı tekrarlamakta, 2027'de benzer bir artış beklenmektedir; güneş ayrıca 2026'da rüzgârı geçerek hidroelektrikten sonra en büyük ikinci yenilenebilir kaynak olmaktadır. Bu, kömürün çöküş hikâyesi değildir — mutlak kömür üretimi tarihi zirvesine yakın seyretmekte ve birkaç Asya ve Avrupa piyasasında fiyat kaynaklı gazdan kömüre dönüş yaşanmaktadır — yenilenebilirlerin diğer her şeyden hızlı büyümesinin hikâyesidir: toplam yenilenebilir üretim 2026'da yüzde 8'in üzerinde genişlemektedir.
Üretim göstergesi
Değer
Kaynak
Yenilenebilir payı, 2025
%33 (IEA) · %33,8 gerçekleşme (Ember)
IEA · Ember
Kömür payı, 2025
%33,0 gerçekleşme (başa baş)
Ember · IEA
Yenilenebilir payı, 2027 (t)
%37
IEA
Yenilenebilir üretim büyümesi, 2026 (t)
%8'in üzerinde
IEA
Güneş üretim artışı, 2026 (t)
≈600 TWh — 2025 rekoruna eş; 2027'de benzer
IEA
Güneş - rüzgâr sıralaması
güneş 2026'da rüzgârı geçiyor (hidro sonrası 2.)
IEA
Nükleer üretim, 2027 (t)
+%4'ün üzerinde
IEA
Gaz kaynaklı üretim
2026'da büyük ölçüde yatay; 2027'de toparlanma
IEA
Fiyatlar: tek şok, dört farklı fatura
Hürmüz Boğazı'nın kapanması küresel LNG arzının yaklaşık yüzde 20'sini devre dışı bırakmış, fiyat sonuçları dünya elektrik piyasalarını yakıt maruziyetlerine göre sıralamıştır. 2026'nın ikinci çeyreğinde toptan elektrik fiyatları Avrupa Birliği ve Japonya'da bir yıl öncesinin yüzde 30'undan fazla üzerinde seyretmiş; yerli gazla yalıtılmış Amerika Birleşik Devletleri'nde büyük ölçüde değişmemiş; Hindistan'da yüzde 10'un altında artmış; hızla genişleyen yenilenebilir ve batarya depolama filosunun taşıdığı Avustralya'da ise yaklaşık yüzde 45 düşmüştür. Ders konjonktürel değil yapısaldır: ithal yakıta maruziyet, bir ekonominin kriz anında elektriğe ödediği bedelin en büyük tek belirleyicisi hâline gelmiştir; yalıtım ise yenilenebilir payıdır. Ayrışmanın avantajlı ucundaki ülkeler en ucuz yakıta sahip olanlar değil, en az yakıta ihtiyaç duyanlardır.
Piyasa
Toptan fiyat, 2026 Ç2 - 2025 Ç2
Avrupa Birliği
+%30'dan fazla
Japonya
+%30'dan fazla
Hindistan
+%10'dan az
Amerika Birleşik Devletleri
büyük ölçüde değişmedi
Avustralya
yaklaşık −%45
Emisyonlar ve sayıların değiştirdiği şey
Karbon aritmetiği seti tamamlamaktadır: Ajans, talep yüzde 4'e yakın büyürken elektrik sektörü emisyonlarının 2026'da yalnızca yaklaşık yüzde 1 artmasını ve 2027'de büyük ölçüde yatay kalmasını beklemektedir — iki yılda Hindistan boyutunda bir artışı ekleyip emisyonunu sabit tutan bir sistem, mühendislik diliyle rejim değiştirmiş demektir. Karma kilometre taşı konusunda kesinlik, onu abartıdan korur: paylar enerjiyle ölçülür, güvenilirlik saatlerle sınanır; bir şebeke yıllık bazda yenilenebilir-çoğunluklu olup rüzgârsız bir kış akşamında hâlâ fosile bağımlı olabilir. Yıl ortası sayılarının değiştirdiği şey, bundan sonraki her planlama sorusunun ağırlık merkezidir. En büyük elektrik kaynağı değişken olduğunda bağlayıcı kısıtlar yakıt arzından sistem kabiliyetine göçer: depolama, şebekeler, enterkonneksiyon, esnek talep ve kesintisiz düşük karbonlu kapasite — bu yayının küresel şebeke yatırım açığından yapay zekâ dalgasının hızını belirleyen bağlantı kuyruklarına kadar izlediği aynı kısıt kümesi. Geçişi bitiş çizgisi sayan ülkeler, ilk sert kışta veya ilk rekor yazda bunun başlangıç çizgisi olduğunu görecektir.
Metinde ve grafiklerde atıf yapılan kaynaklar: Uluslararası Enerji Ajansı — Yıl Ortası Elektrik Güncellemesi 2026 ve yönetici özeti (23 Temmuz 2026): talep büyümesi ve tüketim, üretim payları, güneş, rüzgâr, gaz ve nükleer öngörüleri, 2026 ikinci çeyrek bölgesel toptan fiyat karşılaştırmaları, LNG arz kesintisi, El Niño riski ve emisyon görünümü; Ember — Küresel Elektrik Değerlendirmesi 2026 (Temmuz 2026): 2025 gerçekleşen üretim payları (91 ülke, küresel talebin yaklaşık yüzde 93'ü); bölgesel bağlam olarak anılan Özbekistan talep rekorları için Özbekistan Enerji Bakanlığı açıklamalarını aktaran Gazeta.uz ve Kun.uz (20-21 Temmuz 2026). Grafikler yukarıdaki rakamlardan UzEnergyNews tarafından üretilmiştir; telif korumalı grafik ve tablolar yeniden üretilmemiştir. Analiz: UzEnergyNews.
WEEKLY INSIGHT #12 · DATA CENTRES & GRIDS · GLOBAL22 July 2026 · 12 min read · EN/TR · Global
The Queue, Not the Chip: Why Grid Connection Has Become the First Constraint on the Artificial Intelligence Build-Out
Semiconductors are treated as the scarce input of the artificial intelligence build-out and capital as the enabler. The International Energy Agency describes the obstacles differently, placing grid connections held up by planning and permitting first, supply chains for gas turbines and transformers next, and advanced chips among the tightening supply chains rather than at the head of them. On the Agency's own quantification, around 20 percent of planned data centre projects are at risk of delay because of strain on electricity grids. This is the structural case for reading the artificial intelligence build-out as an electricity system problem, from connection queues and turbine order books to the capacity prices already reaching consumer bills.
The prevailing account of the artificial intelligence build-out treats semiconductors as the scarce input and capital as the enabler. Neither proposition is supported by the institutions that model the electricity system directly. In Key Questions on Energy and AI, published in April 2026, the International Energy Agency describes the obstacles to data centre delivery in a consistent order: planning and regulatory systems that hold up grid connections, then supply chains for energy technologies such as gas turbines and transformers, then advanced chips and other information technology components. Semiconductor supply appears in that account as one tightening supply chain among several rather than as the first constraint. The Agency's special report Energy and AI quantifies the leading constraint, finding that around 20 percent of planned data centre projects could be at risk of delay because of strain on electricity grids, with connection queues for both supply and demand projects described as long and complex. That finding sits against record capital availability. Hyperscaler capital expenditure is expected to exceed 600 billion dollars in 2026; market estimates compiled from company guidance range from roughly 600 to 690 billion dollars for the five largest spenders depending on the perimeter used, against a 2025 base near 400 billion dollars. The IEA records the same direction, noting data centre investment above 400 billion dollars in 2025 and a further increase of about 75 percent in 2026. Capital is not the binding constraint, and on the Agency's own account neither is silicon. The constraint is an electricity system whose construction cycle is measured in years while compute capacity is contracted in quarters. Two earlier editions bear directly on this argument and are distinct from it. Weekly Insight #9 examined the global shortfall in network investment, that is, how much capital the grid requires and why that capital costs more in emerging economies. The constraint examined here is different in kind: it concerns the right to connect to capacity that in many cases already exists, and the rules that allocate it. Weekly Insight #11 examined the water dimension of the same infrastructure; the electrical constraint analysed here is separate from it and prior to it.
From terawatt-hours to gigawatts: the shape of the new load
Gartner projects that global data centre electricity consumption will rise from 447 terawatt-hours in 2025 to 565 terawatt-hours in 2026, an increase of 26 percent in a single year. Within that total, consumption by AI-optimised servers rises from 95 to 175 terawatt-hours, growth of 84 percent, lifting the artificial intelligence share of data centre consumption to 31 percent in 2026; on the same projection, AI servers overtake the entire conventional server fleet in consumption during 2027. For system planners the more consequential measure is capacity rather than energy, and Gartner puts data centre power demand at 105 gigawatts in 2025 and 133 gigawatts in 2026. The IEA series points in the same direction, although the two use different definitions and coverage and should be read as parallel estimates rather than as a single reconciled series. On the Agency's figures, data centre electricity use was approximately 415 terawatt-hours in 2024, about 1.5 percent of global electricity, rising to roughly 945 terawatt-hours by 2030, slightly below 3 percent. The implied annual growth of about 15 percent is more than four times the combined growth of all other sectors. The divergence was already visible in 2025, when AI-focused data centre consumption grew by around 50 percent, total data centre consumption by 17 percent, and global electricity demand by 3 percent. Distribution matters as much as scale. On IEA figures for 2024, the United States accounted for 45 percent of global data centre electricity use, China for 25 percent and Europe for 15 percent. Goldman Sachs Research places United States data centre power demand at 31 gigawatts in 2025 and 41 gigawatts in 2026, raising the sector's share of summer peak demand from 4.1 to 5.3 percent. Rystad Energy and Carbon Brief expect Chinese data centre consumption to move from 1.2 percent of national electricity in 2024 to 2.3 percent by 2030, close to 289 terawatt-hours, growing at about 19 percent a year with installed capacity above 60 gigawatts. Wood Mackenzie expects Japanese data centre consumption to more than triple, from 19 terawatt-hours in 2024 to between 57 and 66 terawatt-hours by 2034, equivalent to 15 to 18 million households. IEEFA projects Indian data centre capacity to rise from 1.4 to 9 gigawatts by 2030, taking the sector from under 1 percent of national electricity to around 3 percent.
Where the system binds: connection queues, transformers and turbines
IEA Electricity 2026 reports more than 2,500 gigawatts of projects held in grid connection queues worldwide. That total covers renewables, storage and large loads including data centres, and no authoritative source isolates the data centre share within it; it nonetheless remains the clearest single measure of how far connection requests have outrun connection capacity. Individual pipelines make the same point at national scale. ERCOT in Texas has received more than 438 gigawatts of large-load interconnection requests, approximately 90 percent of them from data centres, roughly five times the system's peak demand. Time is the variable that binds. The IEA finds that transmission line construction takes four to eight years in advanced economies, while grid connection waiting times within the European Union range from two to ten years depending on the member state, approaching a decade in some critical zones. Delivery times for essential grid equipment such as transformers and cables have doubled over the past three years. Generation equipment is tighter still. On figures compiled by Bloomberg, Utility Dive and IEEFA, GE Vernova, Siemens Energy and Mitsubishi Power together account for around 75 percent of large-frame gas turbine output, order books extend approximately five years, and delivery positions are sold beyond 2030, reaching eight years on some production lines. Announced expansions across the three manufacturers raise combined output by only 20 to 25 percent, and the IEA notes that turbine delivery delays can push commissioning past 2030. Scarcity has repriced the asset: IRENA finds that the shortage has doubled the capital cost of a new combined cycle plant in the United States to about 2,400 dollars per kilowatt, pushing the levelised cost of gas generation toward 100 dollars per megawatt-hour in markets with high gas costs such as Italy, Germany and Japan, while it remains in the 50 to 60 dollar range where gas is inexpensive. The geography of the constraint is not American. Amsterdam will not assess new data centre applications until 2035 on grounds of grid congestion, and projects above 70 megawatts of IT capacity or 10 hectares are prohibited across most of the Netherlands. Cushman and Wakefield finds that roughly 75 percent of South Korea's operating data centre capacity and 68 percent of new projects are concentrated in the Greater Seoul area, converting a commercial siting preference into a transmission problem. In Malaysia's Johor corridor the limitation is explicitly connection rather than generation: of 51 approved projects, 17 are in operation and 11 under construction, with capacity moving from 1,025 megawatts at the end of 2025 toward more than 2,000 megawatts by the end of 2026 against a pipeline of 3,500 megawatts.
The constraint already carries a price
The clearest monetisation of scarcity is the PJM Interconnection capacity market in the United States. Clearing prices moved from 28.92 dollars per megawatt-day for the 2024/25 delivery year to 329.17 dollars for 2026/27, and two auctions have been held since. The 2027/28 auction, cleared in December 2025, settled at 333.44 dollars per megawatt-day, the ceiling then set by the Federal Energy Regulatory Commission, procuring 134,479 megawatts at a cost of about 16.4 billion dollars and falling roughly 6,500 megawatts short of the reliability requirement. The 2028/29 auction, with results published on 14 July 2026, cleared at 325 dollars per megawatt-day, which is again the regulatory ceiling itself and the third consecutive auction to clear at the cap; the cap fell by 2.5 percent between the two auctions, so the lower headline price reflects the administrative ceiling rather than any easing in the market. The auction procured 138,318 megawatts for approximately 16.4 billion dollars, 6,831 megawatts below the reliability requirement, and attracted only about 525 megawatts of new resources, of which 208 megawatts were uprates to existing plant. PJM's own simulation, as reported by Utility Dive, indicates the auction would have cleared at 555 dollars per megawatt-day without the cap, 71 percent above it. The shortfall therefore widened while the price fell, and for the first time in PJM's history the region as a whole failed to meet its reliability requirement in two consecutive auctions. Attribution here is documented rather than inferred. Monitoring Analytics, PJM's independent market monitor, calculates that data centre load accounted for 29.4 billion dollars of the 63.6 billion dollars of capacity cost across the last four auctions, or 46 percent, and that 63 percent of the price increase in the 2025/26 auction was data centre driven, equal to 9.3 billion dollars borne by consumers. PJM estimates that record capacity prices will raise some consumer bills by approximately 1.5 to 5 percent. In Washington DC, Pepco residential bills rose by an average of 21 dollars a month from June 2025, roughly half of that attributable to capacity prices, and the Natural Resources Defense Council projects cumulative additional costs of 100 to 163 billion dollars through 2033. Cost pass-through has produced a second constraint that is political rather than physical. Data Center Watch recorded more than 75 projects worth about 130 billion dollars blocked in the early months of 2026, a record period, with 833 opposition groups identified across 49 states. The documented driver of those blockages is local opposition centred on electricity prices, water use and noise rather than grid capacity itself, which makes social licence a distinct bottleneck alongside connection capacity rather than evidence of it.
The response: allocation rules, flexibility and firm supply
The industry's response appeared first in siting. Bloom Energy's 2026 Power Report describes a market in which site selection now follows available generation capacity and energisation schedules rather than customer proximity or fibre, with developers optimising for the earliest energisation rather than the lowest cost. Allocation rules are changing in parallel. The European Commission published its Electrification Action Plan, COM/2026/595, on 17 July 2026 alongside the European Grids Package. The IEA's assessment of Europe sets out why allocation has become the operative question: connection capacity is scarce in most member states, and data centres compete for the same capacity as housing, industrial electrification, electric vehicle charging and heating, which makes this a matter of public allocation rather than of one technology sector. European guidance moves connection from first-come-first-served to first-ready-first-served, adding maturity criteria, milestones, penalties and queue clean-up. In Ireland, the Commission for Regulation of Utilities lifted the Dublin connection moratorium in December 2025 and replaced it with a requirement that new data centres install on-site generation or storage sufficient to meet their full demand and export to the grid when required, the first binding regulatory application of the bring-your-own-power principle. Singapore now rations capacity through allocation, closing applications on 31 March 2026 for a call covering at least 200 megawatts. China has been relocating compute since 2022 under East Data West Computing, with eight computing hubs in the west and ten data clusters in the east. In the Gulf, power supply architecture is designed into projects from the outset: the first 200 megawatt tranche of the 1 gigawatt Stargate cluster in the United Arab Emirates is targeted for the third quarter of 2026, and Saudi Arabia's Humain programme sits within national targets of 1.9 gigawatts by 2030 and 6.6 gigawatts by 2034, although announced gigawatts should not be read as delivered capacity. The available solution set indicates that the constraint is institutional before it is physical. The Nicholas Institute at Duke University calculates that the existing United States grid could absorb at least 76 gigawatts of new load, equal to 10 percent of national peak demand, in exchange for curtailment of only 0.25 percent a year. The IEA estimates that grid-enhancing technologies could release up to 175 gigawatts of transmission capacity without building a single new line, and finds in Electricity 2026 that complementary solutions could connect 1,200 to 1,600 gigawatts of advanced-stage projects currently held in queues. PJM is developing frameworks that allow data centres to connect on condition that they operate flexibly at peak. Behind-the-meter generation is presented as an alternative to waiting in the connection queue, but IEA satellite tracking shows that many of these projects in the United States remain at an early stage because of the technical and financial hurdles involved. On firm supply, large technology companies have contracted more than 10 gigawatts of prospective new nuclear capacity over the past year, including the 835 megawatt restart of Three Mile Island Unit 1 under a twenty-year power purchase agreement worth about 16 billion dollars and targeted for 2027 to 2028, Google's 500 megawatt agreement with Kairos Power, the first corporate small modular reactor fleet agreement in the United States, Amazon's 700 million dollar investment in X-energy for up to twelve Xe-100 reactors, and Meta's stated target of up to 6.6 gigawatts through Vistra, Oklo and TerraPower. IRENA's cost data also challenges the assumption that round-the-clock supply must come from gas or nuclear, placing firm solar plus storage at 54 to 74 dollars per megawatt-hour against 60 to 95 dollars for new combined cycle gas including fuel and emissions. The pace of the artificial intelligence build-out will be set by connection queues, transformer lead times, turbine delivery positions and the rules that allocate them, rather than by chip supply or capital.
Sources cited in text: International Energy Agency — Key Questions on Energy and AI (April 2026), Energy and AI (World Energy Outlook Special Report), Electricity 2026, and the Agency's commentary on overcoming energy constraints for Europe's data centre goals; Gartner press release of 10 June 2026; Goldman Sachs Research; Rystad Energy and Carbon Brief; Wood Mackenzie; IEEFA; Cushman and Wakefield; ERCOT large-load interconnection reporting; PJM Interconnection auction reports for the 2027/28 and 2028/29 delivery years, with auction analysis reported by Utility Dive; Monitoring Analytics, PJM Independent Market Monitor; Natural Resources Defense Council; Data Center Watch; European Commission — Electrification Action Plan (COM/2026/595) and European Grids Package; Commission for Regulation of Utilities (Ireland); Nicholas Institute, Duke University; IRENA — Renewable Power Generation Costs 2025; Bloom Energy 2026 Power Report; gas turbine figures as compiled by Bloomberg, Utility Dive and IEEFA. Copyrighted charts and tables are not reproduced. Analysis by UzEnergyNews.
Çip Değil Kuyruk: Şebeke Bağlantısı Yapay Zekâ Yatırım Dalgasının Birinci Kısıtı Hâline Nasıl Geldi
Yapay zekâ yatırım dalgasında kıt girdinin yarı iletken, sermayenin ise hızlandırıcı olduğu varsayılmaktadır. Uluslararası Enerji Ajansı engelleri farklı tarif etmektedir: ilk sırada planlama ve düzenleme süreçlerinin geciktirdiği şebeke bağlantıları, ardından gaz türbini ve transformatör tedarik zincirleri gelmekte, ileri düzey çipler ise daralan tedarik zincirlerinin başında değil arasında yer almaktadır. Aynı kurumun sayısallaştırmasına göre, elektrik şebekeleri üzerindeki baskı nedeniyle planlanan veri merkezi projelerinin yaklaşık %20'si gecikme riski altındadır.
Yapay zekâ yatırım dalgasına ilişkin yaygın anlatı, kıt girdinin yarı iletken, sermayenin ise hızlandırıcı olduğunu varsaymaktadır. Elektrik sistemini doğrudan modelleyen kurumların bulguları bu varsayımın her iki ayağını da desteklememektedir. Uluslararası Enerji Ajansı, Nisan 2026'da yayımladığı Key Questions on Energy and AI çalışmasında veri merkezi projelerinin önündeki engelleri tutarlı bir sırayla tarif etmektedir: önce şebeke bağlantılarını geciktiren planlama ve düzenleme süreçleri, ardından gaz türbini ve transformatör gibi enerji teknolojilerinin tedarik zincirleri, sonra da ileri düzey çipler ve diğer bilişim bileşenleri. Yarı iletken arzı bu tabloda birinci kısıt olarak değil, daralan tedarik zincirlerinden biri olarak yer almaktadır. Ajans'ın Energy and AI özel raporu ise başat kısıtı sayısallaştırmakta; elektrik şebekeleri üzerindeki baskı nedeniyle planlanan veri merkezi projelerinin yaklaşık %20'sinin gecikme riski taşıdığını, hem üretim hem tüketim projeleri için bağlantı kuyruklarının uzun ve karmaşık olduğunu tespit etmektedir. Bu bulgu, rekor düzeydeki sermaye bolluğuyla aynı döneme denk gelmektedir. Hiperölçekleyicilerin 2026 yatırım harcamasının 600 milyar doları aşması beklenmekte; şirket yönlendirmelerinden derlenen piyasa tahminleri, kapsam tanımına göre en büyük beş şirket için yaklaşık 600-690 milyar dolar bandında değişmekte, 2025 tabanı ise 400 milyar dolara yakın bulunmaktadır. Uluslararası Enerji Ajansı da aynı yönü teyit etmekte, 2025'te 400 milyar doları aşan veri merkezi yatırımına ve 2026'da yaklaşık %75'lik ilave artışa işaret etmektedir. Bağlayıcı kısıt sermaye değildir; Ajans'ın kendi anlatımında yarı iletken de değildir. Kısıt, inşa döngüsü yıllarla ölçülen bir elektrik sisteminin, çeyrek dönemlerle sözleşmeye bağlanan hesaplama kapasitesine yetişememesidir. Önceki iki sayı bu tartışmayla doğrudan ilgilidir ve buradaki konudan ayrışmaktadır. Weekly Insight #9, şebeke yatırımındaki küresel açığı, yani şebekenin ne kadar sermayeye ihtiyaç duyduğunu ve bu sermayenin gelişen ekonomilerde neden daha pahalı olduğunu ele almıştı. Burada incelenen kısıt niteliği bakımından farklıdır: çoğu durumda hâlihazırda mevcut olan kapasiteye bağlanma hakkı ve bu hakkı dağıtan kurallar söz konusudur. Weekly Insight #11 ise aynı altyapının su boyutunu incelemişti; burada ele alınan elektrik kısıtı ondan ayrı ve ona öncel bir kısıttır.
Terawatt-saatten gigawatta: yeni yükün biçimi
Gartner, küresel veri merkezi elektrik tüketiminin 2025'teki 447 TWh düzeyinden 2026'da 565 TWh'e yükseleceğini, yani tek yılda %26 artacağını öngörmektedir. Bu toplam içinde yapay zekâ için optimize edilmiş sunucuların tüketimi 95 TWh'ten 175 TWh'e çıkmakta, %84 büyümekte ve yapay zekânın veri merkezi tüketimindeki payını 2026'da %31'e taşımaktadır. Aynı öngörüye göre yapay zekâ sunucuları 2027'de tüketimde geleneksel sunucu filosunun tamamını geçmektedir. Sistem planlaması açısından daha belirleyici olan ölçü enerji değil kapasitedir: Gartner, veri merkezi güç talebini 2025'te 105 GW, 2026'da ise 133 GW olarak vermektedir. Uluslararası Enerji Ajansı'nın serisi aynı yönü göstermektedir; ancak iki seri farklı tanım ve kapsam kullandığından, tek bir mutabık seri olarak değil, birbirine paralel iki tahmin olarak okunmalıdır. Ajans'ın verilerine göre veri merkezi elektrik tüketimi 2024'te yaklaşık 415 TWh, yani küresel elektriğin yaklaşık %1,5'i; 2030'da ise yaklaşık 945 TWh, yani %3'ün biraz altıdır. Bunun ima ettiği yıllık yaklaşık %15'lik büyüme, diğer tüm sektörlerin toplam büyümesinin dört katından fazladır. Ayrışma 2025'te belirgin hâle gelmiştir: yapay zekâ odaklı veri merkezi tüketimi yaklaşık %50, veri merkezi tüketiminin tamamı %17, küresel elektrik talebi ise %3 artmıştır. Dağılım en az ölçek kadar önemlidir. Ajans'ın 2024 verilerine göre küresel veri merkezi elektrik tüketiminin %45'i Amerika Birleşik Devletleri'nde, %25'i Çin'de ve %15'i Avrupa'dadır. Goldman Sachs Research, Amerika Birleşik Devletleri veri merkezi güç talebini 2025'te 31 GW, 2026'da 41 GW olarak hesaplamakta ve sektörün yaz tepe talebindeki payının %4,1'den %5,3'e çıktığını belirtmektedir. Rystad Energy ve Carbon Brief, Çin'de veri merkezi tüketiminin 2024'teki %1,2'lik ulusal elektrik payından 2030'da %2,3'e, yaklaşık 289 TWh düzeyine çıkacağını, yıllık yaklaşık %19 büyüyeceğini ve kurulu kapasitenin 60 GW'ı aşacağını öngörmektedir. Wood Mackenzie, Japonya'da veri merkezi tüketiminin 2024'teki 19 TWh düzeyinden 2034'te 57-66 TWh'e, yani üç katından fazlasına çıkacağını ve bunun 15-18 milyon haneye eşdeğer olduğunu belirtmektedir. IEEFA ise Hindistan'da veri merkezi kapasitesinin 1,4 GW'tan 2030'da 9 GW'a yükseleceğini ve sektörün ulusal elektrik tüketimindeki payının bugünkü %1'in altından yaklaşık %3'e çıkacağını hesaplamaktadır.
Sistemin sıkıştığı yer: bağlantı kuyrukları, transformatörler ve türbinler
IEA Electricity 2026, dünya genelinde 2.500 GW'ı aşan projenin şebeke bağlantı kuyruğunda beklediğini bildirmektedir. Bu toplam yenilenebilir üretimi, depolamayı ve veri merkezleri dâhil büyük yükleri kapsamaktadır ve hiçbir otoriter kaynak bunun içinde veri merkezlerinin payını ayrıştırmamaktadır; yine de bağlantı taleplerinin bağlantı kapasitesini ne ölçüde aştığını gösteren en açık tek ölçüdür. Tekil proje hatları aynı tabloyu ulusal ölçekte ortaya koymaktadır. Teksas'ta ERCOT'a yapılan büyük yük bağlantı başvuruları 438 GW'ı aşmıştır; bunun yaklaşık %90'ı veri merkezlerinden gelmekte ve toplam, sistemin tepe talebinin yaklaşık beş katına karşılık gelmektedir. Bağlayıcı değişken zamandır. Ajans, gelişmiş ekonomilerde iletim hattı inşasının dört ilâ sekiz yıl sürdüğünü, Avrupa Birliği içinde şebeke bağlantısı bekleme süresinin üye ülkeye göre iki ilâ on yıl arasında değiştiğini ve bazı kritik bölgelerde on yıla yaklaştığını tespit etmektedir. Transformatör ve kablo gibi kritik şebeke ekipmanında teslim süreleri son üç yılda ikiye katlanmıştır. Üretim ekipmanındaki darboğaz daha da dardır. Bloomberg, Utility Dive ve IEEFA derlemelerine göre GE Vernova, Siemens Energy ve Mitsubishi Power birlikte büyük çerçeveli gaz türbini üretiminin yaklaşık %75'ini karşılamakta, sipariş defterleri yaklaşık beş yıla uzanmakta ve teslimat sıraları 2030'un ötesine, bazı üretim hatlarında sekiz yıla kadar satılmış bulunmaktadır. Üç üreticinin açıkladığı kapasite genişletmeleri toplam üretimi ancak %20-25 artırmakta, Ajans ise türbin teslimatındaki gecikmelerin devreye alışı 2030 sonrasına itebileceğini belirtmektedir. Kıtlık varlığı yeniden fiyatlamıştır: IRENA, türbin kıtlığının Amerika Birleşik Devletleri'nde yeni bir kombine çevrim santralinin sermaye maliyetini yaklaşık 2.400 dolar/kW düzeyine, yani iki katına çıkardığını; bunun İtalya, Almanya ve Japonya gibi gaz maliyeti yüksek piyasalarda gaz üretiminin seviyelendirilmiş maliyetini 100 dolar/MWh'e doğru ittiğini, gazın ucuz olduğu piyasalarda ise maliyetin 50-60 dolar bandında kaldığını ortaya koymaktadır. Kısıtın coğrafyası Amerika Birleşik Devletleri ile sınırlı değildir. Amsterdam, şebeke tıkanıklığı gerekçesiyle yeni veri merkezi başvurularını ancak 2035'ten itibaren değerlendirecektir ve Hollanda'nın büyük bölümünde 70 MW üzeri bilişim kapasitesine veya 10 hektarı aşan alana sahip projeler yasaklanmıştır. Cushman & Wakefield, Güney Kore'de işletmedeki veri merkezi kapasitesinin yaklaşık %75'inin ve yeni projelerin %68'inin Büyük Seul bölgesinde yoğunlaştığını, bunun ticari bir yer seçimi tercihini iletim sorununa dönüştürdüğünü tespit etmektedir. Malezya'nın Johor koridorunda sınır açıkça üretim değil bağlantıdır: onaylı 51 projeden 17'si işletmede, 11'i inşa hâlindedir ve kapasite 2025 sonundaki 1.025 MW düzeyinden 2026 sonunda 2.000 MW'ın üzerine çıkarken 3.500 MW'lık bir proje hattı beklemektedir.
Kısıtın fiyatı çoktan oluşmuştur
Kıtlığın en net parasal karşılığı, Amerika Birleşik Devletleri'ndeki PJM Interconnection kapasite piyasasında görülmektedir. Takas fiyatı 2024/25 teslim yılı için 28,92 dolar/MW-gün iken 2026/27 için 329,17 dolar/MW-gün'e yükselmiş, bu ihaleden sonra iki ihale daha yapılmıştır. Aralık 2025'te sonuçlanan 2027/28 ihalesi, Federal Enerji Düzenleme Komisyonu'nun o dönemki tavanı olan 333,44 dolar/MW-gün ile kapanmış; 134.479 MW kapasite yaklaşık 16,4 milyar dolara temin edilmiş ve sonuç güvenilirlik gereğinin yaklaşık 6.500 MW altında kalmıştır. Sonuçları 14 Temmuz 2026'da açıklanan 2028/29 ihalesi ise 325 dolar/MW-gün ile, yani yeniden düzenleyici tavanın kendisinden kapanmıştır ve bu, üst üste tavandan kapanan üçüncü ihaledir; iki ihale arasında tavanın kendisi %2,5 düştüğü için manşet fiyattaki gerileme piyasadaki bir gevşemeyi değil, idari tavanın düşüşünü yansıtmaktadır. İhalede 138.318 MW kapasite yaklaşık 16,4 milyar dolara temin edilmiş, güvenilirlik gereğinin 6.831 MW altında kalınmış ve yalnızca yaklaşık 525 MW yeni kaynak temizlenmiştir; bunun 208 MW'ı mevcut santrallerdeki kapasite artışlarından gelmektedir. Utility Dive'ın aktardığı PJM benzetimine göre ihale, tavan olmasaydı 325 dolar yerine 555 dolar/MW-gün, yani %71 daha yüksek bir düzeyde kapanacaktı. Dolayısıyla fiyat gerilerken açık büyümüş ve PJM tarihinde ilk kez bölgenin tamamı üst üste iki ihalede güvenilirlik gereğini karşılayamamıştır. Bu sonucun kaynağı çıkarım değil, belgelenmiş bir hesaplamadır. PJM'in bağımsız piyasa izleyicisi Monitoring Analytics, son dört ihalede toplam 63,6 milyar dolarlık kapasite maliyetinin 29,4 milyar dolarının, yani %46'sının veri merkezi yükünden kaynaklandığını; 2025/26 ihalesindeki fiyat artışının %63'ünün veri merkezi kaynaklı olduğunu ve bunun tüketiciye 9,3 milyar dolar olarak yansıdığını hesaplamaktadır. PJM, rekor kapasite fiyatlarının bazı tüketici faturalarını yaklaşık %1,5-5 artıracağını öngörmektedir. Washington DC'de Pepco mesken faturaları Haziran 2025'ten itibaren ayda ortalama 21 dolar artmış, bu artışın yaklaşık yarısı kapasite fiyatlarından kaynaklanmıştır; Natural Resources Defense Council ise 2033'e kadar kümülatif 100-163 milyar dolarlık ilave maliyet öngörmektedir. Maliyetin faturaya geçmesi, fiziksel olmayan ikinci bir kısıt doğurmuştur. Data Center Watch, 2026'nın ilk aylarında yaklaşık 130 milyar dolar değerinde 75'ten fazla projenin engellendiğini ve 49 eyalette 833 muhalefet grubunun tespit edildiğini kaydetmektedir. Bu engellemelerin belgelenen gerekçesi şebeke kapasitesi değil, elektrik fiyatları, su kullanımı ve gürültü etrafında şekillenen yerel muhalefettir; dolayısıyla toplumsal kabul, bağlantı kısıtının kanıtı değil, onun yanında duran ayrı bir darboğazdır.
Yanıt: tahsis kuralları, esneklik ve kesintisiz arz
Sektörün tepkisi önce yer seçiminde görülmüştür. Bloom Energy'nin 2026 Güç Raporu, saha seçiminin artık müşteri yakınlığına veya fiber altyapıya göre değil, mevcut üretim kapasitesine ve enerjilendirme takvimine göre yapıldığı, geliştiricilerin en düşük maliyet yerine en erken enerjilendirmeyi optimize ettiği bir piyasayı tarif etmektedir. Tahsis kuralları da paralel biçimde değişmektedir. Avrupa Komisyonu, Elektrifikasyon Eylem Planı'nı (COM/2026/595) 17 Temmuz 2026'da Avrupa Şebekeler Paketi ile birlikte yayımlamıştır. Tahsisin neden belirleyici soru hâline geldiğini ise Ajans'ın Avrupa değerlendirmesi ortaya koymaktadır: şebeke bağlantısı çoğu üye ülkede kıttır ve veri merkezleri konut, sanayi elektrifikasyonu, elektrikli araç şarjı ve ısıtma ile aynı kapasite için yarışmaktadır. Bu, bir teknoloji sektörü sorunundan çok kamusal bir tahsis sorunudur. Birliğin bağlantı rehberi, önce başvurana öncelik ilkesinden önce hazır olana öncelik ilkesine geçişi, olgunluk kriterlerini, kilometre taşı ve ceza mekanizmalarını ve kuyruk temizliğini öngörmektedir. İrlanda'da düzenleyici kurum CRU, Dublin'deki bağlantı moratoryumunu Aralık 2025'te kaldırmış ve yerine yeni veri merkezlerinin tam talebini karşılayacak yerinde üretim veya depolama kurmasını, gerektiğinde şebekeye güç vermesini zorunlu kılan bir koşul getirmiştir; bu, kendi üretimini getirme ilkesinin bağlayıcı ilk düzenleyici uygulamasıdır. Singapur kapasiteyi tahsis yoluyla tayınlamakta, en az 200 MW'lık kapasite için açtığı çağrıda başvuruları 31 Mart 2026'da kapatmıştır. Çin, 2022'de başlattığı Doğu Verisi Batı Hesabı programı ile batıda sekiz hesaplama merkezi ve doğuda on veri kümesi kurarak hesaplama yükünü taşımaktadır. Körfez'de güç temini mimarisi projeye baştan gömülmektedir: Birleşik Arap Emirlikleri'ndeki 1 GW'lık Stargate kümesinin ilk 200 MW'lık dilimi 2026 üçüncü çeyrek hedefiyle ilerlemekte, Suudi Arabistan'ın Humain programı ise 2030'da 1,9 GW ve 2034'te 6,6 GW'lık ulusal hedefler içinde yer almaktadır; ancak açıklanan kapasitelerin devreye alınmış kapasite gibi okunmaması gerekmektedir. Mevcut çözüm seti, kısıtın fiziksel olmaktan önce kurumsal olduğunu göstermektedir. Duke Üniversitesi Nicholas Enstitüsü, mevcut Amerika Birleşik Devletleri şebekesinin yılda yalnızca %0,25 kısıntı karşılığında en az 76 GW yeni yükü, yani ülke tepe talebinin %10'unu soğurabileceğini hesaplamaktadır. Uluslararası Enerji Ajansı, şebeke güçlendirici teknolojilerle tek bir yeni hat inşa edilmeden 175 GW'a kadar iletim kapasitesinin açığa çıkarılabileceğini; Electricity 2026 çalışmasında ise tamamlayıcı çözümlerle kuyrukta bekleyen ileri aşama projelerin 1.200-1.600 GW'ının bağlanabileceğini belirtmektedir. PJM, veri merkezlerinin tepe talepte esnek çalışması koşuluyla bağlanmasına imkân veren çerçeveler geliştirmektedir. Sayaç arkası üretim, bağlantı kuyruğunda beklemeye alternatif bir güzergâh olarak sunulmakta; ancak Ajans'ın uydu takibi, Amerika Birleşik Devletleri'nde bu projelerin birçoğunun teknik ve finansal engeller nedeniyle hâlâ erken aşamada olduğunu göstermektedir. Kesintisiz arz tarafında büyük teknoloji şirketleri son bir yılda 10 GW'ı aşan olası yeni nükleer kapasiteyi sözleşmeye bağlamıştır: Three Mile Island 1. ünitesinin 835 MW ile yeniden devreye alınması yaklaşık 16 milyar dolarlık yirmi yıllık elektrik satış anlaşmasına dayanmakta ve 2027-2028 hedefiyle ilerlemekte; Google, Kairos Power ile Amerika Birleşik Devletleri'nin ilk kurumsal küçük modüler reaktör filosu anlaşmasını 500 MW için imzalamış; Amazon, X-energy'ye 700 milyon dolar yatırarak on iki adede kadar Xe-100 reaktörünü taahhüt etmiş; Meta ise Vistra, Oklo ve TerraPower ortaklıklarıyla 6,6 GW'a kadar kapasite hedefi açıklamıştır. IRENA'nın maliyet verisi, kesintisiz gücün mutlaka gaz veya nükleerden gelmesi gerektiği varsayımını da sorgulatmaktadır: depolamalı güneş 54-74 dolar/MWh bandında, yakıt ve emisyon dâhil yeni kombine çevrim gaz santrali ise 60-95 dolar/MWh bandında yer almaktadır. Yapay zekâ yatırım dalgasının hızını önümüzdeki dönemde çip arzı veya sermaye değil, bağlantı kuyrukları, transformatör teslim süreleri, türbin teslimat sıraları ve bunları tahsis eden kurallar belirleyecektir.
Metinde atıf yapılan kaynaklar: Uluslararası Enerji Ajansı — Key Questions on Energy and AI (Nisan 2026), Energy and AI (Dünya Enerji Görünümü Özel Raporu), Electricity 2026 ve Ajans'ın Avrupa'nın veri merkezi hedefleri önündeki enerji kısıtlarına ilişkin değerlendirmesi; Gartner 10 Haziran 2026 basın bülteni; Goldman Sachs Research; Rystad Energy ve Carbon Brief; Wood Mackenzie; IEEFA; Cushman & Wakefield; ERCOT büyük yük bağlantı başvurusu verileri; PJM Interconnection 2027/28 ve 2028/29 teslim yılı ihale raporları ile Utility Dive'ın ihale değerlendirmesi; PJM bağımsız piyasa izleyicisi Monitoring Analytics; Natural Resources Defense Council; Data Center Watch; Avrupa Komisyonu — Elektrifikasyon Eylem Planı (COM/2026/595) ve Avrupa Şebekeler Paketi; İrlanda Enerji Düzenleme Komisyonu (CRU); Duke Üniversitesi Nicholas Enstitüsü; IRENA — 2025 Yenilenebilir Üretim Maliyetleri; Bloom Energy 2026 Güç Raporu; gaz türbini rakamları için Bloomberg, Utility Dive ve IEEFA derlemeleri. Telif korumalı grafik ve tablolar yeniden üretilmemiştir. Analiz: UzEnergyNews.
WEEKLY INSIGHT #11 · WATER-ENERGY · GLOBAL8 July 2026 · 12 min read · EN/TR · Global
Water Is the Real Grid: The Unpriced Input That Quietly Governs the World's Power System
Electricity systems are planned around fuel, capital and megawatts, yet a single physical input constrains all of them at once. Water sits inside generation, cooling, digital infrastructure and the new fuels of the transition, and it is priced almost nowhere. This is the structural case for reading the global power system as a water system.
Every serious conversation about the energy transition is conducted in the language of electrons: gigawatts of capacity, terawatt-hours of demand, the cost of capital behind a project, the fuel mix behind a grid. That language is not wrong, but it is incomplete. Beneath the electron sits a physical input that no market prices consistently and that every part of the system depends on at the same time. Water generates electricity directly, cools the plants that generate the rest, sustains the data centres now consuming a fast-growing share of demand, and is embedded in the hydrogen and critical minerals meant to carry decarbonisation. When water becomes scarce, hot or contested, each of these functions degrades simultaneously. The proposition of this analysis is deliberately structural rather than seasonal: the global power system is, in a precise physical sense, a water system, and it is being managed as though water were free and unlimited.
Channel one: generation still runs on rivers
Hydropower remains the single largest source of low-carbon electricity in the world. The International Hydropower Association reports that hydro supplied 14.3 percent of global power, with generation rising roughly 10 percent in 2024 to 4,578 terawatt-hours as output recovered from a drought-driven trough; earlier IEA framing placed hydro nearer 17 percent of global electricity in 2020. Pumped-storage hydropower now exceeds 200 gigawatts of capacity, functioning as the world's largest fleet of grid-scale storage, a water battery that absorbs surplus generation and releases it on demand. A system this dependent on flowing water is a system exposed to the hydrological cycle, and 2023 demonstrated the exposure in full. The IEA's Electricity 2024 report documented a synchronous global hydro drought in which Canada, China, India, Türkiye, the United States and others experienced simultaneous shortfalls, pushing the global hydro capacity factor below 40 percent, its weakest level in three decades. The immediate consequence was not a gap in supply but a return to coal and gas to fill it, converting a water shortage directly into higher emissions.
Channel two: cooling turns heat into a water constraint
The larger and less visible dependency lies in thermal and nuclear generation, where water is the medium that carries away waste heat. In the United States, the USGS Circular 1441 assessment found that thermoelectric power accounts for roughly 41 percent of national water withdrawals, the single largest category. That water is not merely consumed; its availability and temperature determine how much a plant can produce. When rivers run low or warm, discharge limits and reduced thermal efficiency force plants to cut output precisely when demand for cooling peaks. The academic literature has quantified this derating with unusual clarity. Van Vliet and colleagues, writing in Nature Climate Change in 2012, projected summer generating-capacity reductions of 6.3 to 19 percent in Europe and 4.4 to 16 percent in the United States over 2031 to 2060. A later 2016 assessment, modelling more than twenty thousand plants worldwide, found that over 60 percent of the world's power plants could face reduced output between 2040 and 2069. The technology-specific water factors compiled by Macknick and colleagues in 2012 remain the standard basis for these calculations, translating each generating technology into cubic metres per megawatt-hour.
Channel three: the digital load arrives thirsty
A new and rapidly scaling demand centre has entered the same water balance. The IEA's Energy and AI analysis estimates that data-centre electricity consumption stood at around 415 terawatt-hours in 2024 and could reach roughly 945 terawatt-hours by 2030, a trajectory driven substantially by artificial intelligence. That electricity carries an embedded water cost through the power plants that supply it, and a direct one through on-site cooling. The Lawrence Berkeley National Laboratory's 2024 data-centre report quantified both: direct cooling water for United States data centres of approximately 66 billion litres in 2023, alongside indirect water use of around 800 billion litres tied to the electricity they consumed. At the level of individual workloads, the figures are equally concrete. The analysis by Li and colleagues estimated that training a model of GPT-3's scale consumed on the order of 700,000 litres of freshwater, and projected that global AI could withdraw 4.2 to 6.6 billion cubic metres of water by 2027. The significance is not the absolute volume, which remains modest against agriculture, but the location: this demand is being sited for latency, land and power, rarely for water availability, and increasingly in regions already under stress.
Channel four: the new fuels inherit an old scarcity
The fuels and materials intended to decarbonise the system carry their own water intensity, which is frequently omitted from transition planning. Green hydrogen is produced by electrolysis, and the work of Beswick and colleagues establishes that each kilogram of hydrogen requires around 9 litres of purified water as a direct input, with substantially more consumed in the purification stage that feeds it. Against an electrolyser fleet the IEA records growing from 1.4 gigawatts installed in 2023 toward roughly 520 gigawatts of announced capacity by 2030, the aggregate water requirement becomes a siting constraint rather than a rounding error. The mineral side is comparable. Lithium extraction in the Atacama, assessed by Marinova and colleagues, carries a water footprint of around 442 cubic-metre-equivalents per tonne, drawn from one of the most water-stressed basins on the planet, and the IEA's critical-minerals work notes that more than half of global lithium and copper production is located in areas of high water stress. The transition, in other words, does not escape the water constraint; in several respects it concentrates it, placing the highest water demands in precisely the places least able to meet them.
The geopolitical layer: shared rivers and mega-dams
These four channels operate within a scarcity that is already acute and increasingly bounded by borders. Mekonnen and Hoekstra estimate that roughly 4 billion people face severe water scarcity for at least one month a year, and the World Resources Institute's 2023 analysis identifies 25 countries living under extremely high water stress. Where the resource crosses a frontier, energy infrastructure becomes an instrument of state. The 2024 UN World Water Development Report notes that about 40 percent of the world's population lives in transboundary basins, yet only around one in five countries has a cooperation agreement covering shared waters. The single global framework, the 1997 UN Watercourses Convention, rests on two principles in permanent tension: equitable and reasonable use, and the obligation not to cause significant harm. A dam built upstream to generate power is, from downstream, a decision about water security taken by another state. The Grand Ethiopian Renaissance Dam on the Nile, the cascade of dams on the Mekong, the Indus system and the Euphrates-Tigris are the defining cases, and the scholarship of Zeitoun and Warner explains why outcomes on shared rivers are shaped less by law than by asymmetries of power. The most recent peer-reviewed work, by AghaKouchak and colleagues, projects elevated conflict risk in roughly 40 percent of transboundary basins over 2041 to 2050. Türkiye, Central Asia and Pakistan appear here not as the boundary of the story but as instances of a global pattern.
The reverse current, and why this matters for emerging markets
The dependency runs in both directions. Sanders and Webber found that roughly 12.6 percent of United States primary energy is embedded in the movement, treatment and heating of water, so that water constrains energy and energy constrains water in a single closed loop. Desalination illustrates the trade at its sharpest: the global fleet assessed by Jones and colleagues comprises 15,906 facilities producing around 95 million cubic metres per day, with energy the principal barrier to scaling it. For emerging and fast-growing power markets the implication is direct and unforgiving. These are the systems adding hydropower, thermal capacity and, increasingly, data-centre and industrial load fastest, and they are disproportionately located in water-stressed and transboundary settings where the margin for error is thinnest. A capacity plan that models fuel and finance but treats water as an unpriced constant is not a conservative plan; it is an incomplete one. The strategic conclusion of this analysis, and the premise of the water-energy column it opens, is that water risk belongs inside the core of energy planning rather than in an environmental appendix. The real grid has always been the water beneath it.
Sources cited in-text: IHA World Hydropower Outlook 2025; IEA Electricity 2024, Energy and AI, Global Hydrogen Review, and critical-minerals work; USGS Circular 1441; van Vliet et al. (2012, 2016); Macknick et al. (2012); LBNL 2024 Data Center Energy Report; Li et al. (2023); Beswick et al. (2021); Marinova et al. (2024); Mekonnen & Hoekstra (2016); WRI (2023); UN World Water Development Report 2024; UN Watercourses Convention (1997); Zeitoun & Warner (2006); AghaKouchak et al. (2026); Sanders & Webber (2012); Jones et al. (2019). Figures are cited from institutional sources; copyrighted charts and tables are not reproduced. Analysis by UzEnergyNews. This Weekly Insight opens the UzEnergyNews water-energy column.
Asıl Şebeke Sudur: Dünyanın Güç Sistemini Sessizce Yöneten Fiyatlanmamış Girdi
Elektrik sistemleri yakıt, sermaye ve megavat etrafında planlanır; oysa tek bir fiziksel girdi hepsini aynı anda kısıtlar. Su, üretimin, soğutmanın, dijital altyapının ve geçişin yeni yakıtlarının içindedir ve neredeyse hiçbir yerde fiyatlanmaz. Bu, küresel güç sistemini bir su sistemi olarak okumanın yapısal gerekçesidir.
Enerji geçişi üzerine yürütülen her ciddi tartışma elektronların dilinde yapılır: gigavat kapasite, teravatsaat talep, bir projenin arkasındaki sermaye maliyeti, bir şebekenin arkasındaki yakıt karışımı. Bu dil yanlış değildir, ancak eksiktir. Elektronun altında, hiçbir piyasanın tutarlı biçimde fiyatlamadığı ve sistemin her parçasının aynı anda bağımlı olduğu fiziksel bir girdi durur. Su elektriği doğrudan üretir, gerisini üreten santralleri soğutur, talebin hızla büyüyen bir bölümünü tüketen veri merkezlerini ayakta tutar ve karbonsuzlaşmayı taşıması beklenen hidrojen ile kritik minerallerin içine gömülmüştür. Su kıt, sıcak ya da ihtilaflı hale geldiğinde bu işlevlerin her biri aynı anda bozulur. Bu analizin savı bilinçli olarak mevsimsel değil yapısaldır: küresel güç sistemi, kesin fiziksel anlamda bir su sistemidir ve su bedava ve sınırsızmış gibi yönetilmektedir.
Birinci kanal: üretim hâlâ nehirlerle dönüyor
Hidroelektrik, dünyanın en büyük tekil düşük-karbon elektrik kaynağı olmayı sürdürüyor. Uluslararası Hidroelektrik Birliği (IHA), hidronun küresel gücün yüzde 14,3'ünü sağladığını ve üretimin kuraklık kaynaklı dipten toparlanarak 2024'te yaklaşık yüzde 10 artışla 4.578 teravatsaate ulaştığını bildiriyor; IEA'nın daha erken çerçevesi hidroyu 2020'de küresel elektriğin yüzde 17'sine yakın konumlandırmıştı. Pompajlı depolamalı hidroelektrik bugün 200 gigavatı aşan kapasiteyle dünyanın en büyük şebeke-ölçekli depolama filosu, yani fazla üretimi soğuran ve talep anında bırakan bir su bataryası işlevi görüyor. Akan suya bu denli bağımlı bir sistem hidrolojik döngüde açığa çıkan bir sistemdir ve 2023 bu açıklığı tam olarak gösterdi. IEA'nın Electricity 2024 raporu, Kanada, Çin, Hindistan, Türkiye, Amerika Birleşik Devletleri ve diğerlerinin eş zamanlı açık yaşadığı, küresel hidro kapasite faktörünü otuz yılın en düşük seviyesi olan yüzde 40'ın altına iten eş-zamanlı bir küresel hidro kuraklığı belgeledi. Sonuç arzda bir boşluk değil, onu doldurmak için kömür ve gaza dönüştü ve bir su kıtlığı doğrudan daha yüksek emisyona çevrildi.
İkinci kanal: soğutma ısıyı bir su kısıtına çevirir
Daha büyük ve daha az görünür bağımlılık, suyun atık ısıyı taşıyan ortam olduğu termik ve nükleer üretimde yatıyor. Amerika Birleşik Devletleri'nde USGS Circular 1441 değerlendirmesi, termoelektrik gücün ulusal su çekiminin yaklaşık yüzde 41'ini oluşturduğunu, yani en büyük tekil kategori olduğunu bulgulamıştır. Bu su yalnızca tüketilmez; onun mevcudiyeti ve sıcaklığı bir santralin ne kadar üretebileceğini belirler. Nehirler alçaldığında ya da ısındığında, boşaltım sınırları ve düşen termik verim santralleri tam da soğutma talebinin zirve yaptığı anda üretimi kısmaya zorlar. Akademik literatür bu kapasite kaybını alışılmadık bir netlikte ölçmüştür. Van Vliet ve arkadaşları, 2012'de Nature Climate Change'de, 2031-2060 döneminde yaz üretim-kapasitesi düşüşlerini Avrupa'da yüzde 6,3 ile 19, Amerika Birleşik Devletleri'nde yüzde 4,4 ile 16 arasında öngörmüştür. 2016 tarihli daha sonraki bir değerlendirme, yirmi binden fazla santrali modelleyerek, dünya santrallerinin yüzde 60'ından fazlasının 2040-2069 arasında üretim kaybıyla karşılaşabileceğini bulmuştur. Macknick ve arkadaşlarının 2012'de derlediği teknoloji-bazlı su faktörleri, her üretim teknolojisini megavatsaat başına metreküp cinsine çevirerek bu hesapların standart temeli olmayı sürdürüyor.
Üçüncü kanal: dijital yük susamış geliyor
Aynı su dengesine yeni ve hızla ölçeklenen bir talep merkezi girdi. IEA'nın Energy and AI analizi, veri merkezi elektrik tüketiminin 2024'te yaklaşık 415 teravatsaat olduğunu ve büyük ölçüde yapay zekâ tarafından sürülen bir gidişatla 2030'a kadar yaklaşık 945 teravatsaate ulaşabileceğini tahmin ediyor. Bu elektrik, onu sağlayan santraller üzerinden gömülü bir su maliyeti, yerinde soğutma yoluyla da doğrudan bir su maliyeti taşır. Lawrence Berkeley Ulusal Laboratuvarı'nın 2024 veri-merkezi raporu her ikisini de ölçtü: Amerika Birleşik Devletleri veri merkezleri için 2023'te yaklaşık 66 milyar litre doğrudan soğutma suyu ve tükettikleri elektriğe bağlı yaklaşık 800 milyar litre dolaylı su kullanımı. Tekil iş yükleri düzeyinde rakamlar aynı ölçüde somuttur. Li ve arkadaşlarının analizi, GPT-3 ölçeğinde bir modelin eğitiminin yaklaşık 700.000 litre tatlı su tükettiğini tahmin etmiş ve küresel yapay zekânın 2027'ye kadar 4,2 ile 6,6 milyar metreküp su çekebileceğini öngörmüştür. Önemli olan, tarım karşısında mütevazı kalan mutlak hacim değil, konumdur: bu talep gecikme, arazi ve güç için konumlandırılıyor, nadiren su mevcudiyeti için ve giderek zaten stres altındaki bölgelerde.
Dördüncü kanal: yeni yakıtlar eski bir kıtlığı devralıyor
Sistemi karbonsuzlaştırması beklenen yakıtlar ve malzemeler kendi su yoğunluklarını taşır ve bu, geçiş planlamasında çoğu kez atlanır. Yeşil hidrojen elektrolizle üretilir ve Beswick ile arkadaşlarının çalışması, her kilogram hidrojenin doğrudan girdi olarak yaklaşık 9 litre saf su gerektirdiğini, onu besleyen arındırma aşamasında ise çok daha fazlasının tüketildiğini ortaya koyar. IEA'nın 2023'te kurulu 1,4 gigavattan 2030'a doğru yaklaşık 520 gigavat duyurulan kapasiteye büyüdüğünü kaydettiği elektrolizör filosu karşısında, toplam su gereksinimi bir yuvarlama hatası değil bir konumlandırma kısıtı hâline gelir. Mineral tarafı da benzerdir. Marinova ve arkadaşlarının değerlendirdiği Atacama'daki lityum çıkarımı, gezegenin en su-stresli havzalarından birinden çekilen, ton başına yaklaşık 442 metreküp-eşdeğeri su ayak izi taşır ve IEA'nın kritik mineral çalışması küresel lityum ile bakır üretiminin yüzde 50'sinden fazlasının yüksek su-stresi bölgelerinde bulunduğunu belirtir. Başka bir deyişle geçiş su kısıtından kaçamaz; birçok bakımdan onu yoğunlaştırır ve en yüksek su taleplerini tam da onları karşılamaya en az elverişli yerlere yerleştirir.
Jeopolitik katman: paylaşılan nehirler ve mega-barajlar
Bu dört kanal, hâlihazırda keskin ve giderek sınırlarla çevrelenen bir kıtlığın içinde işler. Mekonnen ve Hoekstra, yaklaşık 4 milyar insanın yılın en az bir ayı şiddetli su kıtlığıyla karşı karşıya kaldığını tahmin ediyor ve Dünya Kaynakları Enstitüsü'nün 2023 analizi, aşırı-yüksek su stresi altında yaşayan 25 ülke belirliyor. Kaynak bir sınır geçtiğinde enerji altyapısı bir devlet aracı hâline gelir. 2024 tarihli BM Dünya Su Gelişme Raporu, dünya nüfusunun yaklaşık yüzde 40'ının sınır-aşan havzalarda yaşadığını, buna karşın ülkelerin yalnızca yaklaşık beşte birinin paylaşılan suları kapsayan bir işbirliği anlaşmasına sahip olduğunu belirtiyor. Tek küresel çerçeve olan 1997 BM Su Yolları Sözleşmesi, sürekli gerilim içinde iki ilkeye dayanır: hakkaniyetli ve makul kullanım ile önemli zarar vermeme yükümlülüğü. Yukarı kıyıda güç üretmek için kurulan bir baraj, aşağı kıyıdan bakıldığında, başka bir devlet tarafından su güvenliği hakkında alınmış bir karardır. Nil üzerindeki Büyük Etiyopya Rönesans Barajı, Mekong üzerindeki baraj dizisi, İndus sistemi ve Dicle-Fırat belirleyici örnek davalardır ve Zeitoun ile Warner'in çalışması, paylaşılan nehirlerdeki sonuçların hukuktan çok güç asimetrileri tarafından şekillendiğini açıklar. En güncel hakemli çalışma, AghaKouchak ve arkadaşlarına ait olan, 2041-2050 döneminde sınır-aşan havzaların yaklaşık yüzde 40'ında yükselen çatışma riski öngörüyor. Türkiye, Orta Asya ve Pakistan burada öykünün sınırı olarak değil, küresel bir örüntünün örnekleri olarak yer alır.
Ters akım ve bunun gelişen piyasalar için anlamı
Bağımlılık iki yönlü işler. Sanders ve Webber, Amerika Birleşik Devletleri birincil enerjisinin yaklaşık yüzde 12,6'sının suyun taşınmasına, arıtılmasına ve ısıtılmasına gömülü olduğunu bulmuştur; böylece su enerjiyi, enerji de suyu tek bir kapalı döngü içinde kısıtlar. Desalinasyon bu takası en keskin hâliyle gösterir: Jones ve arkadaşlarının değerlendirdiği küresel filo, günde yaklaşık 95 milyon metreküp üreten 15.906 tesisten oluşur ve enerji, onu ölçeklemenin başlıca engelidir. Gelişen ve hızla büyüyen güç piyasaları için sonuç doğrudan ve affetmezdir. Hidroelektrik, termik kapasite ve giderek veri-merkezi ile sanayi yükünü en hızlı ekleyen sistemler bunlardır ve hata payının en ince olduğu su-stresli ve sınır-aşan ortamlarda orantısız biçimde bulunurlar. Yakıtı ve finansmanı modelleyen ancak suyu fiyatlanmamış bir sabit gibi ele alan bir kapasite planı ihtiyatlı bir plan değil, eksik bir plandır. Bu analizin ve açtığı su-enerji kolonunun stratejik sonucu şudur: su riski, bir çevre ekine değil, enerji planlamasının merkezine aittir. Asıl şebeke, her zaman onun altındaki su olmuştur.
Metin içi atıflı kaynaklar: IHA World Hydropower Outlook 2025; IEA Electricity 2024, Energy and AI, Global Hydrogen Review ve kritik mineral çalışması; USGS Circular 1441; van Vliet vd. (2012, 2016); Macknick vd. (2012); LBNL 2024 Veri Merkezi Enerji Raporu; Li vd. (2023); Beswick vd. (2021); Marinova vd. (2024); Mekonnen ve Hoekstra (2016); WRI (2023); BM Dünya Su Gelişme Raporu 2024; BM Su Yolları Sözleşmesi (1997); Zeitoun ve Warner (2006); AghaKouchak vd. (2026); Sanders ve Webber (2012); Jones vd. (2019). Rakamlar kurumsal kaynaklardan aktarılmıştır; telifli grafik ve tablolar yeniden üretilmez. Analiz: UzEnergyNews. Bu Weekly Insight, UzEnergyNews su-enerji kolonunu açıyor.
WEEKLY INSIGHT #10 · RELIABILITY · GLOBAL4 July 2026 · 11 min read · EN/TR · Global
Grids Under Summer Stress: How the 2026 Heat Season Became a Live Test of the Network
Last week this column argued that the grid has become the binding constraint on the energy transition, and that the constraint is fundamentally one of investment. This week the same constraint shows its near-term face, which is reliability. Across the Northern Hemisphere the summer of 2026 has turned the network into a live stress test: intensifying heatwaves are lifting demand for cooling at the same moment that heat reduces the capacity of thermal plants, transmission lines and hydropower to supply it. The result is a narrowing reserve margin and a succession of emergency interventions. This analysis reads the 2026 season as a system-level event, sets out the mechanism by which heat compresses supply and inflates demand at once, and explains why storage, demand response and interconnection are becoming the shock absorbers of a grid built for a cooler, lower-demand age.
The thesis: the constraint operates now, through reliability
The investment gap described in Weekly Insight #9 is a structural fact that resolves over a decade. Its operational consequence, however, is felt every summer. A network sized and configured for the load curve of an earlier, cooler era is now being asked to carry a peak that is both higher and differently shaped. Three forces are converging on the same hours of the same days: intensifying heatwaves, a structural rise in cooling and other new demand, and a grid whose margin of spare capacity has been eroded by a decade in which generation investment outran network investment. Where those three forces meet, the outcome is not an abstract financing shortfall but a concrete reliability question, answered in real time by grid operators through emergency orders, curtailments and appeals for restraint.
The 2026 summer is the clearest demonstration of this to date. It is useful precisely because it is not a forecast. It is an observed event, unfolding across several of the world's largest power systems at once, and it allows the reserve-margin logic to be read directly from the record rather than from a model.
1. The United States: PJM and a record peak
PJM Interconnection, the largest power system in the United States, serving some 65 million people across thirteen states, entered the first days of July 2026 forecasting a demand of 166,147 MW — a level that would exceed its all-time summer record of 165,563 MW, set during the heat wave of 2006 and unbroken for twenty years. In response, the United States Department of Energy issued two emergency orders, effective from 30 June through 3 July, that authorised measures a grid operator does not take lightly.
A Generation Dispatch Order directed PJM to run specified units at maximum output and granted temporary relief from environmental permit limits on sulphur dioxide, nitrogen oxides and other emissions.
A Backup Generation Order authorised PJM to direct the curtailment of data centres and other large consumers with at least 50 MW of peak load, requiring them to switch to their own backup generation within fifteen minutes of an emergency signal.
Operationally, PJM issued a Maximum Generation Alert (defer maintenance, cancel testing, bring all capacity online), a Load Management Alert and a Low Voltage Alert.
The detail that matters most is the curtailment of data centres. In PJM's territory, which includes the vast data-centre cluster of Northern Virginia, the fastest-growing source of new demand has become, in the same season, one of the first resources called upon to reduce it. That is the reliability constraint made visible: a grid that must actively manage its largest new loads to hold the system together on the hottest afternoons.
2. Europe: when heat cuts supply as it lifts demand
Europe's June–July 2026 heatwave illustrated the second half of the mechanism — the way in which the same heat that raises demand simultaneously reduces the system's ability to supply it. Several effects arrived together.
Thermal derating. Warm river water is less able to cool thermal plants. In France, unit two of the Golfech nuclear station shut down late on 22 June when the river used for cooling grew too hot, with other reactors ramped down or constrained through the week. In the United Kingdom, five gas plants reported output reductions that together removed about 2.5 GW from supply.
Cooling demand at a multi-decade high. Cooling demand across the continent reached its highest level in at least forty-five years. Air-conditioning, historically installed in only about a fifth of European homes, is spreading quickly; the number of UK homes using it has roughly doubled since 2022.
Prices at the extreme. On 24 June, Belgium set a price record above €1 per kWh at sunset, as conventional plants ran flat out and solar output faded into the evening cooling peak.
The evening detail is the important one. Cooling demand peaks late in the day, as heat accumulates and solar generation declines, so the system is most stressed at precisely the hour when its largest zero-fuel resource withdraws. This is the shape of the modern summer peak, and it is the shape a grid designed around a winter-heating peak was never built to serve.
3. Türkiye: summer is now the peak
Türkiye is the clearest case within our own coverage of a structural shift from a winter to a summer system, and it carries the reliability logic directly into the Eurasian corridor. Since 2008, the country's highest hourly electricity consumption has occurred in summer rather than winter, driven by the spread of air-conditioning under rising average temperatures.
Indicator
Figure
Note
Record hourly demand
> 59 GWh (28 July 2025)
18% of it driven by cooling
Cooling electricity use, 2024
10 TWh (+19% on 2023)
vs. 2.8% overall demand growth
Cooling growth rate, 2022–2024
12% a year
four times the overall rate
Winter–summer peak gap
up 12-fold since 2008
now exceeds 9 GWh
Sensitivity to heat
~0.77 GW per 1°C
average additional capacity need
Cooling use by 2030
could double to 20 TWh
peak demand up ~50% by 2035
The single figure that captures the reliability problem is the sensitivity: each additional degree of temperature translates, on average, into a need for about 0.77 GW of additional generating capacity. A grid whose peak is set by the weather, and whose weather is warming, faces a reserve-margin question that recurs and intensifies every summer. The near-doubling of cooling demand projected by 2030, and the roughly 50 percent rise in peak demand possible by 2035, define the scale of the network response required.
4. Central Asia: an ageing grid meets a hotter summer
The emerging-market dimension is where the stress is most acute, because it compounds a hotter summer with a weaker network. Much of Central Asia's transmission and distribution infrastructure dates from the Soviet era and has passed its useful life, and the region already runs close to balance. Kazakhstan closed 2025 with generation of about 123.1 billion kWh against consumption of about 124.6 billion kWh — a deficit of more than one billion kWh, covered by imports. A system operating at that margin has little tolerance for a summer demand spike layered on top of the region's better-known winter difficulties, and the underlying condition of the network limits how quickly new supply can be connected to relieve it. The same reserve-margin logic that produces emergency orders in the United States produces, in an under-invested system, a harder and more persistent constraint.
5. The shock absorbers: storage, demand response and interconnection
The response to summer stress is not only more generation; it is a set of resources that reshape the peak itself. Three are becoming decisive.
Battery storage. Storage shifts midday solar into the evening cooling peak — the exact hours when the system is tightest. Global energy-storage capacity reached about 275 GWh in 2025, up roughly 61 percent on the previous year, with more than 350 GWh expected to be added in 2026. California alone now holds more than 17,000 MW of battery capacity and has not called a grid emergency in three summers despite record heat — a direct demonstration of storage as a reliability resource.
Demand response. The PJM order is itself a demand-response mechanism: large loads paid or directed to reduce consumption at the peak. Formalised through virtual power plants and reliability reserves, demand response converts the largest consumers from a source of stress into a source of flexibility.
Interconnection. A wider network shares reserves across regions whose peaks do not coincide. This is the operational case for the projects covered elsewhere on this platform — the Central Asian common electricity market and the Trans-Caspian corridor — which turn isolated, tightly balanced systems into a pooled one with more margin.
Each of these is the operating-side counterpart to the investment described in Weekly Insight #9. The network must not only be built; it must be built to bend under a peak that is rising and changing shape.
What this means for operators, investors and regulators
For operators. The reserve margin is no longer a static planning number but a variable managed in real time. The tools that matter most — storage dispatch, demand-response contracts, cross-border imports — are increasingly the ones that address the evening cooling peak specifically, not average annual load.
For investors. The summer peak defines where the returns are. Assets that deliver energy or flexibility into the late-afternoon and evening window — batteries, dispatchable capacity, interconnectors — carry a value that a flat annual price does not capture. The IEA's judgement that the next five years will add roughly 50 percent more electricity demand per year than the past decade, with cooling among the central drivers and most of the growth in emerging economies, is the demand-side case for that investment.
For regulators. Reliability standards, capacity mechanisms and tariff structures written for a winter-peaking, lower-demand system require revision for a summer-peaking, cooling-driven one. The emergency orders of 2026 are a signal that the ordinary tools are being stretched to their limits.
The bottom line. The 2026 heat season is a live test of a grid built for a cooler, lower-demand age. Heat lifts demand for cooling while it derates the plants, lines and reservoirs meant to meet that demand, and the reserve margin narrows at exactly the wrong moment. The near-term face of the grid constraint is therefore reliability, not finance — though the two are the same constraint seen over different horizons. Storage, demand response and interconnection are the instruments that absorb the shock, and the systems that deploy them fastest, from PJM to Türkiye to the ageing networks of Central Asia, will be the ones that pass the test the summer has set.
Sources: U.S. Department of Energy emergency orders (30 June–3 July 2026) and PJM Interconnection operational alerts (reported by US News, Utility Dive, The Hill). Europe: MIT Technology Review; Euronews; 2026 European heatwaves record. Türkiye: Ember (Solar and flexibility: Türkiye's rising cooling challenge, 2025) and CEEnergyNews. Central Asia: Caspian Policy Center; Times of Central Asia. System context: International Energy Agency, Electricity 2026. Storage: California Energy Commission; industry storage-capacity reporting 2025–2026. This Weekly Insight extends Weekly Insight #9 (The Global Grid Investment Wave) and the World Electricity Ecosystem 2025–2050 dataset (UzEnergyNews Open Data, CC BY 4.0). Figures reflect public sources as of early July 2026.
Şebekeler Yaz Stresinde: 2026 Sıcak Sezonu Şebekenin Canlı Sınavına Nasıl Dönüştü
Geçen hafta bu köşe, şebekenin enerji dönüşümünün bağlayıcı kısıtı haline geldiğini ve bu kısıtın özünde bir yatırım meselesi olduğunu savundu. Bu hafta aynı kısıt yakın-vadeli yüzünü gösteriyor: güvenilirlik. Kuzey Yarımküre boyunca 2026 yazı şebekeyi canlı bir stres testine çevirdi: yoğunlaşan sıcak dalgaları soğutma talebini yükseltirken, aynı sıcaklık termal santrallerin, iletim hatlarının ve hidroelektriğin bu talebi karşılama kapasitesini düşürüyor. Sonuç, daralan bir yedek marjı ve peş peşe gelen acil müdahaleler. Bu analiz 2026 sezonunu sistem düzeyinde bir olay olarak okuyor, sıcağın arzı sıkıştırırken talebi aynı anda nasıl şişirdiği mekanizmasını ortaya koyuyor ve daha serin, düşük-talepli bir çağa göre kurulmuş bir şebekede depolamanın, talep yanıtının ve ara-bağlantının neden şok emiciye dönüştüğünü açıklıyor.
Ana tez: kısıt şimdi, güvenilirlik üzerinden işliyor
Weekly Insight #9'da anlatılan yatırım açığı, on yıla yayılan yapısal bir gerçek. Ne var ki işletme sonucu her yaz hissediliyor. Daha serin bir çağın yük eğrisine göre boyutlandırılmış ve yapılandırılmış bir şebekeden, artık hem daha yüksek hem de biçimi farklı bir zirveyi taşıması bekleniyor. Üç kuvvet aynı günlerin aynı saatlerinde birleşiyor: yoğunlaşan sıcak dalgaları, soğutma ve diğer yeni taleplerdeki yapısal artış, ve üretim yatırımının şebeke yatırımını geride bıraktığı on yılda yedek kapasite marjı aşınmış bir şebeke. Bu üç kuvvetin buluştuğu yerde sonuç soyut bir finansman açığı değil, somut bir güvenilirlik sorusu; şebeke operatörleri bu soruyu gerçek zamanlı olarak acil emirler, kısıtlamalar ve tasarruf çağrılarıyla yanıtlıyor.
2026 yazı bunun bugüne dek en net gösterimi. Değeri tam da bir tahmin olmamasından geliyor. Dünyanın en büyük güç sistemlerinin birçoğunda aynı anda yaşanan gözlemlenmiş bir olay; yedek-marjı mantığının bir modelden değil, doğrudan kayıttan okunmasını sağlıyor.
1. Amerika Birleşik Devletleri: PJM ve rekor zirve
ABD'nin en büyük güç sistemi olan ve on üç eyalette yaklaşık 65 milyon kişiye hizmet veren PJM Interconnection, Temmuz 2026'nın ilk günlerine 166.147 MW'lık bir talep öngörüsüyle girdi — bu düzey, 2006 sıcak dalgasında kurulan ve yirmi yıldır kırılamayan 165.563 MW'lık tüm zamanların yaz rekorunu aşacaktı. Buna karşılık ABD Enerji Bakanlığı, 30 Haziran–3 Temmuz arasında geçerli iki acil emir çıkardı; bunlar bir şebeke operatörünün kolayca başvurmadığı önlemlere yetki verdi.
Üretim Sevk Emri, PJM'e belirli üniteleri azami çıktıyla çalıştırma talimatı verdi ve kükürt dioksit, azot oksitler ve diğer emisyonlara ilişkin çevre izni sınırlarında geçici muafiyet tanıdı.
Yedek Üretim Emri, PJM'e en az 50 MW zirve yükü olan veri merkezlerini ve diğer büyük tüketicileri kısıtlama yetkisi verdi; bunların acil sinyalden itibaren on beş dakika içinde kendi yedek üretimlerine geçmesini şart koştu.
İşletmede PJM bir Azami Üretim Uyarısı (bakımı ertele, testi iptal et, tüm kapasiteyi devreye al), bir Yük Yönetimi Uyarısı ve bir Düşük Gerilim Uyarısı yayımladı.
En önemli ayrıntı veri merkezlerinin kısıtlanması. Kuzey Virginia'nın devasa veri merkezi kümesini kapsayan PJM bölgesinde, yeni talebin en hızlı büyüyen kaynağı, aynı sezon içinde talebi azaltmak için ilk başvurulan kaynaklardan biri haline geldi. Güvenilirlik kısıtı görünür olmuş demektir: en sıcak öğle sonralarında sistemi bir arada tutmak için en büyük yeni yüklerini aktif olarak yönetmek zorunda kalan bir şebeke.
2. Avrupa: sıcak talebi yükseltirken arzı kestiğinde
Avrupa'nın Haziran–Temmuz 2026 sıcak dalgası, mekanizmanın ikinci yarısını gösterdi — talebi yükselten aynı sıcağın, sistemin bu talebi karşılama becerisini eş zamanlı olarak düşürmesi. Birkaç etki aynı anda geldi.
Termal derating (çıktı düşürme). Isınan nehir suyu termal santralleri soğutmakta daha yetersiz. Fransa'da Golfech nükleer santralinin ikinci ünitesi, soğutma için kullanılan nehir fazla ısınınca 22 Haziran gecesi kapandı; hafta boyunca başka reaktörler de düşürüldü veya kısıtlandı. Birleşik Krallık'ta beş gaz santrali çıktı düşüşleri bildirdi ve bunlar toplamda arzdan yaklaşık 2,5 GW eksiltti.
Onyılların en yükseğinde soğutma talebi. Kıta genelinde soğutma talebi en az kırk beş yılın en yüksek düzeyine ulaştı. Tarihsel olarak Avrupa konutlarının yalnız beşte birinde bulunan klima hızla yayılıyor; Birleşik Krallık'ta klima kullanan konut sayısı 2022'den bu yana kabaca ikiye katlandı.
Uç noktada fiyatlar. 24 Haziran'da Belçika, konvansiyonel santraller sonuna kadar çalışırken ve güneş üretimi akşam soğutma zirvesine doğru sönerken, gün batımında kWh başına 1 euronun üzerinde bir fiyat rekoru kırdı.
Önemli olan akşam ayrıntısı. Soğutma talebi, sıcaklık biriktikçe ve güneş üretimi düştükçe günün geç saatlerinde zirve yapıyor; yani sistem, en büyük yakıtsız kaynağının çekildiği saatte en çok zorlanıyor. Modern yaz zirvesinin biçimi bu; kış-ısınma zirvesine göre tasarlanmış bir şebekenin karşılamak için kurulmadığı biçim.
3. Türkiye: zirve artık yazda
Türkiye, kendi kapsama alanımız içinde kış sisteminden yaz sistemine yapısal geçişin en net örneği ve güvenilirlik mantığını doğrudan Avrasya koridoruna taşıyor. 2008'den bu yana ülkenin en yüksek saatlik elektrik tüketimi, artan ortalama sıcaklıklar altında klimanın yayılmasıyla kış yerine yaz aylarında gerçekleşiyor.
Gösterge
Değer
Not
Rekor saatlik talep
> 59 GWh (28 Temmuz 2025)
%18'i soğutma kaynaklı
Soğutma elektrik tüketimi, 2024
10 TWh (+%19 / 2023)
toplam talep büyümesi %2,8'ken
Soğutma büyüme hızı, 2022–2024
yılda %12
toplam oranın dört katı
Kış–yaz zirve farkı
2008'den beri 12 kat
artık 9 GWh'ı aşıyor
Sıcaklığa duyarlılık
~1°C başına 0,77 GW
ortalama ek kapasite ihtiyacı
2030'da soğutma tüketimi
20 TWh'a ikiye katlanabilir
2035'e zirve ~%50 artabilir
Güvenilirlik sorununu tek başına yakalayan rakam, duyarlılık: her ek sıcaklık derecesi ortalama olarak yaklaşık 0,77 GW ek üretim kapasitesi ihtiyacına dönüşüyor. Zirvesi hava tarafından belirlenen ve havası ısınan bir şebeke, her yaz tekrar eden ve şiddetlenen bir yedek-marjı sorusuyla karşı karşıya. 2030'a kadar soğutma talebinin neredeyse ikiye katlanması öngörüsü ve 2035'e kadar zirve talebinde olası %50'lik artış, gereken şebeke yanıtının ölçeğini tanımlıyor.
4. Orta Asya: yaşlanan bir şebeke daha sıcak bir yazla buluşuyor
Gelişen-pazar boyutu, stresin en keskin olduğu yer; çünkü daha sıcak bir yazı daha zayıf bir şebekeyle birleştiriyor. Orta Asya'nın iletim ve dağıtım altyapısının büyük kısmı Sovyet döneminden kalma ve faydalı ömrünü aşmış durumda; bölge zaten dengeye yakın çalışıyor. Kazakistan 2025'i yaklaşık 123,1 milyar kWh üretime karşı yaklaşık 124,6 milyar kWh tüketimle kapattı — bir milyar kWh'ı aşan, ithalatla karşılanan bir açık. Bu marjda çalışan bir sistemin, bölgenin daha bilinen kış zorluklarının üzerine binen bir yaz talep sıçramasına toleransı çok az; ve şebekenin altyapı durumu, açığı gidermek için yeni arzın ne kadar hızlı bağlanabileceğini sınırlıyor. ABD'de acil emirler üreten aynı yedek-marjı mantığı, yeterince yatırım yapılmamış bir sistemde daha sert ve daha kalıcı bir kısıt üretiyor.
5. Şok emiciler: depolama, talep yanıtı ve ara-bağlantı
Yaz stresine yanıt yalnız daha fazla üretim değil; zirvenin kendisini yeniden biçimlendiren bir dizi kaynak. Üçü belirleyici hale geliyor.
Batarya depolama. Depolama, öğle güneşini akşam soğutma zirvesine — sistemin en sıkıştığı saatlere — kaydırıyor. Küresel enerji-depolama kapasitesi 2025'te yaklaşık 275 GWh'a ulaştı, bir önceki yıla göre kabaca %61 artış; 2026'da 350 GWh'ın üzerinde ekleme bekleniyor. Yalnız Kaliforniya artık 17.000 MW'ı aşan batarya kapasitesine sahip ve rekor sıcaklara rağmen üç yazdır bir şebeke acil durumu ilan etmedi — depolamanın bir güvenilirlik kaynağı olduğunun doğrudan kanıtı.
Talep yanıtı. PJM emri, kendisi bir talep-yanıtı mekanizması: büyük yüklerin zirvede tüketimi azaltmak için ücretlendirilmesi veya yönlendirilmesi. Sanal santraller ve güvenilirlik yedekleri üzerinden kurumsallaşan talep yanıtı, en büyük tüketicileri bir stres kaynağından bir esneklik kaynağına dönüştürüyor.
Ara-bağlantı. Daha geniş bir şebeke, zirveleri çakışmayan bölgeler arasında yedekleri paylaşır. Bu, bu platformda başka yerlerde ele alınan projelerin — Orta Asya ortak elektrik piyasası ve Trans-Hazar koridoru — işletme gerekçesidir; izole ve dar dengeli sistemleri, daha fazla marjı olan havuzlanmış bir sisteme çevirirler.
Bunların her biri, Weekly Insight #9'da anlatılan yatırımın işletme-tarafı karşılığı. Şebekenin yalnız kurulması değil; yükselen ve biçim değiştiren bir zirve altında esneyebilecek şekilde kurulması gerekiyor.
Operatörler, yatırımcılar ve regülatörler için anlamı
Operatörler. Yedek marjı artık statik bir planlama sayısı değil, gerçek zamanlı yönetilen bir değişken. En çok işe yarayan araçlar — depolama sevki, talep-yanıt sözleşmeleri, sınır ötesi ithalat — giderek yıllık ortalama yükü değil, özellikle akşam soğutma zirvesini hedefleyenler.
Yatırımcılar. Getirilerin nerede olduğunu yaz zirvesi tanımlıyor. Enerjiyi veya esnekliği geç öğleden sonra ve akşam penceresine sunan varlıklar — bataryalar, sevk-edilebilir kapasite, ara-bağlantılar — düz bir yıllık fiyatın yakalamadığı bir değer taşıyor. IEA'nın, önümüzdeki beş yılın geçen on yıla göre yılda kabaca %50 daha fazla elektrik talebi ekleyeceği, soğutmanın merkezi itici güçler arasında olduğu ve büyümenin çoğunun gelişen ekonomilerde gerçekleşeceği değerlendirmesi, bu yatırımın talep-tarafı gerekçesidir.
Regülatörler. Kış-zirveli, düşük-talepli bir sisteme göre yazılmış güvenilirlik standartları, kapasite mekanizmaları ve tarife yapıları; yaz-zirveli, soğutma-güdümlü bir sistem için yeniden yazılmayı gerektiriyor. 2026'nın acil emirleri, olağan araçların sınırlarına kadar zorlandığının bir işareti.
Sonuç. 2026 sıcak sezonu, daha serin ve düşük-talepli bir çağa göre kurulmuş bir şebekenin canlı bir sınavı. Sıcak, soğutma talebini yükseltirken bu talebi karşılaması gereken santralleri, hatları ve rezervuarları çıktı-düşürmeye zorluyor ve yedek marjı tam yanlış anda daralıyor. Bu nedenle şebeke kısıtının yakın-vadeli yüzü finansman değil güvenilirlik — gerçi ikisi, farklı ufuklardan bakılan aynı kısıt. Depolama, talep yanıtı ve ara-bağlantı şoku emen araçlar; bunları en hızlı devreye alan sistemler, PJM'den Türkiye'ye ve Orta Asya'nın yaşlanan şebekelerine, yazın kurduğu sınavı geçenler olacak.
Kaynak: ABD Enerji Bakanlığı acil emirleri (30 Haziran–3 Temmuz 2026) ve PJM Interconnection işletme uyarıları (US News, Utility Dive, The Hill aktarımıyla). Avrupa: MIT Technology Review; Euronews; 2026 Avrupa sıcak dalgaları kaydı. Türkiye: Ember (Solar and flexibility: Türkiye's rising cooling challenge, 2025) ve CEEnergyNews. Orta Asya: Caspian Policy Center; Times of Central Asia. Sistem bağlamı: Uluslararası Enerji Ajansı, Electricity 2026. Depolama: California Energy Commission; 2025–2026 sektör depolama-kapasitesi raporlaması. Bu Weekly Insight, Weekly Insight #9'u (Küresel Şebeke Yatırımı Dalgası) ve Dünya Elektrik Ekosistemi 2025–2050 veri setini (UzEnergyNews Açık Veri, CC BY 4.0) genişletir. Rakamlar Temmuz 2026 başı itibarıyla kamu kaynakları yansıtır.
WEEKLY INSIGHT #9 · GRID · GLOBAL27 June 2026 · 10 min read · EN/TR · Global
The Global Grid Investment Wave: Why the Network Is Now the Binding Constraint
Generation investment has pulled decisively ahead of network investment, and the gap has turned the grid into the binding constraint on the energy transition. The world now invests roughly $400 billion a year in electricity networks, against close to $1 trillion in new generation, and the International Energy Agency judges that grid spending must approximately double to more than $600 billion a year by 2030 if the projected build-out is to be delivered. This Weekly Insight extends the network section of last week's World Electricity Ecosystem dataset, sets out where the investment is flowing today, and explains why the widest gap lies in the emerging economies — where the obstacle is the cost of capital and the state of the network rather than the willingness to build.
Generation has outrun the grid
Over the past decade the relationship between the two halves of the power system has inverted. Investment in new generation, led by solar and wind, has expanded rapidly, while investment in the networks that must carry that generation to consumers has remained broadly flat. According to the International Energy Agency's World Energy Investment 2025, the world now commits on the order of $1 trillion a year to new generation capacity, against approximately $400 billion a year to electricity grids — a ratio of roughly 2.5 to 1 in favour of generation. For a decade the network figure barely moved, even as the volume of capacity seeking connection multiplied.
The consequence of that imbalance is measurable. The Agency estimates that grid investment must approximately double, to more than $600 billion a year by 2030, simply to keep pace with the generation already planned and the electrification of transport, heating and industry now under way. The transition, in other words, is no longer constrained chiefly by the cost or availability of clean generation. It is constrained by the capacity of the network to absorb that generation and deliver it to demand.
This is the central observation that this Weekly Insight develops from the network section of last week's World Electricity Ecosystem dataset, which set out a generation fleet projected to nearly triple by 2050. A fleet of that scale cannot be connected by generation investment alone.
The evidence is the connection queue
The clearest evidence that the grid has become the binding constraint is the volume of completed and advanced-stage generation now waiting to connect. The International Energy Agency reports that around 1,500 GW of advanced renewable projects are held in grid connection queues worldwide — roughly twice the renewable capacity currently in operation — while the total queue, including earlier-stage projects, exceeds 3,000 GW. These are projects that have, in many cases, secured finance and land and cannot proceed because the network cannot yet accommodate them.
The waiting time has lengthened in step with the queue. The typical interval between a connection request and an operational connection rose from around three years in 2015 to five years in 2022, on the Agency's figures. The constraint is therefore not abstract. It is a queue of ready projects, measured in gigawatts and in years, that represents generation already financed but not yet able to reach the market.
For context, total clean-energy investment now runs at approximately $2.2 trillion a year, around twice the figure committed to fossil fuels. The clean build-out is not short of capital in aggregate. What it lacks, increasingly, is the network capacity to connect the plant that capital has already funded.
Where the investment is flowing
The investment that is being made is concentrated in a small number of large markets, and the pattern is instructive.
China is the clear leader. State Grid Corporation of China committed a record of approximately $89 billion to its networks in 2025, and together with China Southern Power Grid the national figure reached an estimated $95 billion to $100 billion for the year. The two operators have signalled combined spending of around $140 billion for 2026, and State Grid's five-year plan for 2026 to 2030 envisages approximately $574 billion of network investment, an increase of close to 40 percent on the preceding period.
The United States is the second large pole. On the Edison Electric Institute's figures, transmission and distribution investment ran at approximately $93 billion in 2024, while total sector capital expenditure — generation, networks and the rest — reached a record of around $208 billion in 2025, with more than $1.1 trillion projected across 2025 to 2029. The distinction matters: the $93 billion figure refers to networks specifically, the $208 billion to the sector as a whole.
The European Union has set its commitment through the Grids Package, which envisages €584 billion of network investment across 2020 to 2030 and €1.2 trillion across 2024 to 2040 — on the order of €65 billion to €71 billion a year. Among individual operators, Iberdrola commits approximately €12 billion a year to its networks, Enel approximately €11 billion and E.ON approximately €7 billion. These are the figures associated with systems that are, on the whole, adequately funded.
Region / operator
Annual grid investment
Year / basis
World
~$400 bn/yr (need: >$600 bn/yr by 2030)
2024–25, IEA
China (State Grid + China Southern)
~$95–100 bn/yr; ~$140 bn planned
2025; 2026 plan
China — State Grid five-year plan
~$574 bn total (≈ +40%)
2026–2030
United States — transmission & distribution
~$93 bn/yr
2024, EEI
United States — total sector capex
~$208 bn (record)
2025, EEI
European Union (Grids Package)
~€65–71 bn/yr
2020–2040
Iberdrola (network capex)
~€12 bn/yr
2025
Enel (network capex)
~€11 bn/yr
2025
E.ON (network capex)
~€7 bn/yr
2025
The gap is widest in the emerging economies
The markets that are well funded are not, for the most part, the markets where demand is growing fastest. In much of the developing world the network is older, less efficient and persistently underfunded relative to the generation it is expected to carry. The contrast with the figures above is stark. Africa, for instance, requires investment of the order of $30 billion a year by 2030 to reach universal electricity access, yet its networks remain chronically under-resourced, with the result that new capacity cannot be connected at the pace that demand requires.
This is the same finding that anchors our flagship Emerging Energy Outlook 2026. The obstacle in these economies is not the willingness to build. Almost every country examined in that report maintains a renewables target and an electrification programme, and capital is available in aggregate at the global level. The constraint lies elsewhere, and it has two components that compound one another.
Why capital costs more where it is needed most
The first component is the cost of capital, and its effect is direct and measurable. Utility-scale solar in the advanced economies is financed at a weighted average cost of capital of approximately 4.7 to 6.4 percent. In markets such as Kenya and Senegal the equivalent figure is approximately 8.5 to 9 percent, and across the developing economies as a whole the cost of capital for generation runs at two to three times the advanced-economy level — reaching as much as four times for transmission and distribution assets. The country risk premium alone accounts for an estimated 60 to 90 percent of the cost of capital faced by African projects.
The mechanism deserves to be stated plainly, because it is often obscured. A higher cost of capital raises the delivered cost of every kilowatt-hour before a single unit of energy is produced, since a network or generation asset is overwhelmingly an upfront investment recovered over decades. Where finance is twice as expensive, the same physical project delivers electricity at a materially higher price, not because the equipment costs more but because the money does. This is why the investment gap cannot be closed by ambition or by tariff design alone. It is set, in large part, by the price at which an emerging market can borrow.
The second component is the condition of the grid itself, which compounds the first. The networks in the fastest-growing markets are precisely the networks least able to absorb new generation, so that even where finance is secured, the physical capacity to connect it may not exist. The rate at which the global fleet reaches its projected size will therefore be governed less by the decision to build than by the cost of finance and the state of the network.
Türkiye: an $80 billion commitment to the network
Türkiye offers a concrete and recent illustration of how a large emerging market is approaching the network question. Speaking in London on 24 June 2026 at the Türkiye Clean Energy Transition Investment Forum, the Minister of Energy and Natural Resources, Alparslan Bayraktar, set out a plan for approximately $200 billion of total energy investment by 2035, of which $80 billion is allocated specifically to the transmission and distribution network. The network share — two-fifths of the total — is a direct expression of the priority described in this analysis.
The accompanying generation targets clarify the scale of what the network must carry. Türkiye's total installed capacity stands at approximately 126 GW today, of which renewable sources account for 62 percent, with a target of 70 percent by 2035. To reach that level the plan raises the combined solar and wind target to 120 GW, up from 38.6 GW today, including 5 GW of offshore wind for which a tender is expected this year, alongside a nuclear programme of at least 20 GW by 2050 — around 15 percent of the energy mix — on a path to net zero by 2053.
The network commitment is already in motion through the regulator. Under the fifth tariff period, the Energy Market Regulatory Authority has set a distribution investment ceiling of $18.5 billion for 2026 to 2030, equivalent to approximately 776 billion Turkish lira. Türkiye's $80 billion network commitment is therefore not an aspiration in isolation. It is a national instance of the global wave described here, and one that the regulator's $18.5 billion distribution plan has already begun to fund.
Türkiye 2035 energy investment plan
Figure
Total energy investment to 2035
~$200 bn
of which transmission & distribution network
~$80 bn
Total installed capacity (today)
~126 GW
Renewable share of capacity
62% today → 70% target (2035)
Solar + wind (combined target)
38.6 → 120 GW
Offshore wind (tender this year)
5 GW
Nuclear by 2050
≥20 GW (~15% of the mix)
Net-zero target
2053
Distribution ceiling (fifth tariff period)
$18.5 bn (2026–2030), ~₺776 bn
A strategic commitment, not current expenditure
The figures assembled here describe a single shift in the architecture of the power system. For a decade, generation outpaced the network, and the network has become the constraint that now governs the pace of the transition. Closing the gap will require global grid investment to rise from approximately $400 billion a year toward more than $600 billion by 2030, and the largest part of that increase must occur in the emerging economies, where the cost of capital and the condition of the network are most acute.
The implication is consistent with the framing of our Emerging Energy Outlook 2026. Investment in transmission and distribution is not most usefully understood as current expenditure to be minimised. In an economy that is electrifying its transport, its heating and its industry, the network determines whether generation already financed can reach demand, and is in that respect as critical to national and international security as the generation technology itself. The grid investment wave is the form that recognition is now taking.
Sources: International Energy Agency (World Energy Investment 2025; Electricity Grids and Secure Energy Transitions; Electricity 2026); European Commission (Grids Package and Action Plan); Edison Electric Institute; State Grid Corporation of China and Bloomberg; national energy regulators. Türkiye: Ministry of Energy and Natural Resources / Minister Alparslan Bayraktar (Türkiye Clean Energy Transition Investment Forum, London, 24 June 2026, reported by Anadolu Agency); Energy Market Regulatory Authority (EPDK), fifth tariff period. This Weekly Insight extends the World Electricity Ecosystem 2025–2050 dataset (UzEnergyNews Open Data, CC BY 4.0) and the flagship Emerging Energy Outlook 2026. Figures reflect mid-2026 public sources.
Küresel Şebeke Yatırımı Dalgası: Şebeke Neden Artık Bağlayıcı Kısıt
Üretim yatırımı, şebeke yatırımının belirgin biçimde önüne geçmiş ve aradaki açık, şebekeyi enerji dönüşümünün bağlayıcı kısıtı hâline getirmiştir. Dünya bugün elektrik şebekelerine yılda yaklaşık 400 milyar dolar yatırım yaparken, yeni üretime ayrılan tutar 1 trilyon dolara yakındır; Uluslararası Enerji Ajansı, öngörülen yatırımın gerçekleşebilmesi için şebeke harcamasının 2030'a kadar yaklaşık ikiye katlanarak yılda 600 milyar doların üzerine çıkması gerektiğini değerlendirmektedir. Bu Haftalık Analiz, geçen haftanın Dünya Elektrik Ekosistemi veri setinin şebeke bölümünü derinleştirmekte, yatırımın bugün nereye aktığını ortaya koymakta ve en geniş açığın neden gelişen ekonomilerde bulunduğunu açıklamaktadır; çünkü buradaki engel yatırım iradesi değil, sermaye maliyeti ve şebekenin durumudur.
Üretim, şebekenin önüne geçti
Son on yılda elektrik sisteminin iki yarısı arasındaki ilişki tersine dönmüştür. Başını güneş ve rüzgârın çektiği yeni üretim yatırımı hızla genişlerken, bu üretimi tüketiciye taşıyacak şebekelere yapılan yatırım büyük ölçüde yerinde saymıştır. Uluslararası Enerji Ajansı'nın Dünya Enerji Yatırımı 2025 raporuna göre dünya bugün yeni üretim kapasitesine yılda yaklaşık 1 trilyon dolar ayırırken, elektrik şebekelerine ayrılan tutar yılda yaklaşık 400 milyar dolar düzeyindedir; bu, üretim lehine yaklaşık 2,5'e 1 oranına karşılık gelmektedir. Bağlantı bekleyen kapasitenin hacmi katlanırken dahi, şebeke rakamı bir on yıl boyunca neredeyse hiç hareket etmemiştir.
Bu dengesizliğin sonucu ölçülebilir niteliktedir. Ajans, hâlihazırda planlanan üretime ve ulaşımın, ısınmanın ve sanayinin süregelen elektrifikasyonuna ayak uydurabilmek için şebeke yatırımının 2030'a kadar yaklaşık ikiye katlanarak yılda 600 milyar doların üzerine çıkması gerektiğini tahmin etmektedir. Başka bir deyişle, dönüşüm artık esas olarak temiz üretimin maliyeti ya da bulunabilirliği tarafından kısıtlanmamaktadır. Dönüşümü kısıtlayan, şebekenin bu üretimi soğurma ve talebe ulaştırma kapasitesidir.
Bu Haftalık Analizin, geçen haftaki Dünya Elektrik Ekosistemi veri setinin şebeke bölümünden hareketle geliştirdiği temel gözlem budur; söz konusu veri seti, 2050'ye kadar yaklaşık üç katına çıkması öngörülen bir kurulu güç parkı ortaya koymuştu. Bu ölçekte bir santral parkı yalnızca üretim yatırımıyla şebekeye bağlanamaz.
Kanıt, bağlantı kuyruğudur
Şebekenin bağlayıcı kısıt hâline geldiğinin en açık kanıtı, bağlanmayı bekleyen tamamlanmış ve ileri aşamadaki üretimin hacmidir. Uluslararası Enerji Ajansı, dünya genelinde yaklaşık 1.500 GW'lık ileri aşamadaki yenilenebilir projenin şebeke bağlantı kuyruklarında beklediğini — bu, hâlen işletmedeki yenilenebilir kapasitenin yaklaşık iki katıdır — erken aşamadaki projeler dâhil toplam kuyruğun ise 3.000 GW'ı aştığını bildirmektedir. Bunların çoğu, finansmanını ve arazisini güvenceye almış, ancak şebeke henüz kendilerini soğuramadığı için ilerleyemeyen projelerdir.
Bekleme süresi de kuyrukla birlikte uzamıştır. Ajans'ın verilerine göre bir bağlantı talebi ile işletmeye alınmış bağlantı arasındaki tipik süre, 2015'te yaklaşık üç yıldan 2022'de beş yıla çıkmıştır. Dolayısıyla kısıt soyut değildir. Gigavatlarla ve yıllarla ölçülen, finansmanı sağlanmış ancak henüz piyasaya ulaşamayan bir hazır proje kuyruğudur.
Bağlam olarak, toplam temiz enerji yatırımı bugün yılda yaklaşık 2,2 trilyon dolar düzeyinde seyretmektedir; bu, fosil yakıtlara ayrılan tutarın yaklaşık iki katıdır. Temiz dönüşümün toplamda sermaye sıkıntısı yoktur. Giderek eksildiği şey, sermayenin zaten finanse ettiği santralleri bağlayacak şebeke kapasitesidir.
Yatırım nereye akıyor
Yapılmakta olan yatırım az sayıda büyük piyasada yoğunlaşmaktadır ve bu örüntü öğreticidir.
Çin açık ara öndedir. State Grid Corporation of China 2025'te şebekelerine rekor düzeyde, yaklaşık 89 milyar dolar ayırmış; China Southern Power Grid ile birlikte ulusal rakam yıl için tahmini 95 ila 100 milyar dolara ulaşmıştır. İki işletmeci 2026 için birlikte yaklaşık 140 milyar dolarlık bir harcama planını işaret etmiş, State Grid'in 2026-2030 dönemini kapsayan beş yıllık planı ise yaklaşık 574 milyar dolarlık şebeke yatırımı öngörmüştür; bu, bir önceki döneme göre yüzde 40'a yakın bir artıştır.
Amerika Birleşik Devletleri ikinci büyük kutuptur. Edison Electric Institute'un verilerine göre iletim ve dağıtım yatırımı 2024'te yaklaşık 93 milyar dolar düzeyinde seyretmiş; üretim, şebeke ve diğer kalemleri kapsayan toplam sektör yatırım harcaması ise 2025'te yaklaşık 208 milyar dolarla rekor düzeye ulaşmış, 2025-2029 döneminde toplam 1,1 trilyon doların üzerinde bir yatırım öngörülmüştür. Buradaki ayrım önemlidir: 93 milyar dolarlık rakam özel olarak şebekeyi, 208 milyar dolarlık rakam ise sektörün bütününü ifade etmektedir.
Avrupa Birliği taahhüdünü Şebekeler Paketi (Grids Package) üzerinden belirlemiştir; bu paket 2020-2030 döneminde 584 milyar avro, 2024-2040 döneminde ise 1,2 trilyon avro şebeke yatırımı öngörmektedir; bu, yılda yaklaşık 65 ila 71 milyar avro düzeyindedir. Tekil işletmeciler arasında Iberdrola şebekelerine yılda yaklaşık 12 milyar avro, Enel yaklaşık 11 milyar avro ve E.ON yaklaşık 7 milyar avro ayırmaktadır. Bunlar, genel olarak yeterince finanse edilmiş şebekelere ilişkin rakamlardır.
Bölge / işletmeci
Yıllık şebeke yatırımı
Yıl / esas
Dünya
~400 mlr $/yıl (ihtiyaç: 2030'a kadar >600 mlr $/yıl)
2024-25, IEA
Çin (State Grid + China Southern)
~95-100 mlr $/yıl; ~140 mlr $ planlanan
2025; 2026 planı
Çin — State Grid beş yıllık plan
~574 mlr $ toplam (≈ +%40)
2026-2030
ABD — iletim ve dağıtım
~93 mlr $/yıl
2024, EEI
ABD — toplam sektör yatırım harcaması
~208 mlr $ (rekor)
2025, EEI
Avrupa Birliği (Şebekeler Paketi)
~65-71 mlr €/yıl
2020-2040
Iberdrola (şebeke yatırımı)
~12 mlr €/yıl
2025
Enel (şebeke yatırımı)
~11 mlr €/yıl
2025
E.ON (şebeke yatırımı)
~7 mlr €/yıl
2025
Açık en geniş gelişen ekonomilerdedir
Yeterince finanse edilen piyasalar, çoğunlukla talebin en hızlı büyüdüğü piyasalar değildir. Gelişen dünyanın büyük bölümünde şebeke, taşıması beklenen üretime kıyasla daha eski, daha az verimli ve süreğen biçimde yetersiz finanse edilmiş durumdadır. Yukarıdaki rakamlarla karşıtlık belirgindir. Örneğin Afrika, evrensel elektrik erişimine ulaşmak için 2030'a kadar yılda yaklaşık 30 milyar dolarlık yatırıma ihtiyaç duymaktadır; buna karşın şebekeleri kronik biçimde yetersiz kaynaklı kalmakta, bunun sonucunda yeni kapasite talebin gerektirdiği hızda bağlanamamaktadır.
Bu, amiral raporumuz Gelişen Enerji Görünümü 2026'nın da dayandığı bulgudur. Bu ekonomilerdeki engel yatırım iradesi değildir. Söz konusu raporda incelenen ülkelerin neredeyse tamamı bir yenilenebilir hedefine ve bir elektrifikasyon programına sahiptir; sermaye ise küresel düzeyde toplamda mevcuttur. Kısıt başka yerdedir ve birbirini pekiştiren iki bileşeni vardır.
Sermaye en çok gerektiği yerde neden daha pahalı
İlk bileşen sermaye maliyetidir ve etkisi doğrudan ve ölçülebilir niteliktedir. Gelişmiş ekonomilerde ölçek-büyüklüğündeki güneş yatırımı, yaklaşık yüzde 4,7 ila 6,4 ağırlıklı ortalama sermaye maliyetiyle finanse edilmektedir. Kenya ve Senegal gibi piyasalarda eşdeğer rakam yaklaşık yüzde 8,5 ila 9'dur; gelişen ekonomilerin genelinde ise üretim için sermaye maliyeti, gelişmiş ekonomi düzeyinin iki ila üç katı seyretmekte, iletim ve dağıtım varlıklarında dört kata kadar çıkmaktadır. Tek başına ülke risk primi, Afrika projelerinin karşılaştığı sermaye maliyetinin tahminen yüzde 60 ila 90'ını oluşturmaktadır.
Mekanizmanın açıkça ifade edilmesi gerekir, çünkü çoğu zaman gözden kaçırılmaktadır. Daha yüksek bir sermaye maliyeti, tek bir birim enerji üretilmeden önce her kilovatsaatin teslim maliyetini yükseltir; çünkü bir şebeke ya da üretim varlığı, ezici biçimde, onlarca yılda geri kazanılan bir peşin yatırımdır. Finansmanın iki kat pahalı olduğu yerde, aynı fiziksel proje elektriği belirgin biçimde daha yüksek bir fiyata teslim eder; bunun nedeni ekipmanın daha pahalı olması değil, paranın daha pahalı olmasıdır. Yatırım açığının yalnızca istekle ya da tarife tasarımıyla kapatılamamasının nedeni budur. Bu açık, büyük ölçüde, bir gelişen piyasanın borçlanabildiği fiyat tarafından belirlenmektedir.
İkinci bileşen, birinciyi pekiştiren şebekenin kendi durumudur. En hızlı büyüyen piyasalardaki şebekeler, tam da yeni üretimi soğurmaya en az elverişli olan şebekelerdir; öyle ki finansman sağlansa dahi, onu bağlayacak fiziksel kapasite mevcut olmayabilir. Bu nedenle küresel santral parkının öngörülen büyüklüğüne ulaşma hızı, yapma kararından çok, finansman maliyeti ve şebekenin durumu tarafından belirlenecektir.
Türkiye: şebekeye 80 milyar dolarlık taahhüt
Türkiye, büyük bir gelişen piyasanın şebeke sorusuna nasıl yaklaştığına dair somut ve güncel bir örnek sunmaktadır. Enerji ve Tabii Kaynaklar Bakanı Alparslan Bayraktar, 24 Haziran 2026'da Londra'da düzenlenen Türkiye Temiz Enerji Dönüşüm Yatırım Forumu'nda yaptığı konuşmada, 2035'e kadar yaklaşık 200 milyar dolarlık toplam enerji yatırımı öngören bir plan ortaya koymuş; bunun 80 milyar dolarının özel olarak iletim ve dağıtım şebekesine ayrıldığını belirtmiştir. Toplamın beşte ikisine karşılık gelen şebeke payı, bu analizde tarif edilen önceliğin doğrudan bir ifadesidir.
Buna eşlik eden üretim hedefleri, şebekenin taşıması gereken ölçeği netleştirmektedir. Türkiye'nin toplam kurulu gücü bugün yaklaşık 126 GW düzeyindedir; bunun yüzde 62'sini yenilenebilir kaynaklar oluşturmakta, 2035 için yüzde 70 hedefi konulmaktadır. Bu düzeye ulaşmak için plan, güneş ve rüzgârın birleşik hedefini bugünkü 38,6 GW'den 120 GW'a çıkarmakta; buna bu yıl ihalesi beklenen 5 GW deniz üstü rüzgâr da dâhildir. Buna ayrıca 2050'ye kadar en az 20 GW'lık — enerji bileşiminin yaklaşık yüzde 15'i — bir nükleer programı eşlik etmekte ve 2053'te net sıfıra ulaşan bir yol izlenmektedir.
Şebeke taahhüdü düzenleyici eliyle hâlihazırda harekete geçmiştir. Beşinci tarife dönemi kapsamında Enerji Piyasası Düzenleme Kurumu, 2026-2030 için 18,5 milyar dolarlık — yaklaşık 776 milyar Türk lirasına karşılık gelen — bir dağıtım yatırım tavanı belirlemiştir. Bu nedenle Türkiye'nin 80 milyar dolarlık şebeke taahhüdü tek başına bir niyet beyanı değildir. Burada tarif edilen küresel dalganın ulusal bir örneğidir ve düzenleyicinin 18,5 milyar dolarlık dağıtım planı bu örneği finanse etmeye şimdiden başlamıştır.
Türkiye 2035 enerji yatırım planı
Rakam
2035'e kadar toplam enerji yatırımı
~200 mlr $
bunun iletim ve dağıtım şebekesi payı
~80 mlr $
Toplam kurulu güç (bugün)
~126 GW
Yenilenebilir payı
bugün %62 → 2035 hedefi %70
Güneş + rüzgâr (birleşik hedef)
38,6 → 120 GW
Deniz üstü rüzgâr (bu yıl ihale)
5 GW
2050'ye kadar nükleer
≥20 GW (bileşimin ~%15'i)
Net sıfır hedefi
2053
Dağıtım tavanı (beşinci tarife dönemi)
18,5 mlr $ (2026-2030), ~776 mlr ₺
Cari harcama değil, stratejik taahhüt
Burada bir araya getirilen rakamlar, elektrik sisteminin mimarisindeki tek bir kaymayı tarif etmektedir. Bir on yıl boyunca üretim şebekenin önüne geçmiş ve şebeke, dönüşümün hızını artık belirleyen kısıt hâline gelmiştir. Açığı kapatmak, küresel şebeke yatırımının yılda yaklaşık 400 milyar dolardan 2030'a kadar 600 milyar doların üzerine çıkmasını gerektirecektir; bu artışın en büyük bölümü ise, sermaye maliyetinin ve şebekenin durumunun en keskin olduğu gelişen ekonomilerde gerçekleşmek zorundadır.
Bu çıkarım, Gelişen Enerji Görünümü 2026 raporumuzun çerçevesiyle tutarlıdır. İletim ve dağıtıma yapılan yatırımı, en yararlı biçimde, asgariye indirilmesi gereken bir cari harcama olarak anlamak doğru değildir. Ulaşımını, ısınmasını ve sanayisini elektrifiye eden bir ekonomide şebeke, hâlihazırda finanse edilmiş üretimin talebe ulaşıp ulaşamayacağını belirler ve bu bakımdan üretim teknolojisinin kendisi kadar ulusal ve uluslararası güvenlik açısından kritiktir. Şebeke yatırımı dalgası, bu kabulün bugün aldığı biçimdir.
Kaynaklar: Uluslararası Enerji Ajansı (World Energy Investment 2025; Electricity Grids and Secure Energy Transitions; Electricity 2026); Avrupa Komisyonu (Şebekeler Paketi ve Eylem Planı); Edison Electric Institute; State Grid Corporation of China ve Bloomberg; ulusal enerji düzenleyicileri. Türkiye: Enerji ve Tabii Kaynaklar Bakanlığı / Bakan Alparslan Bayraktar (Türkiye Temiz Enerji Dönüşüm Yatırım Forumu, Londra, 24 Haziran 2026; Anadolu Ajansı aktarımı); Enerji Piyasası Düzenleme Kurumu (EPDK), beşinci tarife dönemi. Bu Haftalık Analiz, Dünya Elektrik Ekosistemi 2025-2050 veri setini (UzEnergyNews Açık Veri, CC BY 4.0) ve amiral raporumuz Gelişen Enerji Görünümü 2026'yı derinleştirmektedir. Rakamlar 2026 ortası kamusal kaynakları yansıtmaktadır.
WEEKLY INSIGHT #8 · DATA · GLOBAL23 June 2026 · 9 min read · EN/TR · Global
The World Electricity Ecosystem: A $4.6 Trillion Market and the Fleet That Supplies It
The value of electricity consumed worldwide each year now stands at approximately $4.6 trillion, equivalent to 3.9 percent of global GDP. Behind that figure sits a generation fleet of 10,425 GW that is set to nearly triple by 2050. This Weekly Insight introduces the World Electricity Ecosystem 2025–2050 dataset and examines what the two numbers — the market and the fleet — reveal about where electricity matters most to national economies, and what will determine whether the build-out keeps pace with demand.
A market worth $4.6 trillion
When measured at the point of final consumption, the global electricity market is worth roughly $4.6 trillion each year. The figure is derived directly: gross electricity consumption in each economy, multiplied by its all-in average retail price, summed across markets. At a world level this is equivalent to about 3.9 percent of global GDP, which the IMF places near $117 trillion in nominal terms.
The method is deliberately transparent and reproducible. For every economy in the dataset, the ecosystem value equals consumption in terawatt-hours multiplied by the all-in average retail tariff in US cents per kilowatt-hour. The result is then expressed as a share of that country's nominal GDP. The Türkiye figure serves as the calibration point: 361 TWh consumed at an all-in average of 10.91 US cents per kilowatt-hour yields an ecosystem value of $39.4 billion, equal to roughly 2.5 percent of national GDP, a result consistent with publicly reported figures for Türkiye's electricity sector. The same formula has been applied to fifteen economies without adjustment.
This framing treats electricity not as a single commodity price but as the full value that an economy assigns to the power it consumes. It captures generation, networks, retail margins and the taxes and levies embedded in the final tariff, which is why it tracks closely to what households and firms actually pay.
Where electricity carries the most economic weight
Expressing the ecosystem as a share of GDP produces a ranking that differs markedly from a simple ranking by size. South Africa sits at the top at 6.5 percent, followed by Vietnam at 6.0 percent and China at 4.5 percent. The world average of 3.9 percent falls below each of these. The United States, by contrast, sits near the foot of the table at 1.9 percent, alongside Kenya at the same share, with Indonesia and Nigeria lower still at 1.6 percent.
The mechanism behind the ranking is straightforward and has two distinct sources. A high share tends to reflect an electricity-intensive economy, where mining and heavy industry account for a large part of output, combined with a relatively modest nominal GDP. South Africa, Vietnam and China each fit this description. A low share arises in two different ways. In a high-income, services-weighted economy such as the United States, electricity is a smaller fraction of a very large GDP. In a low-access economy such as Nigeria, the low share instead reflects suppressed demand, where consumption is constrained by the limits of supply rather than by the structure of the economy.
The distinction matters for interpretation. A low ecosystem share is not in itself a sign of efficiency, nor a high share a sign of waste. The same indicator describes an advanced services economy and an electricity-constrained one, and the two should not be read in the same way.
Economy
Ecosystem value ($bn/yr)
Share of GDP
South Africa
28
6.5%
Vietnam
29
6.0%
China
881
4.5%
World
4,600
3.9%
Pakistan
15
3.6%
OECD
2,000
3.25%
India
132
3.2%
EU-27
616
3.2%
Uzbekistan
4
2.65%
Türkiye
39
2.5%
Kazakhstan
6
2.1%
United States
598
1.9%
Kenya
2
1.9%
Indonesia
23
1.6%
Nigeria
4.5
1.6%
The Türkiye calibration point
Türkiye anchors the dataset because its figures can be checked against an independent public source. National consumption of 361 TWh, priced at an all-in average of 10.91 US cents per kilowatt-hour, produces an ecosystem value of $39.4 billion. Against a nominal GDP placing the economy among the larger emerging markets, this represents approximately 2.5 percent — a position in the lower half of the ranking that is consistent with Türkiye's diversified, services-inclusive economic structure.
The value of this calibration is methodological. Because the Türkiye result is consistent with publicly reported figures for the sector, the same formula can be applied to the remaining economies with confidence that the approach is sound rather than merely internally consistent. The dataset therefore rests on a publicly grounded anchor rather than on an unverified model.
The fleet behind the market
The market described above is supplied by an installed generation fleet of 10,425 GW as of 2025. Under the dataset's central projection, that fleet expands to approximately 30,000 GW by 2050, an increase of 2.9 times. Over the same period, electricity consumption rises from 31,779 TWh to 58,400 TWh, an increase of about 1.8 times. The capacity figure grows faster than consumption because the additions are dominated by solar and wind, which generate fewer hours per year of installed capacity than the thermal plant they displace, so that more gigawatts are required to deliver each additional terawatt-hour.
The composition of the fleet changes as much as its size. The renewable share of installed capacity rises from 28 percent in 2013 to 49 percent in 2025, and is projected to reach 80 percent by 2050. Within that shift, solar capacity expands from 2,300 GW in 2025 to 16,000 GW in 2050, wind from 1,250 GW to 4,700 GW, while coal declines from 2,180 GW to roughly 900 GW. The trajectory is one of a fleet that grows substantially in nameplate terms while moving from a thermal core toward a variable, renewable one.
Source
2025 (GW)
2050 (GW)
2025 share
2050 share
Solar
2,300
16,000
22%
53%
Wind
1,250
4,700
12%
16%
Hydro
1,420
1,900
14%
6%
Nuclear
420
647
4%
2%
Gas
1,900
1,850
18%
6%
Coal
2,180
900
21%
3%
Other
955
4,003
9%
13%
Total
10,425
~30,000
100%
100%
of which renewable
49%
80%
Why more gigawatts buy less energy
The gap between the 2.9-times growth in capacity and the 1.8-times growth in consumption is the central technical feature of the transition, and it has practical consequences. A solar plant in a typical location operates at the equivalent of full output for roughly fifteen to twenty percent of the year; a combined-cycle gas plant or a coal unit can exceed fifty percent. Replacing dispatchable thermal capacity with variable renewable capacity therefore requires considerably more installed gigawatts to serve the same demand.
This is not a deficiency of renewable generation; it is a structural characteristic of the resource. Its consequence, however, is that the system must build more than the headline demand growth alone would suggest, and that it must invest in the networks, storage and flexibility needed to manage output that varies with the weather and the time of day. The scale of the build-out is therefore set not only by how much electricity the world will consume, but by the physical properties of the plant that will supply it.
The grid is the binding constraint
A fleet that nearly triples in size cannot be connected by generation investment alone. The world currently invests on the order of $400 billion a year in electricity networks. In the European Union, the Grids Package envisages €1.2 trillion of network investment by 2040, and the largest operators — among them Iberdrola, Enel and E.ON — already commit between €10 billion and €17 billion each per year. These are the figures associated with networks that are, on the whole, adequately funded.
In much of the developing world the position is different. Networks there are chronically underfunded relative to the generation they are expected to carry, which constrains the rate at which new capacity can be connected and delivered to consumers. For reference, Türkiye's distribution sector invests on the order of $3.8 billion a year, with $18.5 billion of capital expenditure planned across the fifth tariff period from 2026 to 2030. The transmission and management of electricity in an increasingly electrified economy is, in this respect, as critical to national and international security as the generation technology itself.
The two bottlenecks for developing markets
The dataset connects directly to the central finding of our flagship Emerging Energy Outlook 2026. The ecosystem will expand on both measures examined here — capacity by 2.9 times and consumption by roughly 1.8 times — and the developing world will account for the greater part of that growth. The constraint on these economies is not the willingness to build, since almost every country examined maintains a renewables target and an electrification programme.
Two bottlenecks instead determine the pace. The first is the cost of capital: utility-scale generation in developing economies is financed at two to three times the cost prevailing in the advanced economies, which raises the delivered cost of every project before a single unit of energy is produced. The second is the condition of the grid, which is older, less efficient and persistently underfunded in precisely the markets where demand is growing fastest. The rate at which the global fleet reaches its projected size will therefore be governed less by the decision to build than by the cost of finance and the capacity of the network to absorb new generation. Viewed in these terms, investment in electricity infrastructure is a strategic commitment to a country's next three decades, rather than current expenditure alone.
What the dataset adds
The World Electricity Ecosystem 2025–2050 dataset brings the market and the fleet into a single, comparable frame. It allows the value an economy assigns to its electricity to be set alongside the physical fleet that supplies it, and it makes both figures comparable across fifteen economies on a consistent basis. The intention is to provide a reference point that regulators, lenders and analysts can use directly, with each figure traceable to a public source and the Türkiye anchor independently verified.
The dataset is published under a Creative Commons Attribution 4.0 licence as part of UzEnergyNews Open Data. The two signature charts on our Data page present the ecosystem-to-GDP ranking and the source composition of installed capacity from 2013 to 2050, and the underlying figures are available for reuse with attribution.
Sources: IEA (World Energy Outlook 2025, Electricity 2026, World Energy Investment); IRENA (Renewable Capacity Statistics 2026); Ember; IMF (World Economic Outlook); U.S. Energy Information Administration; Eurostat; national energy plans. Türkiye anchor: EPDK; Ministry of Energy and Natural Resources. Dataset: World Electricity Ecosystem 2025–2050, UzEnergyNews Open Data (CC BY 4.0). Figures reflect mid-2026 public sources.
Dünya Elektrik Ekosistemi: 4,6 Trilyon Dolarlık Pazar ve Onu Besleyen Santral Parkı
Dünyada her yıl tüketilen elektriğin değeri bugün yaklaşık 4,6 trilyon dolara ulaşıyor; bu, küresel GSYİH'nin yüzde 3,9'una denk geliyor. Bu rakamın arkasında, 2050'ye kadar yaklaşık üç katına çıkması beklenen 10.425 GW'lık bir santral parkı yer alıyor. Bu Weekly Insight, World Electricity Ecosystem 2025–2050 veri setini tanıtıyor ve bu iki büyüklüğün — pazarın ve santral parkının — elektriğin hangi ülke ekonomilerinde daha fazla ağırlık taşıdığına ve kurulu gücün talebe yetişip yetişemeyeceğini neyin belirleyeceğine dair ne söylediğini inceliyor.
4,6 trilyon dolarlık bir pazar
Nihai tüketim noktasında ölçüldüğünde, küresel elektrik pazarının değeri her yıl yaklaşık 4,6 trilyon dolardır. Rakam doğrudan türetilmiştir: her ekonomide brüt elektrik tüketimi, o ekonominin all-in ortalama perakende fiyatıyla çarpılır ve tüm piyasalar toplanır. Dünya ölçeğinde bu, IMF'nin nominal olarak yaklaşık 117 trilyon dolar olarak belirlediği küresel GSYİH'nin yaklaşık yüzde 3,9'una karşılık gelir.
Yöntem bilinçli olarak şeffaf ve yeniden üretilebilirdir. Veri setindeki her ekonomi için ekosistem değeri, teravatsaat cinsinden tüketimin, kilovatsaat başına ABD senti cinsinden all-in ortalama tarifeyle çarpımına eşittir. Sonuç daha sonra ülkenin nominal GSYİH'sine oran olarak ifade edilir. Türkiye rakamı kalibrasyon noktasıdır: 361 TWh'lik tüketimin kilovatsaat başına 10,91 ABD senti all-in ortalamayla çarpımı 39,4 milyar dolarlık bir ekosistem değeri verir; bu, ulusal GSYİH'nin yaklaşık yüzde 2,5'ine eşittir ve Türkiye elektrik sektörü için kamuya açık rakamlarla tutarlıdır. Aynı formül on beş ekonomiye herhangi bir düzeltme yapılmadan uygulanmıştır.
Bu çerçeve, elektriği tek bir emtia fiyatı olarak değil, bir ekonominin tükettiği güce atfettiği bütünsel değer olarak ele alır. Üretimi, şebekeleri, perakende marjlarını ve nihai tarifeye gömülü vergi ve fonları kapsar; nihai tarife, hane halkı ve işletmelerin fiilen ödediği tutarı yansıttığından, bu yaklaşım gerçek harcamaya yakın seyreder.
Elektriğin en çok ekonomik ağırlık taşıdığı yerler
Ekosistemin GSYİH'ye oran olarak ifade edilmesi, büyüklüğe göre yapılan basit bir sıralamadan belirgin biçimde farklı bir sıralama üretir. Güney Afrika yüzde 6,5 ile en üstte yer alır; onu yüzde 6,0 ile Vietnam ve yüzde 4,5 ile Çin izler. Yüzde 3,9'luk dünya ortalaması bu üçünün de altında kalır. Buna karşılık Amerika Birleşik Devletleri, aynı oranı paylaşan Kenya ile birlikte yüzde 1,9 ile tablonun alt sıralarında; Endonezya ve Nijerya ise yüzde 1,6 ile daha da aşağıda yer alır.
Sıralamanın arkasındaki mekanizma açıktır ve iki ayrı kaynaktan beslenir. Yüksek bir pay, çıktının büyük bir bölümünü madencilik ve ağır sanayinin oluşturduğu elektrik-yoğun bir ekonomiyi, görece mütevazı bir nominal GSYİH ile birlikte yansıtma eğilimindedir. Güney Afrika, Vietnam ve Çin bu tanıma uyar. Düşük bir pay ise iki farklı biçimde ortaya çıkar. Amerika Birleşik Devletleri gibi yüksek gelirli, hizmet-ağırlıklı bir ekonomide elektrik, çok büyük bir GSYİH'nin daha küçük bir kesrini oluşturur. Nijerya gibi düşük erişimli bir ekonomide ise düşük pay, ekonominin yapısından çok arzın sınırlarınca kısıtlanmış, bastırılmış talebi yansıtır.
Bu ayrım yorum açısından önemlidir. Düşük bir ekosistem payı tek başına verimlilik işareti, yüksek bir pay da israf işareti değildir. Aynı gösterge hem gelişmiş bir hizmet ekonomisini hem de elektrik-kısıtlı bir ekonomiyi tanımlar ve bu ikisi aynı biçimde okunmamalıdır.
Ekonomi
Ekosistem değeri (milyar $/yıl)
GSYİH payı
Güney Afrika
28
%6,5
Vietnam
29
%6,0
Çin
881
%4,5
Dünya
4.600
%3,9
Pakistan
15
%3,6
OECD
2.000
%3,25
Hindistan
132
%3,2
AB-27
616
%3,2
Özbekistan
4
%2,65
Türkiye
39
%2,5
Kazakistan
6
%2,1
ABD
598
%1,9
Kenya
2
%1,9
Endonezya
23
%1,6
Nijerya
4,5
%1,6
Türkiye kalibrasyon noktası
Türkiye veri setine dayanak oluşturur; çünkü rakamları bağımsız bir kamu kaynağına karşı denetlenebilir. 361 TWh'lik ulusal tüketim, kilovatsaat başına 10,91 ABD senti all-in ortalamayla fiyatlandığında 39,4 milyar dolarlık bir ekosistem değeri üretir. Ekonomiyi daha büyük gelişen piyasalar arasına yerleştiren nominal bir GSYİH karşısında bu, yaklaşık yüzde 2,5'e karşılık gelir; sıralamanın alt yarısındaki bu konum, Türkiye'nin çeşitlenmiş ve hizmetleri de kapsayan ekonomik yapısıyla tutarlıdır.
Bu kalibrasyonun değeri yöntemseldir. Türkiye sonucu kamuya açık sektör rakamlarıyla tutarlı olduğu için, aynı formül geriye kalan ekonomilere, yaklaşımın yalnızca kendi içinde tutarlı değil sağlam olduğu güveniyle uygulanabilir. Veri seti bu nedenle doğrulanmamış bir modele değil, kamuya açık bir dayanağa oturur.
Pazarın arkasındaki santral parkı
Yukarıda tanımlanan pazar, 2025 itibarıyla 10.425 GW'lık kurulu bir santral parkı tarafından beslenir. Veri setinin temel projeksiyonu altında bu park 2050'ye kadar yaklaşık 30.000 GW'a, yani 2,9 katına çıkar. Aynı dönemde elektrik tüketimi 31.779 TWh'den 58.400 TWh'ye, yani yaklaşık 1,8 katına yükselir. Kapasite rakamı tüketimden daha hızlı büyür; çünkü yeni eklemelere güneş ve rüzgâr hâkimdir ve bunlar, yerini aldıkları termik santrallere göre kurulu kapasite başına yılda daha az saat üretir. Dolayısıyla her ilave teravatsaati sağlamak için daha fazla gigavat gerekir.
Santral parkının bileşimi en az büyüklüğü kadar değişir. Kurulu kapasitede yenilenebilir payı 2013'te yüzde 28'den 2025'te yüzde 49'a yükselir ve 2050'ye kadar yüzde 80'e ulaşması öngörülür. Bu kayma içinde güneş kapasitesi 2025'te 2.300 GW'den 2050'de 16.000 GW'a, rüzgâr 1.250 GW'den 4.700 GW'a genişlerken kömür 2.180 GW'den yaklaşık 900 GW'a iner. Gidişat, anma değeri itibarıyla önemli ölçüde büyürken termik bir çekirdekten değişken ve yenilenebilir bir çekirdeğe geçen bir santral parkını tarif eder.
Kaynak
2025 (GW)
2050 (GW)
2025 payı
2050 payı
Güneş
2.300
16.000
%22
%53
Rüzgâr
1.250
4.700
%12
%16
Hidro
1.420
1.900
%14
%6
Nükleer
420
647
%4
%2
Gaz
1.900
1.850
%18
%6
Kömür
2.180
900
%21
%3
Diğer
955
4.003
%9
%13
Toplam
10.425
~30.000
%100
%100
bunun yenilenebilir kısmı
%49
%80
Neden daha fazla gigavat daha az enerji sağlar
Kapasitedeki 2,9 katlık büyüme ile tüketimdeki 1,8 katlık büyüme arasındaki fark, dönüşümün merkezî teknik özelliğidir ve pratik sonuçları vardır. Tipik bir konumdaki bir güneş santrali, yılın yaklaşık yüzde on beş ila yirmisi oranında tam çıktıya eşdeğer çalışır; bir kombine çevrim gaz santrali ya da bir kömür ünitesi yüzde elliyi aşabilir. Dolayısıyla iletilebilir termik kapasitenin yerine değişken yenilenebilir kapasite koymak, aynı talebi karşılamak için belirgin biçimde daha fazla kurulu gigavat gerektirir.
Bu, yenilenebilir üretimin bir eksikliği değil, kaynağın yapısal bir özelliğidir. Bununla birlikte sonucu, sistemin yalnızca manşet talep büyümesinin imâ ettiğinden daha fazlasını kurması ve hava koşullarıyla ve günün saatiyle değişen üretimi yönetmek için gereken şebeke, depolama ve esnekliğe yatırım yapması gerektiğidir. Kurulu gücün ölçeği bu nedenle yalnızca dünyanın ne kadar elektrik tüketeceğine değil, onu sağlayacak santralin fiziksel özelliklerine göre belirlenir.
Bağlayıcı kısıt şebekedir
Büyüklüğü neredeyse üç katına çıkan bir santral parkı, tek başına üretim yatırımıyla bağlanamaz. Dünya bugün elektrik şebekelerine yılda yaklaşık 400 milyar dolar mertebesinde yatırım yapıyor. Avrupa Birliği'nde Grids Package, 2040'a kadar 1,2 trilyon avroluk şebeke yatırımı öngörüyor; en büyük operatörler — aralarında Iberdrola, Enel ve E.ON — halihazırda her biri yılda 10 ila 17 milyar avro taahhüt ediyor. Bunlar, bütün olarak bakıldığında yeterince finanse edilen şebekelerle ilişkilendirilen rakamlardır.
Gelişen dünyanın büyük bölümünde durum farklıdır. Buradaki şebekeler, taşımaları beklenen üretime kıyasla kronik biçimde az finanse edilir; bu da yeni kapasitenin bağlanma ve tüketiciye ulaştırılma hızını kısıtlar. Karşılaştırma için, Türkiye dağıtım sektörü yılda yaklaşık 3,8 milyar dolar mertebesinde yatırım yapıyor; 2026-2030 beşinci tarife dönemi boyunca 18,5 milyar dolarlık yatırım planlanıyor. Giderek elektrikleşen bir ekonomide elektriğin iletimi ve yönetimi, bu bakımdan üretim teknolojisinin kendisi kadar kritik bir ulusal ve uluslararası güvenlik meselesidir.
Gelişen piyasalar için iki darboğaz
Veri seti, amiral raporumuz Emerging Energy Outlook 2026'nın merkezî bulgusuna doğrudan bağlanır. Ekosistem, burada incelenen her iki ölçütte de büyüyecektir — kapasite 2,9 kat, tüketim yaklaşık 1,8 kat — ve bu büyümenin büyük bölümünü gelişen dünya oluşturacaktır. Bu ekonomilerin önündeki kısıt, kurma isteği değildir; çünkü incelenen hemen her ülke bir yenilenebilir hedefi ve bir elektrifikasyon programı sürdürmektedir.
Hızı bunun yerine iki darboğaz belirler. Birincisi sermaye maliyetidir: gelişen ekonomilerde şebeke-ölçekli üretim, gelişmiş ekonomilerde geçerli olanın iki ila üç katı maliyetle finanse edilir; bu da her projenin teslim maliyetini, tek bir birim enerji üretilmeden önce yükseltir. İkincisi, talebin en hızlı büyüdüğü piyasalarda tam da daha eski, daha az verimli ve sürekli az finanse edilen şebekenin durumudur. Küresel santral parkının öngörülen büyüklüğüne ulaşma hızı bu nedenle kurma kararından çok, finansmanın maliyetine ve şebekenin yeni üretimi soğurma kapasitesine göre belirlenecektir. Bu çerçeveden bakıldığında, enerji altyapısına yapılan yatırım yalnızca cari bir harcama değil, bir ülkenin gelecek otuz yılına yapılan stratejik bir taahhüttür.
Veri setinin eklediği değer
World Electricity Ecosystem 2025–2050 veri seti, pazarı ve santral parkını tek ve karşılaştırılabilir bir çerçeveye getirir. Bir ekonominin elektriğine atfettiği değerin, onu besleyen fiziksel santral parkının yanına yerleştirilmesine olanak tanır ve her iki rakamı da on beş ekonomi genelinde tutarlı bir esasla karşılaştırılabilir kılar. Amaç, düzenleyicilerin, kredi verenlerin ve analistlerin doğrudan kullanabileceği bir başvuru noktası sunmaktır; her rakam bir kamu kaynağına izlenebilir ve Türkiye dayanağı bağımsız olarak doğrulanmıştır.
Veri seti, UzEnergyNews Open Data kapsamında Creative Commons Atıf 4.0 lisansıyla yayımlanmaktadır. Data sayfamızdaki iki imza grafiği, ekosistemin GSYİH'ye oranı sıralamasını ve kurulu kapasitenin 2013'ten 2050'ye kaynak bileşimini sunar; bunların dayandığı rakamlar atıf verilerek yeniden kullanılabilir.
Kaynaklar: IEA (World Energy Outlook 2025, Electricity 2026, World Energy Investment); IRENA (Renewable Capacity Statistics 2026); Ember; IMF (World Economic Outlook); ABD Enerji Bilgi İdaresi (EIA); Eurostat; ulusal enerji planları. Türkiye dayanağı: EPDK; Enerji ve Tabii Kaynaklar Bakanlığı. Veri seti: World Electricity Ecosystem 2025–2050, UzEnergyNews Open Data (CC BY 4.0). Rakamlar mid-2026 kamuya açık kaynakları yansıtır.
WEEKLY INSIGHT #7 · HYDRO · WATER-ENERGY17 June 2026 · 7 min read · EN/TR · Central Asia
Water Is the Real Grid: Why Central Asia's Power Market Rests on a 60-Year-Old Problem
Central Asia is building a regional electricity market and a green-power corridor to Europe. Both depend on a problem the region has not solved since the Soviet collapse: upstream countries need water for winter electricity, downstream countries need it for summer crops. The breakthrough now under way is not a dam — it is a trade.
The problem beneath the headlines
The headlines out of Central Asia this year are about ambition: a World Bank-backed regional electricity market (REMIT), a subsea cable to carry renewable power across the Caspian toward Europe, gigawatts of new solar and wind. Beneath all of it sits a constraint that predates every one of these projects and quietly governs whether they can work. In Central Asia, electricity and water are not two problems but one. The rivers that irrigate the cotton and wheat of Kazakhstan and Uzbekistan are the same rivers that generate the hydropower of Kyrgyzstan and Tajikistan. What one country does with the water in winter determines what another can grow in summer. Until that conflict is managed, no regional market is fully secure.
The Soviet bargain and its collapse
The conflict is structural, and it was once solved by design. Under the Soviet Union the system was run as a single unit. The upstream republics — Kyrgyzstan and Tajikistan, rich in mountain water but poor in fossil fuel — stored water through the winter and released it in summer, when the downstream republics of Kazakhstan, Uzbekistan and Turkmenistan needed it for irrigation. In exchange, the downstream republics, rich in coal and gas, supplied the upstream ones with fuel for heating through the cold months. Water flowed down in summer; energy flowed up in winter. It was a barter, and it balanced.
Independence broke the barter. Once the republics became states with separate budgets and tariffs, the downstream countries had little reason to ship cheap fuel north, and the upstream countries had every reason to use their one abundant resource — water — to generate their own electricity when they needed it most, in winter. So Kyrgyzstan began releasing water through its dams in winter to keep the lights and heating on, sending it downstream in the cold season when no one could use it for crops, and holding too little back for the summer when the fields needed it. The same water, released at the wrong time of year, became a source of shortage at both ends: winter power crises upstream, summer irrigation shortfalls downstream.
Toktogul: the reservoir that holds the balance
No single structure embodies this better than the Toktogul reservoir in Kyrgyzstan. Sitting on the Naryn river, the main tributary of the Syr Darya, Toktogul is Kyrgyzstan's largest power station and supplies roughly 40 percent of the country's electricity. It is also the regulator of summer water for millions of hectares of farmland downstream. The two jobs pull in opposite directions, and the reservoir's water level is the scoreboard. This year it told a stark story: Toktogul held 9.14 billion cubic metres of water on 1 January 2026 and just 7 billion by 1 April, drawn down through the winter heating season. Every cubic metre spent generating winter electricity is a cubic metre not available for summer irrigation. When the reservoir runs low, both functions suffer at once — and each growing season becomes a fresh round of water-for-electricity negotiation with less room to manoeuvre.
The 2025 swap: solving it with trade, not engineering
The most important development is that the region has begun to manage the conflict with trade rather than with concrete. On 8 September 2025, at a meeting in the Kyrgyz resort town of Cholpon-Ata, the energy ministers and water agencies of Kazakhstan, Kyrgyzstan and Uzbekistan signed a package of protocols that revives the old Soviet logic in a modern form. Under the deal, Kazakhstan and Uzbekistan supply Kyrgyzstan with electricity in winter; in return, Kyrgyzstan reduces its winter water releases and holds the water back in Toktogul for the downstream countries' summer irrigation. Between September 2025 and April 2026, Kazakhstan alone delivered more than 1.5 billion kilowatt-hours of electricity north under this arrangement. Kazakhstan also agreed to wheel power to Kyrgyzstan from Russia across its own grid, and Uzbekistan committed to supply southern Kazakhstan in 2026.
This is the barter rebuilt as an electricity trade. Instead of shipping coal to keep the upstream warm, the downstream countries ship kilowatt-hours; instead of being forced to spend its water on winter power, the upstream country is paid, in electricity, to keep the water in the reservoir. The mechanism that makes this scalable is precisely the regional market the World Bank is funding through REMIT: a shared market turns an awkward bilateral favour into a routine, priced transaction.
Kambarata-1 and the logic of shared ownership
The second development changes who owns the water. Kambarata-1, a long-planned hydropower plant upstream of Toktogul on the Naryn, is finally moving. The plant is designed for 1,860 megawatts behind a 256-metre dam, with a reservoir of 5.4 billion cubic metres and a construction cost of about 4.2 billion dollars. What matters is not only the megawatts but the ownership. From 2026 the plant is being financed and owned jointly: Kyrgyzstan holds 34 percent and Kazakhstan and Uzbekistan 33 percent each. The downstream countries are becoming co-owners of the upstream reservoir that controls their water.
That is the institutional fix the region has lacked. A new reservoir adds storage to smooth the seasonal swing between winter power and summer water. But shared ownership does something the engineering alone cannot: it gives the downstream states a direct say in how and when the water is released, and a financial stake in releasing it for irrigation rather than spilling it for winter power. Lenders have noticed — the European Bank for Reconstruction and Development, the Asian Development Bank, the Asian Infrastructure Investment Bank, the European Investment Bank and the OPEC Fund have all engaged with the project. Where REMIT builds the market, Kambarata-1 builds the asset the three countries hold in common.
Rogun and the harder case
Not every upstream project follows the cooperative model, and Tajikistan's Rogun dam shows the tension that remains. On the Vakhsh river, Rogun is engineered to be the most powerful hydropower plant in Central Asia: 3,780 megawatts when complete, behind the tallest dam in the world at 335 metres, generating around 14,400 gigawatt-hours a year — roughly 70 percent of Tajikistan's current output. Two of its six units are running; a third is due in 2027. The total cost is put at about 6.2 billion dollars.
But Rogun is being built largely as a national project, and its financing has run into the limits of that approach. The World Bank approved a 350-million-dollar grant in December 2024 and then suspended further support, asking Tajikistan first to present a financing plan that does not pile on unsustainable debt, to secure long-term electricity export agreements, and to meet rigorous dam-safety standards. Tajikistan is pressing ahead, budgeting more than a billion dollars of its own money for 2026. Rogun is the counter-example to Kambarata-1: enormous potential, but built alone, with the financing, debt and downstream-water questions still unresolved. It is a reminder that the cooperative model is a choice, not a default.
The clock, and why it matters
All of this is happening against a tightening natural constraint. Central Asia's water comes from mountain glaciers and snowpack that are shrinking, and the flows of the Syr Darya and Amu Darya are becoming less reliable. Analysts have flagged the summer of 2026 as a test of whether the region's new cooperation can hold under drought. The institutions are improving at the very moment the resource is getting scarcer, and it is not yet clear which is moving faster.
The bottom line. For UzEnergyNews, the water-energy nexus is the foundation under the stories that get the headlines. The regional electricity market and the Trans-Caspian green corridor both assume that hydropower can be dispatched when it is needed — to firm up variable solar and wind, to balance the system, to fill the winter gap. That assumption only holds if the water behind the dams is managed as a shared resource rather than a national weapon. The 2025 trilateral swap and the shared ownership of Kambarata-1 are the first real evidence that the region is choosing the former. The market everyone is building is, in the end, a market in water as much as in power.
Sources: The Times of Central Asia; Eurasianet; The Astana Times; The Diplomat; The Water Diplomat; World Bank; gazeta.uz. Figures reflect mid-2026 public sources.
Asıl Şebeke Su: Orta Asya'nın Elektrik Piyasası Neden 60 Yıllık Bir Soruna Dayanıyor
Orta Asya bölgesel bir elektrik piyasası ve Avrupa'ya yeşil enerji koridoru kuruyor. İkisi de bölgenin Sovyet çöküşünden bu yana çözemediği bir soruna bağlı: yukarı havza ülkeleri kış elektriği için suya, aşağı havza ülkeleri yaz ekini için suya muhtaç. Şimdi yaşanan atılım bir baraj değil — bir ticaret.
Manşetlerin altındaki sorun
Bu yıl Orta Asya'dan gelen manşetler hep iddia üzerine: Dünya Bankası destekli bölgesel elektrik piyasası (REMIT), yenilenebilir enerjiyi Hazar'ın altından Avrupa'ya taşıyacak bir denizaltı kablosu, gigavatlarca yeni güneş ve rüzgâr. Bütün bunların altında, her birinden daha eski olan ve hepsinin işleyip işleyemeyeceğini sessizce belirleyen bir kısıt var. Orta Asya'da elektrik ve su iki ayrı sorun değil, tek bir sorundur. Kazakistan ve Özbekistan'ın pamuğunu ve buğdayını sulayan nehirler, Kırgızistan ve Tacikistan'ın hidroelektriğini üreten nehirlerle aynıdır. Bir ülkenin kışın suyla yaptığı şey, bir başkasının yazın ne ekebileceğini belirler. Bu çatışma yönetilmeden hiçbir bölgesel piyasa tam güvende değildir.
Sovyet pazarlığı ve çöküşü
Çatışma yapısaldır ve bir zamanlar tasarımla çözülmüştü. Sovyetler Birliği döneminde sistem tek bir bütün olarak işletiliyordu. Dağ suyu açısından zengin ama fosil yakıt açısından fakir yukarı havza cumhuriyetleri — Kırgızistan ve Tacikistan — suyu kış boyunca depolayıp yazın, aşağı havzadaki Kazakistan, Özbekistan ve Türkmenistan sulama için ihtiyaç duyduğunda bırakıyordu. Karşılığında kömür ve gaz açısından zengin aşağı havza cumhuriyetleri, soğuk aylarda yukarı havzaya ısınma için yakıt veriyordu. Su yazın aşağı, enerji kışın yukarı akıyordu. Bu bir takastı ve dengeliydi.
Bağımsızlık takası bozdu. Cumhuriyetler ayrı bütçeleri ve tarifeleri olan devletlere dönüşünce, aşağı havza ülkelerinin kuzeye ucuz yakıt göndermek için pek bir nedeni kalmadı; yukarı havza ülkelerinin ise tek bol kaynağını — suyu — en çok ihtiyaç duydukları anda, kışın, kendi elektriğini üretmek için kullanmak için her nedeni vardı. Böylece Kırgızistan, ışıkları ve ısınmayı sürdürmek için kışın barajlarından su bırakmaya başladı; suyu kimsenin ekin için kullanamayacağı soğuk mevsimde aşağı gönderdi ve tarlaların suya muhtaç olduğu yaz için çok azını sakladı. Yılın yanlış zamanında bırakılan aynı su, iki uçta da kıtlık kaynağına dönüştü: yukarıda kış elektrik krizleri, aşağıda yaz sulama açıkları.
Toktogul: dengeyi tutan depo
Bunu hiçbir yapı Kırgızistan'daki Toktogul barajından daha iyi temsil etmez. Sirderya'nın ana kolu Naryn nehri üzerindeki Toktogul, Kırgızistan'ın en büyük santrali ve ülke elektriğinin yaklaşık yüzde 40'ını sağlıyor. Aynı zamanda aşağı havzadaki milyonlarca hektar tarım arazisi için yaz suyunun düzenleyicisidir. İki görev zıt yönlere çekiyor ve deponun su seviyesi skor tabelası. Bu yıl seviye çarpıcı bir tablo çizdi: Toktogul 1 Ocak 2026'da 9,14 milyar metreküp su tutuyordu, 1 Nisan'a gelindiğinde kış ısınma sezonu boyunca çekilerek yalnızca 7 milyar metreküpe inmişti. Kış elektriği üretmek için harcanan her metreküp, yaz sulaması için bulunmayan bir metreküptür. Depo dibe vurduğunda her iki işlev de aynı anda zarar görür — ve her ekim mevsimi, manevra alanı giderek daralan yeni bir su-için-elektrik pazarlığına dönüşür.
2025 takası: mühendislikle değil ticaretle çözmek
En önemli gelişme, bölgenin çatışmayı betonla değil ticaretle yönetmeye başlaması. 8 Eylül 2025'te, Kırgızistan'ın tatil beldesi Cholpon-Ata'daki bir toplantıda, Kazakistan, Kırgızistan ve Özbekistan'ın enerji bakanları ve su idareleri, eski Sovyet mantığını modern bir biçimde canlandıran bir protokol paketi imzaladı. Anlaşmaya göre Kazakistan ve Özbekistan kışın Kırgızistan'a elektrik veriyor; karşılığında Kırgızistan kış su bırakımını azaltıp suyu, aşağı havza ülkelerinin yaz sulaması için Toktogul'da tutuyor. Eylül 2025 ile Nisan 2026 arasında yalnızca Kazakistan bu düzenleme kapsamında kuzeye 1,5 milyar kilovatsaatten fazla elektrik iletti. Kazakistan ayrıca kendi şebekesi üzerinden Rusya'dan Kırgızistan'a elektrik aktarmayı, Özbekistan da 2026'da güney Kazakistan'a arz etmeyi kabul etti.
Bu, takasın bir elektrik ticareti olarak yeniden kurulmasıdır. Yukarı havzayı sıcak tutmak için kömür göndermek yerine aşağı havza ülkeleri kilovatsaat gönderiyor; suyunu kış elektriğine harcamaya zorlanmak yerine yukarı havza ülkesi, suyu depoda tutması için elektrikle ödeniyor. Bunu ölçeklenebilir kılan mekanizma, tam da Dünya Bankası'nın REMIT ile finanse ettiği bölgesel piyasa: ortak bir piyasa, gönülsüzce yapılan ikili bir iyiliği rutin, fiyatlı bir işleme dönüştürüyor.
Kambarata-1 ve ortak sahipliğin mantığı
İkinci gelişme suyun sahibini değiştiriyor. Toktogul'un yukarısında, Naryn üzerinde uzun süredir planlanan Kambarata-1 hidroelektrik santrali nihayet ilerliyor. Santral, 256 metrelik bir barajın ardında 1.860 megavat için tasarlandı; 5,4 milyar metreküplük bir rezervuara ve yaklaşık 4,2 milyar dolarlık inşaat maliyetine sahip. Önemli olan yalnızca megavatlar değil, sahiplik. 2026'dan itibaren santral ortaklaşa finanse edilip sahiplenilecek: Kırgızistan yüzde 34, Kazakistan ve Özbekistan ise yüzde 33'er pay alıyor. Aşağı havza ülkeleri, sularını kontrol eden yukarı havza deposunun ortak sahibi oluyor.
Bölgenin eksik olan kurumsal çözümü budur. Yeni bir depo, kış elektriği ile yaz suyu arasındaki mevsimsel salınımı yumuşatmak için depolama ekler. Ama ortak sahiplik, mühendisliğin tek başına yapamayacağı bir şeyi yapar: aşağı havza devletlerine, suyun nasıl ve ne zaman bırakılacağında doğrudan söz hakkı ve onu kış elektriğine boşaltmak yerine sulama için bırakmakta finansal bir çıkar verir. Finansörler bunu fark etti — Avrupa İmar ve Kalkınma Bankası, Asya Kalkınma Bankası, Asya Altyapı Yatırım Bankası, Avrupa Yatırım Bankası ve OPEC Fonu projeyle ilgilendi. REMIT piyasayı kurarken, Kambarata-1 üç ülkenin ortak tuttuğu varlığı kuruyor.
Rogun ve daha zor vaka
Her yukarı havza projesi işbirliği modelini izlemiyor; Tacikistan'ın Rogun barajı kalan gerilimi gösteriyor. Vahş nehri üzerindeki Rogun, Orta Asya'nın en güçlü hidroelektrik santrali olacak biçimde tasarlandı: tamamlanınca 3.780 megavat, 335 metreyle dünyanın en yüksek barajının ardında, yılda yaklaşık 14.400 gigavatsaat üretim — Tacikistan'ın bugünkü üretiminin kabaca yüzde 70'i. Altı ünitesinden ikisi çalışıyor; üçüncüsü 2027'de bekleniyor. Toplam maliyet yaklaşık 6,2 milyar dolar olarak veriliyor.
Ama Rogun büyük ölçüde ulusal bir proje olarak inşa ediliyor ve finansmanı bu yaklaşımın sınırlarına çarptı. Dünya Bankası Aralık 2024'te 350 milyon dolarlık bir hibe onayladı, ardından desteği askıya aldı; Tacikistan'dan önce sürdürülemez borç yığmayan bir finansman planı sunmasını, uzun vadeli elektrik ihracat anlaşmaları yapmasını ve katı baraj güvenliği standartlarını karşılamasını istedi. Tacikistan, 2026 için kendi kaynağından bir milyar doların üzerinde bütçe ayırarak ilerliyor. Rogun, Kambarata-1'in karşı örneği: muazzam potansiyel, ama tek başına inşa edilmiş; finansman, borç ve aşağı havza suyu soruları hâlâ yanıtsız. İşbirliği modelinin bir varsayılan değil, bir tercih olduğunu hatırlatıyor.
Saat ve neden önemli
Bütün bunlar daralan bir doğal kısıtın gölgesinde yaşanıyor. Orta Asya'nın suyu, küçülen dağ buzullarından ve kar örtüsünden geliyor; Sirderya ve Amuderya'nın akışları daha az güvenilir hale geliyor. Analistler 2026 yazını, bölgenin yeni işbirliğinin kuraklık altında dayanıp dayanamayacağının sınavı olarak işaretledi. Kurumlar, kaynak tam da kıtlaşırken iyileşiyor ve hangisinin daha hızlı hareket ettiği henüz belli değil.
Sonuç. UzEnergyNews açısından su-enerji ikilemi, manşetleri kapan hikâyelerin altındaki temeldir. Bölgesel elektrik piyasası ve Hazar-ötesi yeşil koridor, ikisi de hidroelektriğin ihtiyaç duyulduğunda devreye alınabileceğini varsayar — değişken güneş ve rüzgârı sağlamlaştırmak, sistemi dengelemek, kış açığını kapatmak için. Bu varsayım yalnızca barajların ardındaki su ulusal bir silah olarak değil, ortak bir kaynak olarak yönetilirse geçerlidir. 2025 üçlü takası ve Kambarata-1'in ortak sahipliği, bölgenin ilkini seçtiğinin ilk gerçek kanıtı. Herkesin kurduğu piyasa, sonuçta elektrik kadar su piyasasıdır da.
Kaynaklar: The Times of Central Asia; Eurasianet; The Astana Times; The Diplomat; The Water Diplomat; Dünya Bankası; gazeta.uz. Rakamlar mid-2026 kamuya açık kaynakları yansıtır.
WEEKLY INSIGHT #6 · GAS · COMPARATIVE16 June 2026 · 8 min read · EN/TR · Central Asia
The Importer's Advantage: Türkiye's Gas Distribution Model and the Lesson for a Net-Importer Central Asia
Türkiye imports almost every cubic metre of gas it burns, yet it runs one of Europe's largest and cheapest distribution networks. Uzbekistan sat on one of Central Asia's great gas endowments, yet it became a net importer in 2023 and now rations supply through cold winters. The contrast reframes a question producer states have long answered upstream: energy security is decided as much by the distribution network as by the reservoir.
A network built on imported molecules
Türkiye consumed 58.6 billion cubic metres (bcm) of natural gas in 2025, up 10% year on year, and imported 57.9 bcm of it; domestic production covered roughly 3.1 bcm. On any resource scorecard, Türkiye is structurally short. Downstream, the picture inverts. By the end of 2025 the distribution sector reached 22.8 million subscribers — the third-largest base in Europe — across a network of 235,000 km that grew 7.2% in a single year, reaching 81 provinces, 982 settlements and about 85% of the population. Supply arrives through a deliberately diversified chain: 76% by pipeline, 19% as CNG and 5% as LNG.
The network itself tells a maturity story. Of the 235,000 km, roughly 148,000 km is polyethylene and only about 22,000 km older steel — the profile of a system expanded recently and at scale rather than a legacy grid patched over decades. Demand concentrates where the economy is — Istanbul alone has 5.56 million subscribers, ahead of Ankara (1.99m) and Bursa (1.13m) — but the policy achievement is the long tail. Crucially, the build-out continues: more than $500 million invested in 2025, over $4 billion earmarked for 2025-2026, and 15,856 km of new line laid in a single year. None of it rests on cheap gas at the border; it rests on a downstream model that can finance itself.
How an importer made distribution investable
The mechanism is unglamorous but decisive. Distribution is run by private companies operating under the EPDK regulator within defined regions and tariffs, coordinated through GAZBİR, the distributors' association, which standardises data, training and technical certification. The regulated-return model gives investors a predictable basis to extend pipe into thinner, costlier settlements — work a state budget rarely prioritises. Residential prices remain heavily subsidised at about 2.74 euro-cents/kWh against a European capital-city average above 10, but the subsidy sits on top of, not instead of, an investable network. The pressure shows in the bill rather than the pipe: the average annual household gas cost reached 12,686 TL in 2025, up 55% — an inflation pass-through that keeps the system solvent without abandoning affordability.
2025
🇹🇷 Türkiye (importer)
🇺🇿 Uzbekistan (former producer)
Trade position
Structural importer (57.9 bcm imported)
Net importer since 2023
Production
~3.1 bcm
~42 bcm (down from 61.6 in 2018)
Subscribers / access
22.8m · ~85% of population
Household = largest draw (~42%)
Network
235,000 km (+7.2%)
Transmission bottlenecks, winter pressure loss
Residential price
2.74 €c/kWh (subsidised)
~0.74 €c/kWh ($0.008) — among world's lowest
Reform / investment
Mature regulated model; $4bn+ in 2025-26
Tariffs +71% then +54%; full deregulation 2026
The producer's paradox
Uzbekistan is the mirror image. Output has fallen from 61.6 bcm in 2018 to roughly 42 bcm in 2025, and the country crossed into net-importer status in 2023 — a symbolic break for a state whose identity was built on hydrocarbon abundance. The household sector is now the single largest consumer of gas (about 42%), ahead of power generation, so any supply gap lands directly on voters in winter. The price signal that might have curbed demand was, for years, almost absent: Uzbek households pay around $0.008/kWh, roughly eleven times below the global average and below even Türkiye's subsidised level. The result was predictable — demand production could not follow, recurrent winter shortages, industry told to stand down at peak, and gas-station restrictions reimposed as recently as January 2026. To plug the gap, Tashkent now buys 7 to 7.7 bcm of Russian gas through the Central Asia-Center system, with talk of rising toward 11 bcm.
Reform is now under way, and it moves in Türkiye's direction. The residential tariff rose from 380 to 650 UZS/m³ in 2024 and to 1,000 in May 2025; from 2026 prices track inflation, and a full deregulation of the gas price is planned for the year, with the Asian Development Bank financing transmission modernisation. These are precisely the choices — cost-reflective tariffs, an investable downstream, diversified supply — that Türkiye institutionalised earlier and that turned a permanent importer into a distribution leader.
Reserves are not resilience
The regional backdrop sharpens the point. Turkmenistan still produced 76.5 bcm in 2025, exporting the bulk to China while courting the long-delayed TAPI route toward Afghanistan, Pakistan and India; Azerbaijan remains a net exporter, supplying Türkiye among others. Within the Organization of Turkic States, reserves are not the constraint — distribution, regulation and pricing are. Yet not every element of the Türkiye model transfers cleanly: Türkiye's import diversity rests on geography — Black Sea pipelines, two coastal LNG terminals, floating regasification — that landlocked Central Asia cannot replicate. For Tashkent, supply diversity must be engineered through pipeline interconnection and storage rather than tankers, making the downstream and storage layers even more decisive than they were for Ankara.
The bottom line. For policymakers across Central Asia the Türkiye case offers three transferable lessons: diversify the inbound chain so no single supplier or season dictates security; make the downstream investable through stable, regulated returns rather than the state balance sheet; and let the tariff fund the network, because subsidy can protect households but only a cost-reflective path keeps pipe in the ground and gas at the burner. The producer's instinct is to look at the reservoir. The importer's advantage is that it never could.
Sources: GAZBİR 2025 Natural Gas Distribution Sector Report (EPDK, TÜİK, MGM, HEPI, EuroStat); Times of Central Asia; Caspian Post; Gazeta.uz; Gas Processing & LNG. Figures reflect mid-2026 public sources.
İthalatçının Avantajı: Türkiye'nin Doğal Gaz Dağıtım Modeli ve Net İthalatçı Orta Asya İçin Ders
Türkiye yaktığı gazın neredeyse her metreküpünü ithal ediyor; yine de Avrupa'nın en büyük ve en ucuz dağıtım ağlarından birini işletiyor. Özbekistan Orta Asya'nın en büyük gaz varlıklarından birinin üstündeydi; buna rağmen 2023'te net ithalatçı oldu ve şimdi soğuk kışlarda arzı kısıtlıyor. Bu karşıtlık, üretici devletlerin uzun süredir yukarı-akımda yanıtladığı bir soruyu yeniden çerçeveliyor: enerji güvenliği, rezervuar kadar dağıtım ağında da belirleniyor.
İthal moleküller üzerine kurulu bir ağ
Türkiye 2025'te 58,6 milyar m³ (bcm) doğal gaz tüketti — yıllık +%10 — ve bunun 57,9 bcm'sini ithal etti; yerli üretim yaklaşık 3,1 bcm'yi karşıladı. Her kaynak karnesinde Türkiye yapısal olarak açık veriyor. Aşağı-akımda tablo tersine dönüyor. 2025 sonunda dağıtım sektörü 22,8 milyon aboneye ulaştı — Avrupa'nın 3. en büyük tabanı — bir yılda %7,2 büyüyen 235.000 km şebeke üzerinden; 81 il, 982 yerleşim ve nüfusun yaklaşık %85'ine erişiyor. Arz bilinçli olarak çeşitlendirilmiş: %76 boru, %19 CNG, %5 LNG.
Ağın kendisi bir olgunluk hikâyesi anlatıyor. 235.000 km'nin yaklaşık 148.000 km'si polietilen, yalnızca 22.000 km kadarı eski çelik — onlarca yılda yamalanmış miras bir şebekeden çok, yakın dönemde ve ölçekte genişlemiş bir sistemin profili. Talep ekonominin yoğunlaştığı yerde: tek başına İstanbul 5,56 milyon abone, Ankara (1,99 mn) ve Bursa'nın (1,13 mn) önünde — ama politika başarısı uzun kuyrukta. Daha da önemlisi, inşa sürüyor: 2025'te 500 milyon doları aşan yatırım, 2025-2026 için 4 milyar doların üzerinde kaynak ve tek yılda 15.856 km yeni hat. Bunların hiçbiri sınırdaki ucuz gaza dayanmıyor; kendini finanse edebilen bir aşağı-akım modeline dayanıyor.
Bir ithalatçı dağıtımı nasıl yatırım yapılabilir kıldı
Mekanizma gösterişsiz ama belirleyici. Dağıtım, EPDK düzenlemesi altında belirli bölge ve tarifelerde faaliyet gösteren özel şirketlerce yürütülüyor; veri, eğitim ve teknik belgelendirmeyi standartlaştıran dağıtıcılar birliği GAZBİR aracılığıyla koordine ediliyor. Düzenlenmiş getiri modeli, yatırımcıya boruyu daha ince ve maliyetli yerleşimlere uzatmak için öngörülebilir bir zemin veriyor — devlet bütçesinin nadiren önceliklendirdiği iş. Konut fiyatları ağır sübvansiyonlu kalıyor: yaklaşık 2,74 euro-cent/kWh, Avrupa başkent ortalaması 10'un üzerindeyken. Ama sübvansiyon, yatırım yapılabilir ağın yerine değil üstüne oturuyor. Baskı boruda değil faturada: ortalama yıllık hane gaz gideri 2025'te 12.686 TL'ye çıktı (+%55).
2025
🇹🇷 Türkiye (ithalatçı)
🇺🇿 Özbekistan (eski üretici)
Ticaret konumu
Yapısal ithalatçı (57,9 bcm ithal)
2023'ten beri net ithalatçı
Üretim
~3,1 bcm
~42 bcm (2018'de 61,6'dan)
Abone / erişim
22,8 mn · nüfusun ~%85'i
Hane = en büyük kalem (~%42)
Şebeke
235.000 km (+%7,2)
İletim darboğazı, kış basınç kaybı
Konut fiyatı
2,74 €c/kWh (sübvansiyonlu)
~0,74 €c/kWh ($0,008) — dünyanın en düşüğü
Reform / yatırım
Olgun düzenlenmiş model; 4 mlyr$+ 2025-26
Tarife +%71 sonra +%54; 2026 tam serbestleşme
Üreticinin paradoksu
Özbekistan tam tersi. Üretim 2018'de 61,6 bcm'den 2025'te yaklaşık 42 bcm'ye düştü ve ülke 2023'te net ithalatçı statüsüne geçti — kimliğini hidrokarbon bolluğu üzerine kurmuş bir devlet için simgesel bir kırılma. Hane sektörü artık tek başına en büyük gaz tüketicisi (yaklaşık %42), elektrik üretiminin önünde; dolayısıyla her arz açığı kışın doğrudan seçmene iniyor. Talebi dizginleyebilecek fiyat sinyali yıllarca neredeyse yoktu: Özbek haneleri yaklaşık $0,008/kWh ödüyor, küresel ortalamanın kabaca on bir katı altında ve Türkiye'nin sübvansiyonlu seviyesinin bile altında. Sonuç öngörülebilirdi — üretimin yetişemediği talep, tekrarlayan kış kıtlıkları, zirvede durdurulan sanayi ve en son Ocak 2026'da yeniden konan istasyon kısıtlamaları. Açığı kapatmak için Taşkent artık Orta Asya-Merkez sistemi üzerinden 7-7,7 bcm Rus gazı alıyor, yıllık 11 bcm'ye doğru.
Reform şimdi başladı ve Türkiye'nin yönünde ilerliyor. Konut tarifesi 2024'te 380'den 650 UZS/m³'e, Mayıs 2025'te 1.000'e çıktı; 2026'dan itibaren fiyatlar enflasyona endeksli ve yıl içinde gaz fiyatının tam serbestleştirilmesi planlanıyor; Asya Kalkınma Bankası iletim modernizasyonunu finanse ediyor. Bunlar tam da — maliyet-yansıtan tarifeler, yatırım yapılabilir aşağı-akım, çeşitlendirilmiş arz — Türkiye'nin daha önce kurumsallaştırdığı ve kalıcı bir ithalatçıyı dağıtım liderine dönüştüren tercihler.
Rezerv, dayanıklılık değildir
Bölgesel arka plan noktayı keskinleştiriyor. Türkmenistan 2025'te yine 76,5 bcm üretti; büyük kısmını Çin'e ihraç ederken uzun süredir ertelenen TAPI hattını (Afganistan-Pakistan-Hindistan) gündemde tutuyor. Azerbaycan net ihracatçı olmayı sürdürüyor ve diğerlerinin yanı sıra Türkiye'ye veriyor. Türk Devletleri Teşkilatı içinde kısıt rezerv değil — dağıtım, düzenleme ve fiyatlama. Yine de her Türkiye çözümü birebir aktarılamaz: Türkiye'nin ithalat çeşitliliği bir coğrafyaya dayanıyor — Karadeniz boru hatları, iki kıyı LNG terminali, yüzer gazlaştırma — ki karayla çevrili Orta Asya bunu kopyalayamaz. Taşkent için arz çeşitliliği tankerlerle değil, boru ara-bağlantısı ve depolamayla mühendislik edilmek zorunda; bu da aşağı-akım ve depolama katmanlarını Ankara için olduğundan bile daha belirleyici kılıyor.
Sonuç. Orta Asya'daki karar alıcılar için Türkiye örneği üç aktarılabilir ders sunuyor: giriş zincirini çeşitlendir ki tek bir tedarikçi veya mevsim güvenliği belirlemesin; genişlemeyi devlet bilançosuna bırakmak yerine istikrarlı, düzenlenmiş getirilerle aşağı-akımı yatırım yapılabilir kıl; ve tarifenin ağı finanse etmesine izin ver, çünkü sübvansiyon haneyi koruyabilir ama yalnızca maliyet-yansıtan bir patika boruyu toprakta, gazı brülörde tutar. Üreticinin içgüdüsü rezervuara bakmaktır. İthalatçının avantajı ise hiçbir zaman bakamamış olmasıdır.
Kaynaklar: GAZBİR 2025 Doğal Gaz Dağıtım Sektörü Raporu (EPDK, TÜİK, MGM, HEPI, EuroStat); Times of Central Asia; Caspian Post; Gazeta.uz; Gas Processing & LNG. Rakamlar 2026 ortası kamuya açık kaynakları yansıtır.
Previous insights
WEEKLY INSIGHT #5 · NUCLEAR · SMR6 June 2026 · 9 min read · Eurasia
Small Modular Reactors: From Blueprint to First Concrete — Where Eurasia Enters the Global SMR Race
Small modular reactors have spent a decade as a PowerPoint promise. In 2026 that changes. China's Linglong One is weeks away from becoming the world's first land-based commercial SMR; Uzbekistan poured first concrete on a Russian RITM-200N in March; Türkiye has signed an i-SMR cooperation with South Korea. Yet not one Western SMR is operating, NuScale's flagship US project collapsed, and the economics remain unproven. For a region building nuclear from a near-zero base, the SMR question is strategic before it is technical.
What an SMR actually is — and isn't
A small modular reactor is any reactor under 300 MWe whose components are factory-built and shipped to site rather than poured in place. The pitch is compelling: smaller footprint, enhanced passive safety, lower upfront capital, and — crucially for emerging economies — access to nuclear capacity without the decade-long, multi-billion-dollar construction marathon of a conventional gigawatt plant. The catch is equally important: as of mid-2026 there is no large, commercially operating SMR fleet anywhere in the world. Almost every design is still pre-commercial.
The global pipeline: China leads, the West stalls
The gap between East and West has become the defining feature of the SMR race. China's CNNC pushed Linglong One through an IAEA safety review back in 2016 — the first SMR to clear it — and is now on the verge of commercial operation. Russia already exports a floating model. The Western pipeline, by contrast, will not deliver commercial units before 2029 at the earliest.
Project / Country
Capacity
Status (mid-2026)
Linglong One (ACP100) · China
125 MWe
First land-based commercial SMR; cold tests done, start H1 2026
Akademik Lomonosov · Russia
2×35 MWe
Floating SMR, operating since 2020 (exportable model)
BWRX-300 (Darlington) · Canada
300 MWe
Licensed construction site; ~2029 — closest Western project
In Generic Design Assessment; not yet broken ground
i-SMR · South Korea
170 MWe
Design approval targeted 2028, commercial ~2035
How big could this get? The forecasts
The studies disagree on the destination but agree on the direction. The OECD-NEA's SMR Dashboard Edition III (July 2025) catalogued 127 distinct SMR technologies worldwide; the IAEA tracks 80-plus designs in active development, with the United States alone fielding 18. On capacity, the NEA's ambitious case sees 375 GWe of SMRs by 2050; the IAEA's high scenario puts total nuclear at 992 GW by 2050 with SMRs supplying roughly a quarter of all new capacity added — though its low case keeps that share near 5 percent. Commercially, the SMR market is valued around $6.5 billion in 2025, rising toward $10.7 billion by 2033. The spread between the bullish and bearish cases is the real headline: this is a technology being underwritten politically before it is proven economically.
The new demand driver: AI data centres
What has revived SMR momentum is not the power grid — it is the hyperscaler. AI data centres need round-the-clock, carbon-free baseload at a scale and speed conventional plants cannot supply, and developers are now pairing compute campuses directly with nuclear. NuScale has openly repositioned toward data-centre demand, and "behind-the-meter" reactor-for-datacentre deals have become the sector's most credible near-term commercial pull. For Eurasia, the lesson is that SMR economics may first close not in the residential grid but in industrial and digital-infrastructure loads.
Eurasia's entry: Uzbekistan and Türkiye
Uzbekistan is building the region's first reactor as an integrated plant — two large VVER-1000 units plus two RITM-200N small modular reactors of 55 MWe each (a 190 MWt design adapted from Russia's nuclear icebreakers, 60-year design life). First concrete was poured at the Farish district, Jizzakh region site in March 2026, with phased commissioning of early facilities targeted by year-end. It is, in effect, Central Asia's debut in both large and small nuclear at once — built on the Rosatom relationship.
Türkiye is layering an SMR track onto its existing programme. Alongside the 4,800 MW Akkuyu plant (ROSATOM) and talks for Sinop and Thrace, Ankara signed a TÜNAŞ–KEPCO memorandum (Nov 2025) and an i-SMRDA–Nuclean SMR cooperation (June 2026) with South Korea. A quiet enabler sits behind that choice: a January 2025 IP settlement bars Korea's KHNP from bidding new reactors across most Western markets for 50 years — pushing Seoul toward partners like Türkiye and lifting Ankara's negotiating leverage.
The reality check
None of this guarantees electrons. SMRs still carry high first-of-a-kind capital cost, 7-to-10-year build timelines, immature licensing frameworks, and no commercially proven reference plant outside China and Russia's state programmes. Financing is the deepest constraint — long-tenor nuclear lending is hard to arrange in high-inflation, FX-volatile economies. Fuel supply, waste and public acceptance remain open questions.
The bottom line. The first commercial decade of SMRs will belong to state-backed programmes — China at home, Russia through exports — not the Western start-ups that wrote the early narrative. For Eurasian buyers the real value is not cheap near-term power; it is diversification and industrial entry: a seat in the global SMR supply chain rather than a stack of licence fees. The countries that treat SMRs as an industrial-policy instrument — localising components, building regulatory and engineering capacity — will gain far more than those that simply import a reactor. Atomic geopolitics, increasingly, is decided in the supply chain.
Sources: IAEA — Advances in SMR Technology Developments; OECD-NEA SMR Dashboard Edition III (July 2025); World Nuclear News; The Diplomat; regional strategic literature. Figures reflect mid-2026 public sources.
Küçük Modüler Reaktörler: Sunumdan İlk Betona — Avrasya Küresel SMR Yarışına Nereden Giriyor
Küçük modüler reaktörler on yıldır bir "sunum vaadi" olarak kaldı. 2026'da bu değişiyor. Çin'in Linglong One'ı dünyanın ilk kara-tabanlı ticari SMR'ı olmaya haftalar uzaklıkta; Özbekistan Mart ayında bir Rus RITM-200N için ilk betonu döktü; Türkiye Güney Kore ile i-SMR işbirliği imzaladı. Buna karşılık tek bir Batılı SMR bile işletmede değil, NuScale'in ABD'deki amiral projesi çöktü ve ekonomisi hâlâ kanıtlanmadı. Nükleeri neredeyse sıfırdan kuran bir bölge için SMR sorusu, teknik olmadan önce stratejiktir.
SMR tam olarak nedir — ne değildir
Küçük modüler reaktör, 300 MWe altında olup bileşenleri sahada dökülmek yerine fabrikada üretilip sahaya taşınan her reaktördür. Vaadi güçlü: küçük ayak izi, artırılmış pasif güvenlik, düşük başlangıç sermayesi ve — gelişmekte olan ekonomiler için kritik — geleneksel gigavatlık santralin on yıllık, milyarlarca dolarlık inşaat maratonu olmadan nükleer kapasiteye erişim. Püf noktası da o kadar önemli: 2026 ortası itibarıyla dünyanın hiçbir yerinde büyük, ticari işletmede bir SMR filosu yok. Neredeyse her tasarım hâlâ ticari-öncesi.
Küresel boru hattı: Çin önde, Batı takılı
Doğu ile Batı arasındaki açık, SMR yarışının belirleyici özelliği hâline geldi. Çin'in CNNC'si Linglong One'ı daha 2016'da bir IAEA güvenlik incelemesinden geçirdi — bunu başaran ilk SMR — ve şimdi ticari işletmenin eşiğinde. Rusya yüzer modeli zaten ihraç ediyor. Batı boru hattı ise ticari üniteleri en erken 2029'dan önce veremeyecek.
Proje / Ülke
Kapasite
Durum (2026 ortası)
Linglong One (ACP100) · Çin
125 MWe
İlk kara-tabanlı ticari SMR; soğuk testler bitti, başlangıç 2026 1.Y
Akademik Lomonosov · Rusya
2×35 MWe
Yüzer SMR, 2020'den beri işletmede (ihraç edilebilir model)
BWRX-300 (Darlington) · Kanada
300 MWe
Lisanslı inşaat sahası; ~2029 — en yakın Batılı proje
NuScale (VOYGR) · ABD
77 MWe/mod
NRC onaylı tasarım; amiral Utah projesi 2023'te iptal
Rolls-Royce SMR · İngiltere
470 MWe
Genel Tasarım Değerlendirmesinde; henüz inşaata başlamadı
i-SMR · Güney Kore
170 MWe
Tasarım onayı 2028 hedefi, ticari ~2035
Bu ne kadar büyür? Tahminler
Çalışmalar varış noktasında ayrışıyor ama yönde hemfikir. OECD-NEA'nın SMR Dashboard Edition III'ü (Temmuz 2025) dünya genelinde 127 ayrı SMR teknolojisi kataloglardı; IAEA 80'in üzerinde aktif tasarım izliyor, yalnızca ABD'de 18. Kapasitede, NEA'nın iddialı senaryosu 2050'de 375 GWe SMR öngörüyor; IAEA'nın yüksek senaryosu toplam nükleeri 2050'de 992 GW ve SMR'ı eklenen yeni kapasitenin yaklaşık dörtte biri olarak konumluyor — düşük senaryoda bu pay %5 civarında. Ticari olarak SMR pazarı 2025'te ~6,5 milyar $, 2033'e doğru 10,7 milyar $'a çıkıyor. Asıl manşet iyimser ile kötümser senaryo arasındaki uçurum: bu, geleceği ekonomik olarak değil siyasi olarak garanti altına alınan bir teknoloji.
Yeni talep itici gücü: AI veri merkezleri
SMR ivmesini yeniden canlandıran şey elektrik şebekesi değil — hyperscaler. AI veri merkezleri, geleneksel santrallerin sağlayamayacağı ölçek ve hızda kesintisiz, karbonsuz baz yük istiyor; geliştiriciler artık hesaplama kampüslerini doğrudan nükleerle eşleştiriyor. NuScale açıkça veri merkezi talebine yöneldi ve "sayaç-arkası" reaktör-veri merkezi anlaşmaları sektörün en inandırıcı kısa vadeli ticari çekişi oldu. Avrasya için ders: SMR ekonomisi ilk olarak konut şebekesinde değil, sanayi ve dijital altyapı yüklerinde tutabilir.
Avrasya'nın girişi: Özbekistan ve Türkiye
Özbekistan, bölgenin ilk reaktörünü bir entegre santral olarak inşa ediyor — iki büyük VVER-1000 ünitesi artı her biri 55 MWe iki RITM-200N küçük modüler reaktör (Rusya'nın nükleer buz kırıcılarından uyarlanmış 190 MWt tasarım, 60 yıl ömür). İlk beton, Jizzakh bölgesi Farish ilçesindeki sahaya Mart 2026'da döküldü; erken tesislerin kademeli devreye alınması yıl sonu hedefli. Bu, fiilen Orta Asya'nın hem büyük hem küçük nükleere aynı anda girişi — Rosatom ilişkisi üzerine kurulu.
Türkiye, mevcut programının üzerine bir SMR kulvarı ekliyor. 4.800 MW Akkuyu (ROSATOM) ve Sinop-Trakya görüşmelerinin yanında, Ankara Güney Kore ile TÜNAŞ–KEPCO mutabakatı (Kasım 2025) ve i-SMRDA–Nuclean SMR işbirliği (Haziran 2026) imzaladı. Bu tercihin arkasında sessiz bir kolaylaştırıcı var: Ocak 2025 fikri mülkiyet uzlaşması, Kore'nin KHNP'sini 50 yıl boyunca çoğu Batı pazarında yeni reaktör ihalesinden meneder — Seul'ü Türkiye gibi ortaklara yöneltir ve Ankara'nın pazarlık gücünü artırır.
Gerçeklik kontrolü
Bunların hiçbiri elektron garantisi değil. SMR'lar hâlâ yüksek ilk-tip (FOAK) sermaye maliyeti, 7–10 yıllık inşaat süreleri, olgunlaşmamış lisanslama çerçeveleri ve Çin ile Rusya'nın devlet programları dışında ticari olarak kanıtlanmış bir referans tesis olmaması yükünü taşıyor. En derin kısıt finansman — yüksek enflasyon ve döviz oynaklığı olan ekonomilerde uzun vadeli nükleer kredi düzenlemek zor. Yakıt temini, atık ve kamu kabulü açık sorular.
Sonuç. SMR'ların ilk ticari on yılı, erken anlatıyı yazan Batılı girişimlerin değil, devlet destekli programların olacak — içeride Çin, ihracatta Rusya. Avrasyalı alıcılar için asıl değer ucuz kısa vadeli güç değil; çeşitlendirme ve sanayi girişidir: bir yığın lisans bedeli yerine küresel SMR tedarik zincirinde bir koltuk. SMR'ları bir sanayi politikası aracı olarak gören — bileşen yerlileştiren, regülasyon ve mühendislik kapasitesi kuran — ülkeler, sadece reaktör ithal edenlerden çok daha fazlasını kazanacak. Atomun jeopolitiği giderek tedarik zincirinde karara bağlanıyor.
Kaynaklar: IAEA — Advances in SMR Technology Developments; OECD-NEA SMR Dashboard Edition III (Temmuz 2025); World Nuclear News; The Diplomat; bölgesel stratejik literatür. Rakamlar 2026 ortası kamuya açık kaynakları yansıtır.
WEEKLY INSIGHT #4 · SECTOR OUTLOOK3 June 2026 · 10 min read · Türkiye
Türkiye's Power Capacity Roadmap — From 31.8 GW to 227 GW, and the Grid That Must Carry It
Türkiye's electricity sector has scaled 3.9× since 2003 — from 31.8 GW to 125.4 GW — at a 7.6 percent compound annual growth rate. The National Energy Plan (UEP) 2035 pushes the next leg even higher: 227 GW of total installed capacity by 2035, with 104 GW to be built in the next decade and roughly 70 percent of the system coming from renewables. The question is no longer whether the capacity will be there — it is whether the grid can carry it.
The thesis
For 22 years Türkiye's electricity sector has run a single dominant story: capacity expansion. From the 31.8 GW base of 2003 to today's 125.4 GW, the system has tripled and changed colour. Hydropower and conventional thermal anchored the first decade; renewable support schemes (YEKDEM, YEKA) and large competitive auctions transformed the second; and an unlicensed-solar wave has shaped the third. By April 2026, renewables — hydro, solar, wind, geothermal, biomass — supplied 56.7 percent of installed capacity, while gas had fallen from 24.6 percent to 19.9 percent and coal from 28.8 percent to 17.9 percent.
The next ten years tell a different story. With the National Energy Plan targeting 227 GW by 2035, roughly 104 GW of new capacity has to be built — at scale, on schedule, and tightly integrated with a grid that has not yet been designed for it. The thesis for the next decade is not megawatts. It is system flexibility, dispatch intelligence, storage and grid modernisation. Capacity is the story that already happened; grid is the story that is about to.
1. The 2003–2026 trajectory
The capacity record is the cleanest evidence of structural transformation. Total installed power grew at a 7.6 percent compound annual rate, more than triple the pace of population growth. The composition shift is even more telling than the absolute number.
Source
2003 (MW)
April 2026 (MW)
Change (MW)
CAGR
Hydropower
11,080
32,338
+21,258
4.8%
Solar
0
26,769
+26,769
n/a
Natural Gas
7,846
25,013
+17,167
5.2%
Wind
390
15,075
+14,685
17.4%
Domestic coal
4,170
11,565
+7,395
4.6%
Imported coal
5,015
10,456
+5,441
3.3%
Biomass
1,153
2,396
+1,243
3.3%
Geothermal
192
1,798
+1,606
10.3%
TOTAL
31,846
125,410
+93,564
7.6%
Three observations are central. First, wind's 17.4 percent CAGR over 22 years is one of the most aggressive renewable scale-ups in any G20 market. Second, solar went from zero in 2003 to 26.8 GW in 2026 — the second-largest installed source today, behind hydro. Third, gas continued to grow in absolute terms (+17.2 GW) even as its share fell, reflecting a peaker and balancing role rather than the dominant baseload narrative of the early 2000s.
Source group
2003 share
April 2026 share
Change
Renewables (hydro + solar + wind + geo + biomass)
43.2%
56.7%
+13.5 pts
Natural gas
24.6%
19.9%
−4.7 pts
Coal (domestic + imported)
28.8%
17.9%
−10.9 pts
Other (biomass, geothermal)
3.4%
5.5%
+2.1 pts
The 2026 system is not a marginal improvement on the 2003 system — it is a structurally different system, defined by very different operational characteristics, very different finance economics, and very different grid-integration challenges.
2. The 2035 destination
Türkiye's Ministry of Energy and Natural Resources published the National Energy Plan (UEP) in 2023 with horizons aligned to the 2053 net-zero target. The 2035 target was updated to 227 GW in late 2025, up from the original 189.7 GW in the 2023 baseline document. The revision reflects the unexpected acceleration in solar and wind installations of the past three years and a higher projection of 2035 electricity demand.
The 2035 architecture spans eight dimensions:
Demand: gross electricity consumption from 361 TWh (2025) to 510 TWh (2035) — a 41 percent increase
Capacity: installed power from 122.5 GW (2025) to 227 GW (2035) — 104 GW to be built
Renewables: solar plus wind from 38.6 GW to 120 GW, roughly 70 percent of the system
Supply security: hydro from 32 to 35 GW, nuclear baseload retention
Grid: smart grid, SCADA, distribution management systems, advanced metering infrastructure
Storage:7.5 GW of grid-scale battery storage
Hydrogen:5 GW of electrolyser capacity (green hydrogen for hard-to-decarbonise industry)
Efficiency: 50 percent improvement in primary energy intensity
Source
2025 (GW)
2035 target (GW)
Change
Multiple
Solar
25.0
70.0
+45.0
2.8×
Wind
13.6
50.0
+36.4
3.7×
Hydro
32.0
35.0
+3.0
1.1×
Natural gas
25.0
20.0
−5.0
0.8×
Other (coal, geo, bio, nuclear)
26.9
52.0
+25.1
1.9×
TOTAL
122.5
227.0
+104.5
1.9×
3. Demand growth — where the 149 TWh comes from
Demand projections are typically the most contested numbers in any national plan. UEP 2035 puts the figure at 510 TWh, requiring 149 TWh of additional annual consumption over 2025–2035. The drivers are structural rather than cyclical: economic growth and industrial expansion; the electrification of heating and transport; data centre demand from AI and the digital economy; heat pump deployment; electric vehicle penetration.
The directional logic matches what is visible across other large European and OECD economies. The empirical test will be whether Türkiye can sustain 4 percent annual electricity demand growth through 2035 — a level that has been rare in mature systems but is fully consistent with developing-market urbanisation and industrial scale-up. The bottom-up build-out of solar and wind, supported by battery storage and a modernised grid, will determine whether that demand can be served reliably.
4. International benchmark — Türkiye at 3.9 MWh/capita
Per-capita electricity consumption is the cleanest single measure of how far Türkiye still has to travel. At 3.9 MWh per person in 2024, Türkiye sits roughly 71 percent of the EU-27 average (5.5 MWh) and 52 percent of the OECD average (7.5 MWh). The 2035 target of 5.6 MWh per capita would converge with today's EU average — a meaningful catch-up that itself drives much of the demand growth.
Country / region
Per-capita (MWh, 2024)
Vs. Türkiye
Norway
23.4
6.0×
United States
13.0
3.3×
OECD average
7.5
1.9×
Germany
6.3
1.6×
EU-27 average
5.5
1.4×
Türkiye (UEP 2035 target)
5.6
1.4×
United Kingdom
4.3
1.1×
Türkiye (2024)
3.9
1.0×
South Africa
3.5
0.9×
The implication for distribution operators, regulators and lenders is clear: Türkiye's demand curve has structural growth embedded in the demographics and the industrial path. The investment frameworks — EPDK tariff cycles, allowed revenue bases, network capacity expansion approvals — will need to operate on a trajectory of demand growth, not stability.
5. The grid is the constraint
If the 2003–2026 story was capacity, the 2026–2035 story will be the grid. The 2035 architecture explicitly treats grid modernisation, storage, digitalisation and flexibility as the binding constraints — not as auxiliary line items.
Three specific commitments stand out. Battery storage at 7.5 GW by 2035 — designed to manage daily and seasonal solar-and-wind variability, reduce balancing-market exposure and support frequency stability. Advanced metering infrastructure (AMI) rollout across distribution networks — enabling demand-side response, prosumer integration and loss-reduction analytics. 5 GW of electrolyser capacity for green hydrogen — targeting hard-to-abate sectors (steel, cement, fertilisers) and long-distance transport where direct electrification is uneconomic.
The financial scale of grid investment in Türkiye through 2035 — across transmission, distribution and storage — is on the order of $5–8 billion per year. For international developers, EPC contractors, OEMs (transformers, switchgear, BESS, smart meters) and lenders, this is one of the largest single grid modernisation programmes in the region across the decade ahead.
6. What this means for international participants
The implications differ by segment, but the central message is consistent: capacity build-out alone will not absorb the investment opportunity. Six adjacent fields stand out:
Utility-scale solar and wind developers: 81.4 GW of new solar+wind capacity needed (45 GW solar, 36.4 GW wind) — competitive auctions and YEKA-style frameworks will channel much of this
BESS system integrators: 7.5 GW of battery storage with both grid-services and project-paired economics
Transmission and distribution OEMs: transformers, switchgear, HV cables for connecting 104 GW of new generation
Smart meter and AMI vendors: distribution-wide AMI rollout supporting prosumer markets
Multilateral and commercial lenders: EBRD, IFC, ADB, EIB and DFI participation across all of the above
The bottom line. Türkiye's electricity sector grew 3.9× over 22 years. The next decade will add another 104 GW of capacity and require a fundamentally different grid — one designed for variable renewables, distributed generation, storage and digital dispatch. The capacity question is now well-understood; the grid question is the next decade's investment story. For international developers, lenders and operators tracking Eurasia, the 2026–2035 window is one of the deepest single-country opportunities in the region.
Sources: T.C. Energy and Natural Resources Ministry (ETKB) — April 2026 Capacity Bulletin and National Energy Plan 2020–2035; TEİAŞ October 2025 figures; IEA Electricity 2026; Eurostat 2025; EPDK Monthly Sector Reports.
Türkiye'nin Kurulu Güç Yol Haritası — 31,8 GW'tan 227 GW'a ve O Yükü Taşıması Gereken Şebeke
Türkiye elektrik sektörü 2003'ten bu yana 3,9 katına çıktı — 31,8 GW'tan 125,4 GW'a, yıllık %7,6 bileşik büyüme. Ulusal Enerji Planı (UEP) 2035 sonraki ayağı daha da yukarı çekiyor: 2035'te 227 GW toplam kurulu güç, önümüzdeki on yılda inşa edilecek yaklaşık 104 GW ve sistemin yaklaşık %70'i yenilenebilir kaynaklardan. Soru artık kapasitenin orada olup olmayacağı değil — şebekenin onu taşıyıp taşıyamayacağı.
Ana tez
22 yıldır Türkiye elektrik sektörünün baskın bir hikayesi vardı: kapasite genişlemesi. 2003'teki 31,8 GW tabanından bugünkü 125,4 GW'a sistem üç katına çıktı ve rengini değiştirdi. İlk on yılı hidroelektrik ve geleneksel termal yatırımlar; ikincisini yenilenebilir destek mekanizmaları (YEKDEM, YEKA) ve büyük rekabetçi ihaleler şekillendirdi; üçüncüsünü ise lisanssız güneş dalgası belirledi. Nisan 2026 itibarıyla yenilenebilir kaynaklar — hidro, güneş, rüzgar, jeotermal, biyokütle — kurulu gücün %56,7'sini, doğal gaz %19,9'unu (2003'te %24,6 idi) ve kömür %17,9'unu (2003'te %28,8 idi) oluşturuyor.
Önümüzdeki on yıl farklı bir hikaye anlatacak. Ulusal Enerji Planı 2035'te 227 GW hedeflediği için yaklaşık 104 GW yeni kapasitenin — büyük ölçekte, takvime sadık ve henüz onun için tasarlanmamış bir şebekeyle sıkıca entegre — inşa edilmesi gerekiyor. Sonraki on yılın tezi megavat değil. Sistem esnekliği, dispeç zekası, depolama ve şebeke modernizasyonu. Kapasite zaten yaşanmış hikaye; şebeke az sonra başlayacak olan.
1. 2003–2026 yörüngesi
Kapasite kaydı yapısal dönüşümün en net kanıtı. Toplam kurulu güç yıllık bileşik %7,6 büyüdü — nüfus artışının üç katından fazla. Kompozisyon değişimi mutlak rakamdan daha çok şey anlatıyor.
Kaynak
2003 (MW)
Nisan 2026 (MW)
Değişim (MW)
YBBO
Hidroelektrik
11.080
32.338
+21.258
%4,8
Güneş
0
26.769
+26.769
n/a
Doğal Gaz
7.846
25.013
+17.167
%5,2
Rüzgar
390
15.075
+14.685
%17,4
Yerli Kömür
4.170
11.565
+7.395
%4,6
İthal Kömür
5.015
10.456
+5.441
%3,3
Biyokütle
1.153
2.396
+1.243
%3,3
Jeotermal
192
1.798
+1.606
%10,3
TOPLAM
31.846
125.410
+93.564
%7,6
Üç gözlem merkezi. Birincisi, rüzgarın 22 yıllık %17,4 YBBO'su herhangi bir G20 piyasasındaki en agresif yenilenebilir ölçeklemelerinden biri. İkincisi, güneş 2003'te sıfırdan 2026'da 26,8 GW'a yükseldi — bugün hidronun arkasında ikinci en büyük kurulu kaynak. Üçüncüsü, gaz payı düşmesine rağmen mutlak değerde büyümeye devam etti (+17,2 GW), 2000'lerin başındaki baskın baz yük anlatısı yerine peaker ve dengeleme rolünü yansıtıyor.
Kaynak grubu
2003 payı
Nisan 2026 payı
Değişim
Yenilenebilir (hidro + güneş + rüzgar + jeo + biyokütle)
%43,2
%56,7
+13,5 puan
Doğal Gaz
%24,6
%19,9
−4,7 puan
Kömür (yerli + ithal)
%28,8
%17,9
−10,9 puan
Diğer (biyokütle, jeotermal)
%3,4
%5,5
+2,1 puan
2026 sistemi 2003 sisteminin marjinal iyileştirmesi değil — operasyonel özellikleri, finans ekonomisi ve şebeke entegrasyon zorlukları çok farklı, yapısal olarak farklı bir sistem.
2. 2035 hedefi
T.C. Enerji ve Tabii Kaynaklar Bakanlığı Ulusal Enerji Planı'nı (UEP) 2023'te 2053 net sıfır hedefine uyumlu ufuklarla yayımladı. 2035 hedefi 2025 sonunda 227 GW'a güncellendi, 2023 baz dokümandaki orijinal 189,7 GW'tan yükseldi. Revizyon, son üç yıldaki beklenmedik güneş ve rüzgar kurulum hızlanmasını ve 2035 elektrik talebindeki daha yüksek projeksiyonu yansıtıyor.
2035 mimarisi sekiz boyutu kapsıyor:
Talep: brüt elektrik tüketimi 361 TWh (2025) → 510 TWh (2035) — %41 artış
Kapasite: kurulu güç 122,5 GW (2025) → 227 GW (2035) — 104 GW inşa edilecek
Yenilenebilir: güneş + rüzgar 38,6 GW → 120 GW, sistemin yaklaşık %70'i
Arz güvenliği: hidro 32 → 35 GW, nükleer baz yük korunumu
Şebeke: akıllı şebeke, SCADA, dağıtım yönetim sistemleri, gelişmiş sayaç altyapısı (AMI)
Depolama:7,5 GW şebeke ölçekli batarya enerji depolama
Hidrojen:5 GW elektrolizör kapasitesi (zor karbondan arındırılan sanayi için yeşil hidrojen)
Verimlilik: birincil enerji yoğunluğunda %50 iyileşme
Kaynak
2025 (GW)
2035 hedef (GW)
Değişim
Kat
Güneş
25,0
70,0
+45,0
2,8×
Rüzgar
13,6
50,0
+36,4
3,7×
Hidro
32,0
35,0
+3,0
1,1×
Doğal gaz
25,0
20,0
−5,0
0,8×
Diğer (kömür, jeo, biyo, nükleer)
26,9
52,0
+25,1
1,9×
TOPLAM
122,5
227,0
+104,5
1,9×
3. Talep büyümesi — 149 TWh nereden geliyor
Talep projeksiyonları herhangi bir ulusal plandaki en tartışmalı rakamlar. UEP 2035 rakamı 510 TWh'a koyuyor, 2025–2035 döneminde yıllık ek 149 TWh tüketim gerektiriyor. Sürücüler döngüsel değil yapısal: ekonomik büyüme ve sanayi genişlemesi; ısıtma ve ulaşımın elektrifikasyonu; yapay zeka ve dijital ekonomiden veri merkezi talebi; ısı pompası kullanımı; elektrikli ulaşım yaygınlaşması.
Yönsel mantık diğer büyük Avrupa ve OECD ekonomilerinde de görülen pattern'le örtüşüyor. Ampirik test Türkiye'nin 2035'e kadar yıllık %4 elektrik talep büyümesini sürdürüp sürdüremeyeceği olacak — olgun sistemlerde nadir görülen ama gelişen pazar kentleşme ve sanayi ölçeklemesi ile tam tutarlı bir seviye. Aşağıdan yukarı güneş ve rüzgar inşası, batarya depolama ve modernize edilmiş şebeke ile desteklenerek, bu talebin güvenilir şekilde karşılanıp karşılanamayacağını belirleyecek.
4. Uluslararası karşılaştırma — Türkiye 3,9 MWh/kişi
Kişi başı elektrik tüketimi Türkiye'nin daha ne kadar yol kat etmesi gerektiğinin en net tek ölçüsü. 2024'te kişi başına 3,9 MWh ile Türkiye AB-27 ortalamasının (5,5 MWh) yaklaşık %71'inde ve OECD ortalamasının (7,5 MWh) %52'sinde. 2035 hedefi olan 5,6 MWh/kişi bugünkü AB ortalamasıyla yakınlaşır — kendisi talep büyümesinin önemli bir bölümünü sürükleyen anlamlı bir yakalama.
Ülke / bölge
Kişi başı (MWh, 2024)
Türkiye'ye oran
Norveç
23,4
6,0×
ABD
13,0
3,3×
OECD ortalaması
7,5
1,9×
Almanya
6,3
1,6×
AB-27 ortalaması
5,5
1,4×
Türkiye (UEP 2035 hedef)
5,6
1,4×
İngiltere
4,3
1,1×
Türkiye (2024)
3,9
1,0×
Güney Afrika
3,5
0,9×
Dağıtım operatörleri, regülatörler ve kreditörler için anlam net: Türkiye'nin talep eğrisinde demografik ve sanayi yolunda yapısal büyüme gömülü. Yatırım çerçeveleri — EPDK tarife döngüleri, izin verilen gelir tabanları, şebeke kapasite genişleme onayları — istikrar değil talep büyümesi yörüngesinde çalışması gerekecek.
5. Şebeke kısıt
2003–2026 hikayesi kapasiteyse, 2026–2035 hikayesi şebeke olacak. 2035 mimarisi açıkça şebeke modernizasyonu, depolama, dijitalleşme ve esnekliği bağlayıcı kısıtlar olarak ele alıyor — yardımcı satır kalemleri olarak değil.
Üç spesifik taahhüt öne çıkıyor. 2035'e kadar 7,5 GW batarya depolama — günlük ve mevsimsel güneş-rüzgar değişkenliğini yönetmek, dengeleme piyasası maruziyetini azaltmak ve frekans kararlılığını desteklemek için tasarlanmış. Dağıtım şebekeleri genelinde gelişmiş sayaç altyapısı (AMI) yaygınlaşması — talep yönü yanıtı, prosumer entegrasyonu ve kayıp azaltma analitiği için. Yeşil hidrojen için 5 GW elektrolizör kapasitesi — zor karbondan arındırılan sektörler (çelik, çimento, gübre) ve doğrudan elektrifikasyonun ekonomik olmadığı uzun mesafe ulaşım için.
Türkiye'de 2035'e kadar şebeke yatırımının finansal ölçeği — iletim, dağıtım ve depolama genelinde — yıllık 5–8 milyar dolar mertebesinde. Uluslararası geliştiriciler, EPC yüklenicileri, OEM'ler (trafolar, anahtarlama ekipmanı, BESS, akıllı sayaçlar) ve kreditörler için bu, önümüzdeki on yıl boyunca bölgedeki en büyük tek şebeke modernizasyon programlarından biri.
6. Uluslararası katılımcılar için anlamı
Segment bazında etkiler farklı, ama merkezi mesaj tutarlı: tek başına kapasite inşası yatırım fırsatını emmeyecek. Altı bitişik alan öne çıkıyor:
Utility ölçekli güneş ve rüzgar geliştiricileri: 81,4 GW yeni güneş+rüzgar kapasitesi gerek (45 GW güneş, 36,4 GW rüzgar) — rekabetçi ihaleler ve YEKA tarzı çerçeveler bunun büyük bölümünü kanalize edecek
BESS sistem entegratörleri: 7,5 GW batarya depolama hem şebeke hizmetleri hem proje eşleşmiş ekonomiyle
İletim ve dağıtım OEM'leri: 104 GW yeni üretimi bağlamak için trafolar, anahtarlama ekipmanı, YG kablolar
Akıllı sayaç ve AMI tedarikçileri: dağıtım geneli AMI yaygınlaşması prosumer piyasaları destekleyerek
Hidrojen teknoloji sağlayıcıları: 5 GW elektrolizör pipeline'ı, uçtan uca sanayi offtake
Çok taraflı ve ticari kreditörler: EBRD, IFC, ADB, EIB ve DFI'lar hepsinin üzerinde katılım
Sonuç. Türkiye elektrik sektörü 22 yılda 3,9× büyüdü. Önümüzdeki on yıl 104 GW daha kapasite ekleyecek ve temelden farklı bir şebeke gerektirecek — değişken yenilenebilirler, dağıtık üretim, depolama ve dijital dispeç için tasarlanmış. Kapasite sorusu artık iyi anlaşılmış durumda; şebeke sorusu sonraki on yılın yatırım hikayesi. Eurasia'yı izleyen uluslararası geliştiriciler, kreditörler ve operatörler için 2026–2035 penceresi bölgedeki en derin tek ülke fırsatlarından biri.
Kaynak: T.C. Enerji ve Tabii Kaynaklar Bakanlığı (ETKB) — Nisan 2026 Kurulu Güç Bülteni ve Ulusal Enerji Planı 2020–2035; TEİAŞ Ekim 2025 rakamları; IEA Electricity 2026; Eurostat 2025; EPDK Aylık Sektör Raporları.
WEEKLY INSIGHT #3 · M&A · PPP3 June 2026 · 9 min read · Pakistan
Pakistan's Discos Privatization Restart — Five Networks on the Block, K-Electric's Two-Decade Lesson
After nearly two decades since K-Electric became Pakistan's only privatized distribution company, the government is restarting the DISCO privatization programme. Five networks are being identified for the first wave — out of 12 distribution territories serving 251 million consumers across a $371 billion economy. The asymmetric performance map — T&D losses spanning 8.9 percent to 38.1 percent, recovery rates 36.6 percent to 105.6 percent — tells the market which utilities are ready and which are not.
The thesis
For nearly two decades Pakistan's electricity distribution stayed mostly state-owned — ten DISCOs operating under the Pakistan Electric Power Company (PEPCO) umbrella, plus the privately held K-Electric in Karachi. The new privatization wave is driven by three structural pressures converging at once: the IMF programme demanding structural reform; circular debt at record levels straining sovereign finances; and the institutional learning accumulated since the 2005 K-Electric transaction.
The reform sequencing playbook is now visible. Rather than attempting to privatize the most troubled networks first — which would attract few bidders and risk political backlash — the new wave starts with the operationally-mature DISCOs, demonstrates value, and uses that momentum to address harder cases later. The performance asymmetry across the 12 distribution territories is the central data point.
1. The country setup
Before reading the privatization map, the country fundamentals matter. Pakistan is a 251-million-person economy with one of the lowest per-capita electricity figures in the broader region. Demand growth is structurally embedded; the question is who delivers it and at what price.
Indicator
Value
Land area
881,913 km²
Population
251.3 million
Urbanisation
~38%
GDP
$371.6 billion
GDP per capita
$1,478
Inflation
12.6%
Unemployment
5.4%
Installed power capacity
46.6 GW
Annual electricity generation
127.5 TWh
Per-capita electricity consumption
~470–500 kWh
Sovereign credit rating (S&P / Fitch / Moody's)
B- / B- / Caa2
The per-capita electricity figure — roughly half of regional comparators — is significant. It signals that the underlying demand curve in Pakistan still has room to grow as urbanisation, industrial activity and air-conditioning loads expand. For a buyer of distribution assets, this is a tailwind: revenue base growth is structurally underwritten by demographics and urbanisation, not by tariff hikes alone.
2. K-Electric — the 20-year experiment
Pakistan's privatization narrative starts in Karachi. The Karachi Electric Supply Company (KESC) was privatized in 2005 to a Saudi-led consortium. Ownership shifted in 2008–2009 when the Abraaj Group acquired control, professionalising operations and pursuing a substantive turnaround through the early 2010s. In 2018 Shanghai Electric attempted to acquire K-Electric for approximately $1.77 billion, but the transaction stalled in a multi-year regulatory deadlock that has yet to fully resolve.
Today K-Electric serves the Karachi metropolitan area — about 3.7 million customers, with T&D losses of 16.0 percent and a recovery rate of 91.5 percent. By the standards of Pakistan's distribution sector, these are solid numbers, well inside the operational envelope of the troubled state DISCOs and broadly comparable to mid-tier regional peers.
Three lessons from the K-Electric experience are now central to how the new programme is being structured:
Tariff predictability matters more than ownership structure. Regulatory continuity through political cycles, not the identity of the shareholder, determined what could be delivered.
FX and sovereign risk must be addressed in the deal architecture. PKR depreciation and Caa2-band credit conditions reshape the economics of capex programmes and dividend repatriation; ignoring them is what stalled successor transactions.
The political-regulatory interface is the binding constraint. K-Electric demonstrated that even a well-capitalised, professionally-managed operator cannot outperform the regulatory framework it operates within. New transaction structures will need to lock in regulatory commitments differently.
K-Electric remains, for now, Pakistan's only meaningfully successful DISCO privatization. The next wave begins with that precedent as institutional memory — including what worked, what didn't, and what would need to be redesigned for any new transaction to deliver value.
3. The performance map — twelve territories, four reform priority tiers
The full performance picture is essential context for the privatization sequencing. The 12 distribution service territories serve very different customer bases, with operating performance ranging from world-class to deeply troubled. Reform priority categorisation reflects this asymmetry directly.
DISCO
Customers (M)
T&D Loss
Recovery
Receivables (PKR bn)
Reform Priority
IESCO
3.95
8.9%
97.0%
89.45
● Green
LESCO
6.5
15.9%
96.1%
224.65
● Yellow
GEPCO
4.79
11.5%
96.2%
N/A
● Green
FESCO
5.4
9.9%
99.6%
N/A
● Green
MEPCO
8.5
15.3%
97.2%
128.87
● Yellow
PESCO
4.41
38.1%
91.9%
246.10
● Red
HESCO
1.5
27.6%
76.5%
−22
● Orange
SEPCO
1.2
34.9%
66.6%
−30
● Red
QESCO
0.7
29.8%
36.6%
235+
● Red
TESCO
0.45
9.0%
105.6%
Low
● Yellow
HAZECO
N/A
N/A
N/A
N/A
—
K-Electric
3.7
16.0%
91.5%
N/A
● Yellow
Four observations stand out. First, the spread is enormous: technical and commercial losses range from 8.9 percent (IESCO) to 38.1 percent (PESCO), with recovery rates spanning 36.6 percent (QESCO) to 105.6 percent (TESCO). This is not a sector with uniform problems; it is a sector with extreme territorial heterogeneity. Second, customer scale does not predict performance — LESCO (6.5M customers) outperforms PESCO (4.4M); MEPCO (8.5M) handles its scale well. Third, the Green-tier DISCOs cluster around the northern industrial-urban corridor (Islamabad, Gujranwala, Faisalabad), where service density, customer mix and institutional history favour operations. Fourth, receivables exposure is concentrated in a small number of territories — PESCO PKR 246 billion, QESCO PKR 235+ billion — which by themselves represent a material share of the system-wide circular debt problem.
4. What the first wave looks like
Five DISCOs have been identified for the first wave. Without naming individual transactions, the sequencing logic is clear from the performance map: international best practice for distribution privatization starts with operationally-mature targets, builds market confidence through successful early transactions, and uses that momentum to address harder cases in subsequent waves.
The likely composition of the first wave reflects the Green-tier DISCOs at its core — territories where T&D losses are already under 12 percent and recovery rates above 96 percent. These are the cases where a new operator can credibly deliver further efficiency gains rather than facing a turnaround mandate from zero. A subset of Yellow-tier candidates — those with manageable receivables and recovery already at solid levels — completes the wave.
This approach has two strategic benefits. The transactions themselves attract a wider pool of bidders, generating more competitive auctions and better proceeds for the state. And the operational continuity in well-functioning service areas reduces political risk during the transition. Critical-priority territories (PESCO, SEPCO, QESCO) are deferred to later waves where the institutional structures, regulatory tools, and possibly different transaction models (concession, performance-based contracts, public-private partnerships) can be deployed for restructuring.
5. What bidders will look at
For international developers, lenders and operators evaluating the wave, five diligence axes are decisive — without speculating on individual identities or bid economics:
Receivables exposure. The IESCO PKR 89 billion outstanding is a different proposition from PESCO PKR 246 billion. Transaction structures will likely separate legacy receivables from going-concern operations.
T&D loss trajectory. Technical losses (transformer efficiency, line losses) are easier to address with capex programmes than commercial losses (theft, billing leakage), which require enforcement and digitisation.
Recovery rate variability. A 96 percent recovery base is a different working-capital profile than 91 percent — the difference compounds rapidly across multi-billion-rupee revenue lines.
NEPRA tariff predictability. The regulator's track record on revenue-cap mechanisms, fuel cost pass-through and indexation will be central to financial modelling for new owners.
FX and sovereign risk. Operating under Caa2 sovereign credit and continued PKR volatility, the deal architecture will need explicit FX risk-sharing or contractual protections. This is the lesson from the Shanghai Electric–K-Electric stalemate.
6. Outlook
Three forces will shape the window over the next 12–24 months. IMF programme conditionality sets the timeline floor: structural reform commitments under the current programme require demonstrable transactions within a fixed period. Regional comparators set the benchmark: Uzbekistan's DSO programme, Kazakhstan's earlier privatizations and Türkiye's distribution sector unbundling all provide reference points for international observers and for the Pakistani regulatory side. Domestic political continuity remains the residual risk: privatization commitments must survive electoral cycles, and the transaction architecture will likely include mechanisms to insulate operating contracts from political turbulence.
The transaction window for the first wave points to 2026–2027 closings, with diligence and competitive selection processes running through the intervening period.
The bottom line. After 20 years, Pakistan is putting five DISCOs on the block. The K-Electric story — a mixed but instructive precedent — is the institutional memory. The asymmetric performance map across the 12 networks signals where the operational wins live and where future waves will need different solutions. For international developers, lenders and operators, this is one of the largest distribution privatization programmes in the region — and a real test of whether reform sequencing can be delivered.
Sources: Pakistan Economic Survey 2024–25; World Bank Country Profile 2024–25; NEPRA Annual Report FY2024. Performance figures presented as in source reports.
Pakistan'ın Disco Özelleştirme Yeniden Başlangıcı — Beş Şebeke Tahtada, K-Electric'in 20 Yıllık Dersi
K-Electric'in Pakistan'ın tek özelleştirilmiş dağıtım şirketi olmasından bu yana yaklaşık 20 yıl sonra, hükümet DSO özelleştirme programını yeniden başlatıyor. 12 dağıtım bölgesi arasından beş şebeke ilk dalga için belirleniyor — 251 milyon tüketici, $371 milyar GSYİH'lık bir ekonomide. Performans asimetrisi — T&D kayıpları %8,9 ile %38,1 arası, recovery oranları %36,6 ile %105,6 arası — hangi utility'lerin hazır, hangilerinin değil olduğunu piyasaya gösteriyor.
Ana tez
Pakistan'ın elektrik dağıtımı yaklaşık 20 yıl boyunca büyük ölçüde devlet mülkiyetinde kaldı — Pakistan Electric Power Company (PEPCO) çatısı altında on DSO ve Karaçi'deki özel K-Electric. Yeni özelleştirme dalgasını üç yapısal baskı aynı anda sürüklüyor: yapısal reform talep eden IMF programı, sovereign mali yapıyı zorlayan rekor seviyelerde dairesel borç ve 2005 K-Electric işleminden bu yana biriken kurumsal öğrenme.
Reform sıralama mantığı artık görünür durumda. En sorunlu şebekeleri önce özelleştirmeye çalışmak yerine — ki bu az teklif çekecek ve politik tepkiyi riske atacaktı — yeni dalga operasyonel olarak olgun DSO'larla başlıyor, değer gösteriyor ve bu momentumu sonraki dalgalarda daha zor vakaları ele almak için kullanıyor. 12 dağıtım bölgesindeki performans asimetrisi merkezi veri noktası.
1. Ülke yapısı
Özelleştirme haritasını okumadan önce, ülke temelleri önemli. Pakistan 251 milyon kişilik bir ekonomi ve geniş bölgenin en düşük kişi başı elektrik tüketim rakamlarından birine sahip. Talep büyümesi yapısal olarak gömülü; soru kim teslim ediyor ve hangi fiyatla.
Gösterge
Değer
Yüzölçümü
881.913 km²
Nüfus
251,3 milyon
Kentleşme
~%38
GSYİH
$371,6 milyar
Kişi başı GSYİH
$1.478
Enflasyon
%12,6
İşsizlik
%5,4
Kurulu güç
46,6 GW
Yıllık elektrik üretimi
127,5 TWh
Kişi başı elektrik tüketimi
~470–500 kWh
Kredi notu (S&P / Fitch / Moody's)
B- / B- / Caa2
Kişi başı elektrik rakamı — bölgesel karşılaştırmacıların yaklaşık yarısı — önemli. Pakistan'da temel talep eğrisinin kentleşme, sanayi faaliyeti ve klima yükleri genişledikçe büyümeye hâlâ alan olduğunu sinyalliyor. Dağıtım varlığı alıcısı için bu bir kuyruk rüzgârı: gelir tabanı büyümesi sadece tarife artışlarıyla değil, demografik ve kentleşme dinamikleriyle yapısal olarak garantili.
2. K-Electric — 20 yıllık deney
Pakistan'ın özelleştirme anlatısı Karaçi'de başlıyor. Karachi Electric Supply Company (KESC) 2005'te Suudi öncülüğünde bir konsorsiyuma özelleştirildi. 2008–2009'da Abraaj Grubu kontrolü ele aldı, operasyonları profesyonelleştirdi ve 2010'ların başlarında esaslı bir dönüş izledi. 2018'de Şanghay Electric K-Electric'i yaklaşık 1,77 milyar dolarlık bir işlemle satın almaya çalıştı, ancak işlem henüz tam olarak çözülmemiş çok yıllı bir regülatif çıkmazda takıldı.
Bugün K-Electric Karaçi metropolitan alanına hizmet veriyor — yaklaşık 3,7 milyon müşteri, %16 T&D kaybı ve %91,5 recovery oranı ile. Pakistan dağıtım sektörü standartlarında bu rakamlar sağlam, sorunlu devlet DSO'larının operasyonel zarfının çok içinde ve geniş ölçüde orta segment bölgesel emsallerle karşılaştırılabilir.
K-Electric deneyiminden üç ders yeni programın nasıl yapılandırıldığının merkezinde:
Tarife öngörülebilirliği mülkiyet yapısından önemli. Politik döngüler boyunca regülatif süreklilik, hissedarın kimliği değil, neyin teslim edilebileceğini belirledi.
FX ve sovereign risk anlaşma mimarisinde adreslenmeli. PKR'nin değer kaybı ve Caa2 bandı kredi koşulları capex programlarının ve temettü transferinin ekonomisini yeniden şekillendiriyor; bunları görmezden gelmek halef işlemleri durdurdu.
Politik-regülatif arayüz bağlayıcı kısıt. K-Electric, iyi sermayelendirilmiş, profesyonelce yönetilen bir operatörün bile içinde faaliyet gösterdiği regülatif çerçeveyi aşamayacağını gösterdi. Yeni işlem yapıları regülatif taahhütleri farklı şekilde kilitlemek zorunda kalacak.
K-Electric şimdilik Pakistan'ın anlamlı şekilde başarılı tek DSO özelleştirmesi olmaya devam ediyor. Sıradaki dalga, bu emsali kurumsal hafıza olarak alarak başlıyor — neyin işe yaradığı, neyin yaramadığı ve herhangi bir yeni işlemin değer teslim etmesi için neyin yeniden tasarlanması gerektiği dahil.
3. Performans haritası — on iki bölge, dört reform öncelik kademesi
Tam performans tablosu özelleştirme sıralaması için temel bağlam. 12 dağıtım hizmet bölgesi çok farklı müşteri tabanlarına hizmet ediyor, operasyonel performans dünya standardından derinden sorunlu olana kadar uzanıyor. Reform öncelik kategorileme bu asimetriyi doğrudan yansıtıyor.
DSO
Müşteri (M)
T&D Kaybı
Recovery
Alacaklar (PKR mlr)
Reform Önceliği
IESCO
3,95
%8,9
%97,0
89,45
● Yeşil
LESCO
6,5
%15,9
%96,1
224,65
● Sarı
GEPCO
4,79
%11,5
%96,2
N/A
● Yeşil
FESCO
5,4
%9,9
%99,6
N/A
● Yeşil
MEPCO
8,5
%15,3
%97,2
128,87
● Sarı
PESCO
4,41
%38,1
%91,9
246,10
● Kırmızı
HESCO
1,5
%27,6
%76,5
−22
● Turuncu
SEPCO
1,2
%34,9
%66,6
−30
● Kırmızı
QESCO
0,7
%29,8
%36,6
235+
● Kırmızı
TESCO
0,45
%9,0
%105,6
Düşük
● Sarı
HAZECO
N/A
N/A
N/A
N/A
—
K-Electric
3,7
%16,0
%91,5
N/A
● Sarı
Dört gözlem öne çıkıyor. Birincisi, yelpaze çok büyük: teknik ve ticari kayıplar %8,9 (IESCO) ile %38,1 (PESCO) arası, recovery oranları %36,6 (QESCO) ile %105,6 (TESCO) arası. Bu, üniform sorunları olan bir sektör değil; ekstrem bölgesel heterojenliği olan bir sektör. İkincisi, müşteri ölçeği performansı öngörmüyor — LESCO (6,5M müşteri) PESCO'dan (4,4M) daha iyi performans gösteriyor; MEPCO (8,5M) ölçeğini iyi yönetiyor. Üçüncüsü, Yeşil-kademe DSO'lar kuzey sanayi-kentsel koridoru etrafında kümeleniyor (İslamabad, Gucranvala, Faysalabad), burada hizmet yoğunluğu, müşteri karması ve kurumsal tarih operasyonları destekliyor. Dördüncüsü, alacak maruziyeti az sayıda bölgede yoğunlaşıyor — PESCO 246 milyar PKR, QESCO 235+ milyar PKR — kendi başlarına sistem genelindeki dairesel borç sorununun önemli bir payını temsil ediyorlar.
4. İlk dalga nasıl görünüyor
İlk dalga için beş DSO belirlendi. Spesifik işlemleri adlandırmaksızın, sıralama mantığı performans haritasından açık: dağıtım özelleştirmesi için uluslararası best practice operasyonel olarak olgun hedeflerle başlar, başarılı erken işlemlerle piyasa güveni inşa eder ve bu momentumu sonraki dalgalarda daha zor vakaları ele almak için kullanır.
İlk dalganın muhtemel bileşimi merkezde Yeşil-kademe DSO'ları yansıtıyor — T&D kayıplarının zaten %12 altında ve recovery oranlarının %96 üstünde olduğu bölgeler. Bunlar yeni bir operatörün sıfırdan dönüş mandasıyla yüzleşmek yerine ek verimlilik kazanımlarını güvenilir şekilde teslim edebileceği vakalar. Yönetilebilir alacakları ve zaten sağlam seviyelerde recovery'si olan bir Sarı-kademe alt kümesi dalgayı tamamlıyor.
Bu yaklaşımın iki stratejik faydası var. İşlemlerin kendileri daha geniş bir teklif veren havuzu çekiyor, daha rekabetçi açık artırmalar ve devlet için daha iyi gelir yaratıyor. Ve iyi işleyen hizmet alanlarındaki operasyonel süreklilik geçiş sırasında politik riski azaltıyor. Kritik öncelikli bölgeler (PESCO, SEPCO, QESCO) sonraki dalgalara erteleniyor, burada kurumsal yapılar, regülatif araçlar ve muhtemelen farklı işlem modelleri (konsesyon, performansa dayalı sözleşmeler, kamu-özel ortaklıklar) yeniden yapılanma için devreye alınabilir.
5. Alıcıların bakacakları
Dalgayı değerlendiren uluslararası geliştiriciler, kreditörler ve operatörler için beş diligence ekseni belirleyici — spesifik kimlikler veya teklif ekonomisi üzerine spekülasyon yapmadan:
Alacak maruziyeti. IESCO 89 milyar PKR vadeli, PESCO 246 milyar PKR vadeliden farklı bir önerme. İşlem yapıları muhtemelen eski alacakları faaliyetteki operasyonlardan ayıracak.
T&D kayıp eğrisi. Teknik kayıplar (trafo verimliliği, hat kayıpları) capex programlarıyla ticari kayıplardan (hırsızlık, faturalama sızıntısı) daha kolay ele alınır, ki bunlar uygulama ve dijitalleşme gerektiriyor.
Recovery oranı değişkenliği. %96 recovery tabanı %91'den farklı bir işletme sermayesi profili — fark çok milyarlık PKR gelir kalemleri boyunca hızla birikiyor.
NEPRA tarife öngörülebilirliği. Regülatörün gelir tavanı mekanizmaları, yakıt maliyeti geçirme ve endeksleme konusundaki sicilini, yeni sahipler için finansal modellemenin merkezi olacak.
FX ve sovereign risk. Caa2 sovereign kredi ve devam eden PKR oynaklığı altında çalışırken, anlaşma mimarisi açık FX risk paylaşımı veya sözleşmesel korumalar gerektirecek. Bu, Şanghay Electric–K-Electric çıkmazından alınan ders.
6. Önümüzdeki dönem
Önümüzdeki 12–24 ayda pencereyi üç güç şekillendirecek. IMF programı koşulluluğu takvim tabanını belirliyor: mevcut program kapsamındaki yapısal reform taahhütleri sabit bir süre içinde gösterilebilir işlemler gerektiriyor. Bölgesel karşılaştırmacılar referans noktasını belirliyor: Özbekistan'ın DSO programı, Kazakistan'ın önceki özelleştirmeleri ve Türkiye'nin dağıtım sektörü ayrıştırması, uluslararası gözlemciler ve Pakistan regülatif tarafı için referans noktaları sağlıyor. İç politik süreklilik kalıntı risk olarak kalıyor: özelleştirme taahhütlerinin seçim döngülerinden sağ çıkması gerekiyor ve işlem mimarisi muhtemelen işletme sözleşmelerini politik türbülanstan izole edecek mekanizmalar içerecek.
İlk dalga için işlem penceresi 2026–2027 kapanışlarına işaret ediyor, ara dönemde diligence ve rekabetçi seçim süreçleri yürüyor.
Sonuç. 20 yıl sonra Pakistan beş DSO'yu tahtaya koyuyor. K-Electric hikayesi — karışık ama öğretici bir emsal — kurumsal hafıza. 12 şebekedeki asimetrik performans haritası operasyonel kazanımların nerede yaşadığını ve gelecek dalgaların farklı çözümlere ihtiyaç duyacağı yerleri sinyalliyor. Uluslararası geliştiriciler, kreditörler ve operatörler için bu bölgedeki en büyük dağıtım özelleştirme programlarından biri — ve reform sıralamasının gerçekten teslim edilip edilemeyeceğinin gerçek bir testi.
Kaynak: Pakistan Economic Survey 2024–25; World Bank Country Profile 2024–25; NEPRA Annual Report FY2024. Performans rakamları kaynak raporlardaki gibi sunulmuştur.
WEEKLY INSIGHT #2 · SECTOR OUTLOOK2 June 2026 · 8 min read · Uzbekistan
Uzbekistan's Energy Market 2026 — From Capacity Expansion to System Transformation
Uzbekistan's power sector is entering a new phase: not just adding megawatts, but building a flexible, reliable and increasingly low-carbon system. Generation has grown roughly 47 percent since 2016, renewables have multiplied 20-fold in three years, and storage capacity quadrupled in 2025 alone. The next value wave will come from projects that strengthen the entire system — transmission, distribution, storage, digital dispatch, regional trade — not from standalone capacity additions.
The thesis
Over the past nine years Uzbekistan has done the easy work — adding generation to meet a clear shortage. From 2016's ~59 billion kWh to 2025's 86.7 billion kWh, the system has scaled ~47 percent. But the questions ahead are not about megawatts; they are about how a power system carries 23 TWh of variable renewables in 2026, how distribution networks reach data centres and industrial parks, and how regional trade integrates the country with its Central Asian neighbours. International developers, financiers and technology providers will find the highest value not in new turbines but in projects that strengthen the entire system.
Four value pockets emerge:
Industry & households — a reliable system supporting growing industrial, residential and construction demand
Data centres — flexible capacity feeding the digital economy and data-centre infrastructure
Regional trade — Central Asia's most important structural shift: regional electricity trade integration
Grid modernisation — the critical bottleneck and the largest opportunity: transmission, distribution, storage and smart infrastructure
1. From scarcity management to modernisation
Electricity generation has expanded roughly 47 percent in nine years, driven by household, industrial, construction, services and digital-economy demand. 2024–2025 was the inflection point in new capacity:
From around 59 TWh in 2016 the system rose to 81.5 TWh in 2024 and 86.7 TWh in 2025. The 2025 step — 4.6 GW added in a single year, more than the entire 2024 build — signals that the cycle is no longer about capacity scarcity. It is about which kind of capacity, where, and how it integrates with the grid.
2. Renewables become a structural component
Solar and wind generation has multiplied more than twenty-fold in three years: from 434 million kWh in 2022 to 10.5 billion kWh in 2025. The system moved from pilot scale to system scale in just three years.
Year
Solar + wind generation
Phase
2022
434 million kWh
Pilot projects
2023
576.9 million kWh
First large plants come online
2024
4.86 billion kWh
Step to system scale
2025
10.5+ billion kWh
Structural system component
Total green generation including hydro reached 16.8 TWh in 2025, up roughly 29 percent on 2024. The 2026 target of 23 TWh implies green output making up roughly one-third of total system generation — a meaningful pivot for the load curve, the storage business case, and grid balancing requirements.
3. Gas savings and emissions — the central economic argument
The energy transition narrative is not just environmental policy in Uzbekistan; it is energy security and macroeconomics. Every cubic metre of gas saved by renewable generation strengthens domestic supply resilience, can be redirected to higher-value industrial use, or generates fiscal and export value.
Indicator
2024
2025
2026 target
Gas savings
1.47 bn m³
3.2 bn m³
~7.0 bn m³
Avoided emissions
2.04 Mt CO₂
4.7 Mt CO₂
~11 Mt CO₂
Renewable projects are no longer aligned with climate policy alone; they are aligned with the country's economic strategy. The 2026 trajectory implies roughly 4.8× the 2024 gas-saving rate over two years — a major signal for both the upstream gas budget and the renewable IPP pipeline.
4. Grid modernisation — the decisive bottleneck and the largest opportunity
Generation alone does not secure the transition. The system must be able to transmit, distribute and balance. The World Bank notes that T&D losses remain high and a meaningful share of infrastructure has aged past its useful life.
In 2024 alone:
~29,500 km of distribution network was rehabilitated
10,200+ transformer points were modernised
~2,900 km of new line was built and 649 new transformer points added
The grid modernisation theme — physical assets plus digitalisation, private participation in distribution, system flexibility — is now the dominant investment narrative for the next years. For developers and lenders, the opportunity is not just connecting new generation; it is rebuilding the system that carries it.
5. Storage — the new pillar of the market
As solar and wind penetration rises, battery energy storage (BESS) becomes mandatory, not optional. The next phase is no longer about generation alone — it requires dispatchable flexibility.
Year
Storage commissioned
Detail
2024
300 MW
2 systems — Fergana + Andijan
2025
1,245 MW
10 systems — more than 4× growth in one year
The strategic implication is broader than batteries: HV networks and substations, smart dispatch and demand response, and efficient gas peakers all play roles in the next phase of system flexibility. Each represents a distinct investment vertical for international developers and finance partners.
Performance dashboard 2024–2026
Indicator
2024
2025
2026 outlook
Total electricity generation
81.5 TWh
86.7 TWh
90 TWh
Solar + wind
4.86 TWh
10.6 TWh
12 TWh
Green generation (incl. hydro)
~13.0 TWh
16.8 TWh
23.0 TWh
Gas savings
1.47 bn m³
3.2 bn m³
~7 bn m³
Avoided emissions
2.04 Mt
4.7 Mt
~11 Mt
Storage commissioned (cumulative)
300 MW
1,245 MW
1,400 MW
Note: there is a small source discrepancy in 2024 green generation; values are reported as in the original.
What this means for international participants
The Uzbek power market is expanding and growing more complex. The opportunity now reaches beyond utility-scale generation. For international developers, financiers and technology providers, the central message is straightforward: standalone capacity additions are not where the next value wave lives — system-strengthening projects are.
Six adjacent fields emerge as the highest-value access points: transmission and distribution modernisation (grid renewal and loss reduction), storage systems (BESS expansion), energy efficiency (industrial and building), distributed solar and smart metering (prosumer economy), industrial decarbonisation and carbon markets, and regional electricity trade (Central Asia integration).
The bottom line. The capacity era is closing. The system-transformation era is opening. Generation growth of 47 percent over nine years, renewable expansion of 20× in three years, and storage scaling 4× in one year together signal a market that has solved the volume question and is now turning to the structural one. For sector watchers and capital allocators, value now flows to grid modernisation, dispatchable flexibility and regional trade integration — not to new megawatts.
Sources: Uzbekistan Energy Ministry; World Bank · Editorial briefing 1 June 2026.
Özbekistan Enerji Piyasası 2026 — Kapasite Genişlemesinden Sistem Dönüşümüne
Özbekistan elektrik sektörü yeni bir aşamaya girdi: artık sadece megavat ekleme değil, esnek, güvenilir ve giderek düşük-karbonlu bir güç sistemi kurma sorusu öne çıkıyor. Üretim 2016'dan bu yana yaklaşık %47 büyüdü, yenilenebilir 3 yılda 20 kat çıktı, depolama 2025'te dört kattan fazla genişledi. Bir sonraki değer dalgası tek başına üretim eklemekten değil, tüm sistemi güçlendiren projelerden — iletim, dağıtım, depolama, dijital dispeç, bölgesel ticaret — doğacak.
Ana tez
Son dokuz yıl boyunca Özbekistan kolay işi yaptı — net bir kapasite açığına karşı üretim ekledi. 2016'daki ~59 milyar kWh'tan 2025'te 86,7 milyar kWh'a sistem yaklaşık %47 ölçeklendi. Ama önümüzdeki sorular megavat sorusu değil; elektrik sisteminin 2026'da 23 TWh değişken yenilenebilir taşıması, dağıtım ağlarının veri merkezleri ve sanayi parklarına ulaşması ve Orta Asya komşularıyla bölgesel ticaret entegrasyonu. Uluslararası geliştiriciler, finansörler ve teknoloji sağlayıcıları için en yüksek değer yeni türbinlerde değil, tüm sistemi güçlendiren projelerde olacak.
Dört değer cebi öne çıkıyor:
Sanayi ve haneler — büyüyen sanayi, konut ve inşaat sektörünü destekleyen güvenilir bir güç sistemi
Veri merkezleri — dijital ekonomi ve veri merkezi altyapısını besleyen esnek kapasite
Bölgesel ticaret — Orta Asya'nın en önemli yapısal geçişlerinden biri: bölgesel elektrik ticareti entegrasyonu
Şebeke modernizasyonu — kritik darboğaz ve en büyük fırsat: iletim, dağıtım, depolama ve akıllı altyapı
1. Kıtlık yönetiminden modernizasyona geçen piyasa
2016'dan bu yana elektrik üretiminde yaklaşık %47 artış kaydedildi; sürücüler hane, sanayi, inşaat, hizmetler ve dijital ekonomi talebi. 2024–2025 yeni kapasite eklemesi dönüm noktası oldu:
42 proje (güneş, rüzgâr, depolama, termik, kojenerasyon)
Üretim 2016'daki yaklaşık 59 TWh'tan 2024'te 81,5 TWh ve 2025'te 86,7 TWh'a yükseldi. 2025'in adımı — bir yılda 4,6 GW eklendi, 2024 tamamından fazla — döngünün artık kapasite kıtlığı değil hangi tür kapasite, nerede ve şebekeyle nasıl entegre sorusu olduğunu sinyaller.
2. Yenilenebilirler sistemin yapısal parçası oldu
Güneş ve rüzgâr üretimi üç yılda 20 kattan fazla büyüdü: 2022'de 434 milyon kWh'tan 2025'te 10,5 milyar kWh'a. Sistem 3 yılda gösteri ölçeğinden sistem ölçeğine geçti.
Yıl
Güneş + rüzgâr üretimi
Aşama
2022
434 milyon kWh
Pilot projeler dönemi
2023
576,9 milyon kWh
İlk büyük tesisler devreye giriyor
2024
4,86 milyar kWh
Sistem ölçeğine sıçrama
2025
10,5+ milyar kWh
Yapısal sistem bileşeni
Toplam yeşil üretim (hidro dahil) 2025'te 16,8 TWh'a ulaştı — bir önceki yıla göre yaklaşık %29 artış. 2026 hedefi olan 23 TWh, yeşil üretimin toplam sistem üretiminde yaklaşık üçte bir paya ulaşması anlamına geliyor — yük eğrisi, depolama iş modeli ve şebeke dengeleme gereksinimleri için anlamlı bir geçiş.
3. Gaz tasarrufu ve emisyon — merkezi ekonomik argüman
Özbekistan'da enerji geçişi sadece çevre politikası değil — enerji güvenliği ve makroekonomi. Yenilenebilir üretimle tasarruf edilen her m³ gaz, iç tedarik dayanıklılığını güçlendirir, yüksek-değerli sanayi kullanımına yönlendirilebilir veya mali ve ihracat değeri yaratır.
Gösterge
2024
2025
2026 hedef
Gaz tasarrufu
1,47 mrd m³
3,2 mrd m³
~7,0 mrd m³
Önlenen emisyon
2,04 Mt CO₂
4,7 Mt CO₂
~11 Mt CO₂
Yenilenebilir projeler artık yalnız iklim ajandasıyla değil, ülkenin ekonomik stratejisiyle de hizalı. 2026 yörüngesi iki yılda 2024 gaz tasarruf oranının yaklaşık 4,8 katını işaret ediyor — hem upstream gaz bütçesi hem de yenilenebilir IPP pipeline'ı için büyük bir sinyal.
4. Şebeke modernizasyonu — belirleyici darboğaz ve en büyük fırsat
Üretim tek başına geçişi güvenceye almaz; sistem iletip, dağıtıp, dengeleyebilmeli. Dünya Bankası: iletim ve dağıtım (T&D) kayıpları yüksek; altyapının önemli bir kısmı faydalı ömrünü aşmış durumda.
2024'te:
~29.500 km dağıtım şebekesi elden geçirildi
10.200+ trafo noktası modernize edildi
~2.900 km yeni enerji hattı inşa edildi ve 649 yeni trafo noktası eklendi
Şebeke modernizasyonu teması — fiziksel varlıklar + dijitalleşme + dağıtımda özel sektör katılımı + sistem esnekliği — önümüzdeki yılların baskın yatırım anlatısı. Geliştiriciler ve kreditörler için fırsat sadece yeni üretimi bağlamakta değil; üretimi taşıyan sistemi yeniden inşa etmekte.
5. Depolama — piyasanın yeni direği
Güneş ve rüzgâr penetrasyonu arttıkça batarya depolama (BESS) zorunlu hale geliyor — opsiyonel değil. Bir sonraki aşama yalnız üretim değil, dağıtılabilir esneklik gerektiriyor.
Yıl
Devreye alınan depolama
Detay
2024
300 MW
2 sistem — Fergana + Andican
2025
1.245 MW
10 sistem — bir yılda 4 kattan fazla büyüme
Stratejik anlam bataryalardan geniş: YG şebekeler ve trafo merkezleri, akıllı dispeç ve talep yanıtı ile verimli gaz peaker'lar — hepsi sistem esnekliğinin sonraki aşamasında rol oynayacak. Her biri uluslararası geliştiriciler ve finans ortakları için ayrı bir yatırım dikeyi.
Performans tablosu 2024–2026
Gösterge
2024
2025
2026 görünüm
Toplam elektrik üretimi
81,5 TWh
86,7 TWh
90 TWh
Güneş + rüzgâr
4,86 TWh
10,6 TWh
12 TWh
Yeşil üretim (hidro dahil)
~13,0 TWh
16,8 TWh
23,0 TWh
Gaz tasarrufu
1,47 mrd m³
3,2 mrd m³
~7 mrd m³
Önlenen emisyon
2,04 Mt
4,7 Mt
~11 Mt
Devreye alınan depolama (kümülatif)
300 MW
1.245 MW
1.400 MW
Not: 2024 yeşil üretim için kaynakta küçük bir tutarsızlık mevcuttur; değerler kaynağa sadık aktarılmıştır.
Uluslararası katılımcılar için anlamı
Özbek enerji piyasası genişliyor ve karmaşıklaşıyor. Fırsat artık utility-ölçekli üretimin ötesine taşıyor. Uluslararası geliştiriciler, finansörler ve teknoloji sağlayıcıları için merkezi mesaj net: bağımsız kapasite eklemek değil, tüm sistemi güçlendiren projeler değer yaratacak.
Altı bitişik alan en yüksek değerli erişim noktaları olarak öne çıkıyor: iletim ve dağıtım modernizasyonu (şebeke yenileme + kayıp azaltma), depolama sistemleri (BESS genişlemesi), enerji verimliliği (sanayi ve bina), dağıtık güneş ve akıllı sayaç (prosumer ekonomi), sanayi dekarbonizasyonu ve karbon piyasaları, ve bölgesel elektrik ticareti (Orta Asya entegrasyonu).
Sonuç. Kapasite çağı kapanıyor. Sistem dönüşümü çağı açılıyor. 9 yılda %47 üretim büyümesi, 3 yılda 20× yenilenebilir genişleme ve bir yılda 4× depolama ölçeklemesi — hep birlikte hacim sorusunu çözmüş ve şimdi yapısal soruna dönmekte olan bir piyasayı işaretliyor. Sektör izleyicileri ve sermaye tahsiscileri için değer artık şebeke modernizasyonu, dağıtılabilir esneklik ve bölgesel ticaret entegrasyonuna akıyor — yeni megavatlara değil.
Kaynak: Özbekistan Enerji Bakanlığı; Dünya Bankası · Editöryel brifing 1 Haziran 2026.
WEEKLY INSIGHT #1 · TARIFF & REGULATION31 May 2026 · 8 min read · Uzbekistan
Uzbekistan's June 2026 Tariff Reset — Subsidies Down 65%, Industry Up 10%
Cabinet of Ministers Decision No. 243, signed 15 May 2026 and effective 1 June, completes the third leg of the three-year retail tariff normalisation. Residential and industrial rates rise 8–12 percent, gas climbs 10–11 percent, and the annual residential subsidy bill falls from $674M to $236M — a 65 percent compression since 2023.
For sector watchers, the decision matters less for the percentage changes than for what they confirm: Uzbekistan is on schedule to exit blanket residential subsidies by the end of the decade, the cross-subsidy structure between industrial and household consumers has been retained, and the active-energy unit price — the building block that flows into distribution-company revenue caps — is now anchored at $45.4/MWh on a long-term descent toward $32.5/MWh by 2055.
What changed on 1 June
Residential — tiered structure preserved
Tier (consumption)
Share of households
Old (UZS/kWh)
New (UZS/kWh)
Change
0 – 200 kWh
78%
600
650
+8.3%
201 – 500 kWh
15%
800
900
+12.5%
501 – 1,000 kWh
5%
1,000
1,100
+10.0%
1,001 – 5,000 kWh
1.8%
1,500
1,500
unchanged
5,001 – 10,000 kWh
0.2%
1,750
1,750
unchanged
> 10,000 kWh
<0.1%
2,000
2,000
unchanged
At the FX rate of 12,200 UZS/USD, the entry tier moves from $49.2 to $53.3/MWh, the second tier from $65.6 to $73.8/MWh. The top three tiers are frozen — a signal that the government considers the upper bracket already at full cost-recovery level. Since 2023, residential rates have risen between 120 percent (entry tier) and 578 percent (top tier).
Industrial & commercial — single +10% across the board
Groups I (large industry, >750 kVA + budgetary), II (other legal entities — commercial, SMEs, services), and IV (thermal/heating uses) all move from 1,000 to 1,100 UZS/kWh (≈ $90.2/MWh). The uniform treatment is intentional: by aligning industrial, commercial, and heating customers at one tariff level, the Cabinet retains the cross-subsidy that funds the lowest residential band without distorting between productive sectors.
Natural gas — supply parallel
Customer
Old (UZS/m³)
New (UZS/m³)
Change
General (industry / commercial / other)
1,800
2,000
+11.1%
CNG filling stations
2,500
2,750
+10.0%
Residential (averaged across tiers)
1,000
1,100
+10.0%
Gas rates do not directly affect electricity distribution operations, but feed back through fuel cost: gas-fired generation will still account for roughly 55 percent of the 2026 generation mix (≈85 TWh national output), so the +11 percent industrial gas increase will eventually pass through to active-energy unit pricing in subsequent regulatory periods.
Targeted welfare — up, not flat
Electricity assistance per family per month: 30,000 → 37,500 UZS (+25%)
Gas assistance, winter (Nov–Feb) per family: 200,000 → 225,000 UZS (+12.5%)
Gas assistance, off-season (Mar–Oct) per family: 120,000 → 135,000 UZS (+12.5%)
Why this matters — the subsidy compression story
The numerical story is the residential subsidy bill, not the headline percentages. Over three years:
Year
Generation cost (UZS/kWh)
Residential active-energy tariff
Unit subsidy
National annual subsidy
2023
459
101
+358
$674M
2024
481
316
+165
$324M
2025
525
400
+125
$256M
2026
554
443
+111
$236M
Three observations. First, the cost side is climbing 6–9 percent annually (459 → 554 UZS/kWh, +21% over three years), driven by fuel prices and capacity additions. So the tariff increases are not pure margin transfer — a sizable fraction is absorbed by generation cost catch-up. Second, the subsidy structure remains concentrated on the lowest-volume residential band; only the 0–200 kWh tier consumes electricity below the 554 UZS/kWh production cost, with the state covering the −175 UZS/kWh gap. Every higher tier and every industrial customer pays above cost. Third, the 65 percent subsidy compression from 2023 to 2026 is what regional comparators most look for — Kazakhstan's 2024–2025 cycle and Pakistan's Discos privatisation track follow comparable logic but at slower paces.
The active-energy anchor
The 2026 active-energy unit price — $45.4/MWh — is the long-term anchor for distribution-company economics. Drawn from the published generation mix (2025: 55% gas, 21% coal, 11% hydro, 11% solar, 2% wind), it is the price at which distribution operators (DSOs) purchase loss energy.
Year
Output (TWh)
Renewables share
Active energy ($/MWh)
2026
85
29%
$45.4
2030
108
50%
$41.3
2040
165
66%
$38.6
2055
275
90%
$32.5
By 2055, gas is projected to fall from 55 to 5 percent of generation; coal from 21 to 5 percent; solar from 11 to 45 percent; wind from 2 to 30 percent. The compounded effect is roughly a 28 percent decline in active-energy unit price over three decades — achievable only if the renewables investment pipeline (ACWA Power, Masdar, EBRD-funded projects) delivers on its 2026–2030 build schedule.
Implications
For lenders and investors. The June 1 decision continues to validate Uzbekistan's tariff reform commitments to multilateral lenders. EBRD, ADB, IFC, and World Bank energy-sector lending have all been conditioned on the subsidy taper. With 2026's level at $236M (down from $674M in 2023), the next regulatory milestone — exit from the residential 0–200 kWh subsidy — is no longer a distant promise but a question of timing within the 2028–2030 window.
For industrial customers. The +10 percent move puts large industry at $90.2/MWh — competitive against Central Asian peers but materially above the long-run active-energy floor of $45.4/MWh. The headline cost is paying for two things at once: the active-energy block plus the cross-subsidy contribution that funds the residential 0–200 band.
For distribution operators. Distribution and transmission components remain unchanged in absolute UZS terms. The structural change is on the active-energy side: loss energy purchased at $45.4/MWh becomes the new monthly cash-outflow benchmark. Operators with high technical losses will feel the squeeze first; loss-reduction capex now has a clearer payback case.
For consumers. The lowest tier (78 percent of households) sees a manageable 8.3 percent increase, partly offset by the 25 percent rise in direct support payments. Mid-tier households (201–500 kWh) face the steepest move at 12.5 percent.
Outlook
Three things to watch in the next 6–12 months. Indexation rules for the active-energy price — whether the $45.4/MWh anchor moves with FX, with a basket index, or stays nominal. Subsidy exit pathway for the 0–200 kWh band — the trajectory implies a target somewhere in 2028–2030 for full cost-recovery in the entry tier, but no formal calendar has been published. Industrial group disaggregation — whether Group I eventually separates from Groups II and IV; combining them simplified the 2026 reset but limits the regulator's ability to manage demand response across distinct customer classes.
The bottom line. Uzbekistan's June 2026 tariff reset is less a price change than a continuity signal: the three-year subsidy taper is on schedule, the cross-subsidy architecture is intact, and the active-energy unit price is anchored on a long-term descending curve. For sector watchers, this clarifies the regulatory direction; for operators and investors, it stabilises the model inputs through the next regulatory cycle.
Sources: Cabinet of Ministers Decision No. 243 (15 May 2026, effective 1 June 2026); national generation roadmap 2026–2055. Tariff figures at FX 12,200 UZS/USD.
Özbekistan'ın Haziran 2026 Tarife Sıfırlaması — Sübvansiyon %65 Düştü, Sanayi %10 Zamlandı
Bakanlar Kurulu'nun 15 Mayıs 2026 tarihli 243 sayılı kararı, 1 Haziran 2026 itibarıyla yürürlüğe girerek 2023'te başlayan üç yıllık tarife normalleşmesinin son halkasını tamamlıyor. Mesken ve sanayi elektrik tarifeleri kademe yapısına göre %8 ile %12,5 arasında, doğalgaz tarifeleri %10–11 zamlandı; yıllık konut sübvansiyonu 2023'teki 674 milyon dolar seviyesinden 236 milyon dolara — yani %65 — geriledi.
Sektör için mesajın yüzde değişiminden çok temellendirme: Özbekistan, on yıl sonuna kadar mesken sübvansiyonundan tamamen çıkma takvimine sadık; sanayi ile mesken arasındaki çapraz-sübvansiyon mimarisi korundu; ve dağıtım şirketi gelir tavanının temel bileşeni olan aktif enerji birim fiyatı, 2055'te $32,5/MWh'a inecek uzun vadeli eğride $45,4/MWh seviyesine çıpalandı.
1 Haziran'da neler değişti
Mesken — kademe yapısı korundu
Kademe (tüketim)
Konut payı
Eski (UZS/kWh)
Yeni (UZS/kWh)
Değişim
0 – 200 kWh
%78
600
650
+%8,3
201 – 500 kWh
%15
800
900
+%12,5
501 – 1.000 kWh
%5
1.000
1.100
+%10,0
1.001 – 5.000 kWh
%1,8
1.500
1.500
sabit
5.001 – 10.000 kWh
%0,2
1.750
1.750
sabit
> 10.000 kWh
<%0,1
2.000
2.000
sabit
12.200 UZS/USD kuruyla giriş kademesi $49,2'den $53,3/MWh'a, ikinci kademe $65,6'dan $73,8/MWh'a yükseldi. Üst üç kademe sabit tutuldu — bu segmentlerin 2025'te zaten tam maliyet seviyesine çekildiği sinyali. 2023'ten bu yana mesken tarifeleri giriş kademesinde %120, en üst kademede %578 arttı.
Sanayi ve tüzel — uniform +%10
Grup I (büyük sanayi, >750 kVA + bütçe), Grup II (diğer tüzel kişi — ticari, KOBİ, hizmet) ve Grup IV (ısıtma/sıcak su) — üçü birden 1.000'den 1.100 UZS/kWh'a (≈ $90,2/MWh) çıktı. Tek tarife seviyesinde hizalama bilinçli: mesken 0–200 kademesindeki sübvansiyonu fonlayan çapraz-sübvansiyon yapısı korunuyor, üretken sektörler arasında çarpıtma yaratmadan.
Doğalgaz — paralel ayarlama
Tüketici
Eski (UZS/m³)
Yeni (UZS/m³)
Değişim
Genel (sanayi / ticari / diğer)
1.800
2.000
+%11,1
CNG dolum istasyonları
2.500
2.750
+%10,0
Mesken (kademeler ortalaması)
1.000
1.100
+%10,0
Doğalgaz tarifeleri elektrik dağıtım operasyonunu doğrudan etkilemiyor; ama yakıt maliyeti üzerinden geri besleniyor: doğalgaz çevrim santralleri 2026 üretim karmasının yaklaşık %55'ini oluşturacağı için (≈85 TWh ulusal üretim), sanayi gazındaki +%11 artış sonraki regülasyon dönemlerinde aktif enerji birim fiyatına yansıyacak.
İhtiyaç sahibi aileler için destekler — sabit değil, arttı
Elektrik desteği, aile başına aylık: 30.000 → 37.500 UZS (+%25)
Doğalgaz desteği, kış (Kasım–Şubat), aile başına: 200.000 → 225.000 UZS (+%12,5)
Doğalgaz desteği, diğer aylar (Mart–Ekim), aile başına: 120.000 → 135.000 UZS (+%12,5)
Neden önemli — sübvansiyon kompresyon hikâyesi
Asıl sayısal hikâye konut sübvansiyon faturasında, başlık yüzdelerinde değil. Üç yıllık seyir:
Yıl
Üretim maliyeti (UZS/kWh)
Mesken aktif enerji tarifesi
Birim sübvansiyon
Ulusal yıllık sübvansiyon
2023
459
101
+358
$674M
2024
481
316
+165
$324M
2025
525
400
+125
$256M
2026
554
443
+111
$236M
Üç gözlem. Birincisi, üretim maliyeti tarafı yıllık %6–9 (459 → 554 UZS/kWh, 3 yıl içinde +%21) artıyor; bu yakıt fiyatları ve yeni kapasite eklenmelerinden kaynaklanıyor. Yani tarife artışları saf marj transferi değil; önemli bir kısmı üretim maliyetindeki artışı karşılıyor. İkincisi, sübvansiyon yapısı en düşük hacimli mesken kademesinde yoğunlaşmış olarak kalıyor: yalnız 0–200 kWh kademesi 554 UZS/kWh üretim maliyetinin altında elektrik tüketiyor — devlet −175 UZS/kWh açığı kapatıyor. Üçüncüsü, 2023–2026 arası %65 sübvansiyon kompresyonu, bölgesel benzerlerin en çok izlediği gösterge — Kazakistan'ın 2024–2025 döngüsü ve Pakistan'ın Disco özelleştirme süreci benzer mantığa yaslanıyor ama daha yavaş tempoda.
Aktif enerji çıpası
2026 aktif enerji birim fiyatı — $45,4/MWh — dağıtım şirketi ekonomisi için uzun vadeli çıpa. 2025 üretim karması (%55 gaz, %21 kömür, %11 hidro, %11 güneş, %2 rüzgar) üzerinden hesaplanan bu fiyat, DSO'ların kayıp enerji satın alma fiyatı.
Yıl
Üretim (TWh)
Yenilenebilir payı
Aktif enerji ($/MWh)
2026
85
%29
$45,4
2030
108
%50
$41,3
2040
165
%66
$38,6
2055
275
%90
$32,5
2055'e kadar gazın payı %55'ten %5'e, kömürün %21'den %5'e düşeceği; güneşin %11'den %45'e, rüzgarın %2'den %30'a yükseleceği öngörülüyor. Bileşik etki: aktif enerji birim fiyatı üç on yılda yaklaşık %28 düşüş — yenilenebilir yatırım pipeline'ı (ACWA Power, Masdar, EBRD destekli projeler) 2026–2030 inşa takvimine sadık kalırsa.
Etkiler
Kreditörler ve yatırımcılar. 1 Haziran kararı, Özbekistan'ın çok-taraflı kreditörlere verdiği tarife reformu taahhütlerini doğrulamaya devam ediyor. EBRD, ADB, IFC ve Dünya Bankası enerji sektörü kredilerinin tamamı sübvansiyon azaltılması şartına bağlıydı. 2026 seviyesi $236M (2023'teki $674M'dan düşerek) ile, sıradaki regülatif kilometre taşı — mesken 0–200 kWh kademesinin sübvansiyondan çıkışı — artık uzak bir vaat değil; 2028–2030 penceresi içinde zamanlama meselesi.
Sanayi müşterileri. +%10'luk hareket, büyük sanayiyi $90,2/MWh seviyesine taşıdı — Orta Asya peer'leriyle rekabetçi ama uzun vadeli $45,4/MWh aktif enerji tabanının üstünde. Başlık maliyeti iki şeyi birden ödüyor: aktif enerji bloğu + mesken 0–200 kademesini fonlayan çapraz-sübvansiyon katkısı.
Dağıtım operatörleri. Dağıtım (164 UZS) ve iletim bileşenleri mutlak UZS değerinde değişmedi. Yapısal değişim aktif enerji tarafında: $45,4/MWh'tan satın alınan kayıp enerji yeni aylık nakit çıkışı referansı. Yüksek teknik kayba sahip operatörler ilk olarak baskıyı hissedecek; kayıp azaltma capex'i artık daha net bir geri ödeme zeminine sahip.
Tüketiciler. En düşük kademe (konutların %78'i) yönetilebilir bir %8,3 artışla karşılaştı; bu kısmen doğrudan destek ödemelerindeki %25 artışla dengeleniyor. Orta kademe (201–500 kWh) en sert hamleyi yaşıyor (+%12,5).
Önümüzdeki dönem
Önümüzdeki 6–12 ayda izlenecek üç başlık. Aktif enerji birim fiyatının endeksleme kuralı — $45,4/MWh çıpası kurla mı, bir sepet endeksiyle mi yoksa nominal mi hareket edecek; 2027 nakit akışı öngörülebilirliğini bu belirleyecek. 0–200 kademesinde sübvansiyon çıkış yolu — yörünge 2028–2030'a işaret ediyor ama resmî takvim henüz yayımlanmadı. Grup I/II/IV ayrıştırması — Grup I (büyük sanayi, bütçe) Grup II ve IV'ten ayrılır mı; üçünü tek band'da tutmak 2026 sıfırlamasını basitleştirdi ama regülatörün talep yönetimi ve enerji yoğunluk hedeflerini farklı müşteri sınıflarında uygulama esnekliğini sınırlıyor.
Sonuç. Özbekistan'ın Haziran 2026 tarife sıfırlaması bir fiyat değişikliğinden çok bir süreklilik sinyali: üç yıllık sübvansiyon azaltma takvimi zamanında, çapraz-sübvansiyon mimarisi yerinde, ve aktif enerji birim fiyatı uzun vadeli düşüş eğrisine oturmuş durumda. Sektör için bu, regülatif yönü netleştiriyor; operatörler ve yatırımcılar için bir sonraki regülasyon döngüsüne kadar model girdilerini stabilize ediyor.
Kaynak: Bakanlar Kurulu 243 sayılı karar (15 Mayıs 2026, yürürlük 1 Haziran 2026); ulusal üretim yol haritası 2026–2055. Tarife rakamları 12.200 UZS/USD kuruyla.
Coming next
☀ WEEKLY INSIGHT #22 · SOLAR · TRADEComing next
Solar Module Prices in China, Europe, India and the United States, and the US Minimum Import Price
The next Weekly Insight sets out dated module price readings for China, Europe, India and the United States, and the terms of the United States minimum import price for solar modules.
WI#22 — next edition
ABOUT UZENERGYNEWS
Independent Global Energy Intelligence
Independent, data-driven coverage of global energy markets — with editorial depth in the Eurasian corridor. For investors, lenders, regulators and operators reading the transitions reshaping the sector.
What we cover
Power generation, transmission and distribution. Natural gas markets and infrastructure. Renewables, nuclear, hydrogen and battery storage. Datacenter power demand, hyperscaler PPAs and the AI-energy intersection. OT/ICS cybersecurity and grid security. Tariff and regulatory developments. M&A, IPOs, PPP deals and lender pipelines. Cross-border corridors and the capital flows reshaping the global energy transition.
How we work
Daily news is aggregated from 40+ trusted sources — official regulators, international agencies (IEA, IRENA, EMBER), development banks (EBRD, ADB, IFC, World Bank), and the leading sector press. AI assists with summarization, tagging and translation; editorial judgment remains human. Weekly Insight delivers a longer analytical piece every week — drawing on deep, independent sector experience.
Methodology
Every article passes a three-question test before publication: Is the information public? Does it draw on any privileged or confidential source? Could it materially affect a negotiation or competitive position? When in doubt, we hold the piece.
FREE NEWSLETTER
Weekly Insight
Every week: one long-form analysis from inside global energy markets — with Eurasian depth. No paywall, no spam, unsubscribe anytime.
By subscribing you agree to our editorial terms. We never share your email.
Contact
Have a tip, a correction, or a partnership idea? Send a message below, email us at contact@uzenergynews.com, or reach us on Telegram.
UZENERGYNEWS · RESEARCH
Research & Outlooks
In-depth, evergreen reference on the energy systems we cover — annual outlooks and country profiles, built entirely from public sources.
Flagship · Annual · New
Emerging Energy Outlook 2026
How the developing world powers its transition — ten economies (Türkiye, Uzbekistan, Kazakhstan, India, Pakistan, Indonesia, Vietnam, Nigeria, South Africa, Kenya) benchmarked against the EU-27 and the OECD on the indicators that price risk: per-capita demand, generation mix, tariffs, grid losses and investment, the cost of capital, and carbon intensity.
The first single-source comparison of electricity capacity, consumption, prices, market reform and cross-border integration across all eight OTS member and observer systems — with an independent 2030/2035 demand & capacity projection.
40 pages · 8 systems · EN/TR executive summary · June 2026
Türkiye Elektrik Piyasası Gelişim Raporu 2014–2025
A historical-series reference on Türkiye's electricity market from 2014 to 2025 — billed consumption, customer numbers, distribution losses and supply-continuity indicators (SAIDI/SAIFI) by consumer group and across the 21 distribution regions, with the investment series stated in real October-2025 prices. Compiled by UzEnergyNews from EPDK's annual electricity market development reports. Türkçe.
41 pages · 21 distribution regions · 2014–2025 · compiled from EPDK reports · June 2026
Standalone, evergreen profiles for each system through a reform lens — capacity, generation mix, demand, tariffs and market structure. Hub-and-spoke, paired with a weekly "Country in Focus." Pilot: Uzbekistan.
8 systems · in preparation
UZENERGYNEWS · LIBRARY
Energy Markets & Regulation: An Essential Reading List
The books, articles and institutional publications that built the field.
Energy markets across much of the world are changing shape. Private concessions are entering electricity distribution, tariff reform is under way, and the institutions of market regulation are being built or rebuilt. The professionals who design, regulate and operate these markets face questions that others confronted over the past four decades: how to set network tariffs, how to structure wholesale competition, how to protect consumers while attracting investment. The literature below records what those markets learned. It covers electricity and natural gas, and ranges from foundational theory to publications that appear every year.
1. Foundations of utility regulation
Alfred E. Kahn, The Economics of Regulation: Principles and Institutions (1970-1971). The standard reference on the economics of regulated industries. Kahn establishes that regulated prices should track marginal cost, and works through what that means for electricity, gas and transport. He later led the deregulation of US airlines, which gives the book unusual practical authority.
Harvey Averch & Leland L. Johnson, 'Behavior of the Firm Under Regulatory Constraint' (1962). A short article with lasting consequences. A firm regulated on a rate-of-return basis has an incentive to over-invest in capital, because a larger asset base raises its allowed profit. This Averch-Johnson effect is why regulators worldwide moved toward incentive-based regimes.
Stephen C. Littlechild, Regulation of British Telecommunications' Profitability (1983). The report that invented RPI-X price-cap regulation. Adopted by the British energy regulator and then worldwide, it is the ancestor of every revenue-cap and price-cap regime, including those in Türkiye and Central Asia.
David M. Newbery, Privatization, Restructuring, and Regulation of Network Utilities (2000). A synthesis of British and international experience in privatising electricity, gas, telecoms and water. Particularly strong on what happens when reforms are sequenced badly.
2. Electricity markets: the core bookshelf
Schweppe, Caramanis, Tabors & Bohn, Spot Pricing of Electricity (1988). The theoretical origin of modern wholesale markets. Locational marginal pricing, now used across US markets, grew directly from this book.
Paul L. Joskow & Richard Schmalensee, Markets for Power (1983). Written a decade before any country liberalised its power sector, it set the analytical framework for competition in generation and regulation of networks. Much of what it predicted came to pass.
Sally Hunt, Making Competition Work in Electricity (2002). The most readable account of market design ever written. Four models of sector organisation, from vertically integrated monopoly to full retail competition. The best starting point for executives and policymakers.
Steven Stoft, Power System Economics (2002). Forty-four short chapters bridging engineering and economics: marginal-cost pricing, fixed-cost recovery, market power, capacity markets and classic design fallacies. The most cited textbook in the field.
Daniel S. Kirschen & Goran Strbac, Fundamentals of Power System Economics (2004; 2nd ed. 2018). The standard graduate textbook for engineers entering the market side. The second edition adds renewables and storage; shorter and more accessible than Stoft.
Darryl R. Biggar & Mohammad Reza Hesamzadeh, The Economics of Electricity Markets (2014). A rigorous, unified treatment from first principles to nodal pricing, transmission rights and market power. For readers who want mathematical depth after Hunt or Kirschen & Strbac.
Glachant, Joskow & Pollitt (eds.), Handbook on Electricity Markets (2021). Twenty-two chapters by leading experts: wholesale and retail markets, renewable integration, electrification, distributed generation and storage. The most current comprehensive reference.
Gretchen Bakke, The Grid (2016). A cultural and historical account of the grid for general readers. Useful for communications teams and for explaining to non-specialists why the grid is hard to change.
3. Articles that changed the field
William W. Hogan, 'Contract Networks for Electric Power Transmission' (1992). Made locational pricing workable by inventing financial transmission rights. Every US wholesale market design rests on this paper.
Paul L. Joskow, 'Lessons Learned from Electricity Market Liberalization' (2008). The best single summary of what worked and what failed in the first two decades of reform. If you read only one academic article, this is the one.
Severin Borenstein & James Bushnell, 'The US Electricity Industry After 20 Years of Restructuring' (2015). A clear-eyed assessment: where competition delivered savings, where it did not, and why retail competition disappointed.
Peter Cramton, 'Electricity Market Design' (2017). A concise synthesis of how energy, capacity and ancillary-services markets fit together, by a leading auction designer.
Lion Hirth, 'The Market Value of Variable Renewables' (2013). Why the market value of wind and solar falls as their share grows. Essential for designing support schemes or forecasting prices in high-renewable systems.
4. Natural gas
Daniel Yergin, The Prize (1991). The Pulitzer-winning history of oil and petro-politics. Two sequels extend the story: The Quest (2011) on gas, electricity and renewables, and The New Map (2020) on shale, LNG trade and the new geopolitics of energy, including Central Asia.
Jonathan Stern, The Future of Russian Gas and Gazprom (2005). The reference work on Russian gas supply and its relationship with importing countries — essential background for the wider Eurasian region.
Jonathan Stern (ed.), The Pricing of Internationally Traded Gas (2012). The definitive treatment of how gas prices form worldwide: oil indexation, hub pricing and the transition between them.
Vaclav Smil, Natural Gas: Fuel for the 21st Century (2015). A systematic survey from geology and extraction to transport, use and trade — the whole industry in three hundred data-dense pages.
OIES Gas Programme papers (2003 to present). The Oxford Institute for Energy Studies publishes its gas research free at oxfordenergy.org — the closest thing the industry has to a running seminar, with regular papers on European, Russian and Central Asian gas.
5. Institutional publications to follow every year
IEA, World Energy Outlook (annual). The flagship of the International Energy Agency and the most widely used set of long-term scenarios. Investment committees, lenders and regulators all reference it.
ACER & CEER, Market Monitoring Report (annual). The EU regulators' joint country-by-country monitoring of electricity and gas markets — the largest sustained cross-country comparison of energy market performance anywhere.
CEER, Report on Regulatory Frameworks for European Energy Networks (annual). Compares how European regulators set the allowed rate of return, the regulatory asset base and depreciation. For anyone working on network tariffs, the benchmark library.
World Bank, Rethinking Power Sector Reform in the Developing World (2020). The most comprehensive evaluation of forty years of reform outside the rich world. Its finding — that formal frameworks often run far ahead of regulatory practice — is directly relevant to every reforming country.
World Bank & ESMAP, RISE: Regulatory Indicators for Sustainable Energy. A scorecard rating the energy policy and regulatory frameworks of 140 countries, including Uzbekistan, with direct comparison across countries and over time.
ERRA publications and tariff database. The Energy Regulators Regional Association brings together regulators from Central Europe, Eurasia and beyond — among the few comparative resources focused on the region between the EU and East Asia.
Where to start
A practical order for a professional new to the field: begin with Hunt for orientation, then Kirschen & Strbac for the technical foundations. Read Joskow (2008) for what reform experience has shown, and keep the Glachant–Joskow–Pollitt Handbook as the reference for current questions. On gas, read The New Map for the geopolitical picture and Stern (2012) for pricing. Then follow the annual institutional publications, because the field moves with them. For any market in transition the relevance is direct: every step being taken has been taken before, somewhere — and working through this list is considerably cheaper than repeating the experiments.
Abbreviations
Abbreviation
Full name
ACER
European Union Agency for the Cooperation of Energy Regulators
CEER
Council of European Energy Regulators
DSO
Distribution System Operator
ERRA
Energy Regulators Regional Association
EU
European Union
IEA
International Energy Agency
LNG
Liquefied Natural Gas
OIES
Oxford Institute for Energy Studies
RAB
Regulatory Asset Base
RISE
Regulatory Indicators for Sustainable Energy
RPI
Retail Price Index
TSO
Transmission System Operator
Bibliography
Averch, H. and Johnson, L. L. (1962), 'Behavior of the Firm Under Regulatory Constraint', American Economic Review, 52(5), pp. 1052-1069.
Bakke, G. (2016), The Grid: The Fraying Wires Between Americans and Our Energy Future, Bloomsbury, New York.
Biggar, D. R. and Hesamzadeh, M. R. (2014), The Economics of Electricity Markets, Wiley-IEEE Press, Chichester.
Borenstein, S. and Bushnell, J. (2015), 'The US Electricity Industry After 20 Years of Restructuring', Annual Review of Economics, 7, pp. 437-463.
Council of European Energy Regulators (annual), Report on Regulatory Frameworks for European Energy Networks, CEER, Brussels.
Cramton, P. (2017), 'Electricity Market Design', Oxford Review of Economic Policy, 33(4), pp. 589-612.
European Union Agency for the Cooperation of Energy Regulators and Council of European Energy Regulators (annual), Market Monitoring Report, ACER and CEER, Ljubljana and Brussels.
Foster, V. and Rana, A. (2020), Rethinking Power Sector Reform in the Developing World, World Bank, Washington, DC.
Glachant, J.-M., Joskow, P. L. and Pollitt, M. G. (eds.) (2021), Handbook on Electricity Markets, Edward Elgar, Cheltenham.
Hirth, L. (2013), 'The Market Value of Variable Renewables', Energy Economics, 38, pp. 218-236.
Hogan, W. W. (1992), 'Contract Networks for Electric Power Transmission', Journal of Regulatory Economics, 4(3), pp. 211-242.
Hunt, S. (2002), Making Competition Work in Electricity, John Wiley and Sons, New York.
International Energy Agency (annual), World Energy Outlook, IEA, Paris.
Joskow, P. L. (2008), 'Lessons Learned from Electricity Market Liberalization', The Energy Journal, 29(Special Issue 2), pp. 9-42.
Joskow, P. L. and Schmalensee, R. (1983), Markets for Power: An Analysis of Electric Utility Deregulation, MIT Press, Cambridge, MA.
Kahn, A. E. (1988), The Economics of Regulation: Principles and Institutions, MIT Press, Cambridge, MA (first published 1970-1971).
Kirschen, D. S. and Strbac, G. (2018), Fundamentals of Power System Economics, 2nd edition, John Wiley and Sons, Chichester.
Littlechild, S. C. (1983), Regulation of British Telecommunications' Profitability, Department of Industry, London.
Newbery, D. M. (2000), Privatization, Restructuring, and Regulation of Network Utilities, MIT Press, Cambridge, MA.
Schweppe, F. C., Caramanis, M. C., Tabors, R. D. and Bohn, R. E. (1988), Spot Pricing of Electricity, Kluwer Academic Publishers, Boston.
Smil, V. (2015), Natural Gas: Fuel for the 21st Century, John Wiley and Sons, Chichester.
Stern, J. P. (2005), The Future of Russian Gas and Gazprom, Oxford University Press, Oxford.
Stern, J. P. (ed.) (2012), The Pricing of Internationally Traded Gas, Oxford University Press and OIES, Oxford.
Stoft, S. (2002), Power System Economics: Designing Markets for Electricity, IEEE Press and Wiley-Interscience, New York.
World Bank and ESMAP (2022), Regulatory Indicators for Sustainable Energy (RISE) 2022: Building Resilience, World Bank, Washington, DC.
Yergin, D. (1991), The Prize: The Epic Quest for Oil, Money and Power, Simon and Schuster, New York.
Yergin, D. (2011), The Quest: Energy, Security, and the Remaking of the Modern World, Penguin Press, New York.
Yergin, D. (2020), The New Map: Energy, Climate, and the Clash of Nations, Penguin Press, New York.
Dünyanın birçok yerinde enerji piyasaları yeniden şekilleniyor. Elektrik dağıtımına özel konsesyonlar giriyor, tarife reformu sürüyor ve piyasa düzenlemesinin kurumları inşa ediliyor. Bu piyasaları tasarlayan, düzenleyen ve işleten profesyoneller, başka ülkelerin son kırk yılda karşılaştığı sorularla yüzleşiyor: şebeke tarifeleri nasıl belirlenir, toptan rekabet nasıl kurgulanır, yatırım çekerken tüketici nasıl korunur. Aşağıdaki literatür, bu piyasaların öğrendiklerinin kaydıdır. Elektrik ve doğal gazı kapsar; temel kuramdan her yıl yayımlanan periyodik yayınlara uzanır.
1. Kamu hizmeti düzenlemesinin temelleri
Alfred E. Kahn, The Economics of Regulation: Principles and Institutions (1970-1971). Düzenlenen sektörlerin iktisadına dair standart başvuru kaynağı. Kahn, düzenlenen fiyatların marjinal maliyeti izlemesi gerektiğini ortaya koyar ve bunun elektrik, gaz ve ulaştırma için anlamını işler. Sonradan ABD havayollarının serbestleştirmesine önderlik etmesi kitaba ayrı bir pratik otorite kazandırır.
Harvey Averch & Leland L. Johnson, 'Behavior of the Firm Under Regulatory Constraint' (1962). Kalıcı etkileri olan kısa bir makale. Getiri oranı esasına göre düzenlenen bir firmanın aşırı sermaye yatırımı yapma eğilimi vardır; çünkü daha büyük bir varlık tabanı izin verilen kârı yükseltir. Averch-Johnson etkisi olarak bilinen bu bulgu, düzenleyicilerin teşvik esaslı rejimlere yönelmesinin nedenidir.
Stephen C. Littlechild, Regulation of British Telecommunications' Profitability (1983). RPI-X fiyat tavanı düzenlemesini icat eden rapor. Önce İngiliz enerji düzenleyicisi, ardından dünya tarafından benimsendi; Türkiye ve Orta Asya dahil her gelir-tavanı ve fiyat-tavanı rejiminin atasıdır.
David M. Newbery, Privatization, Restructuring, and Regulation of Network Utilities (2000). Elektrik, gaz, telekomünikasyon ve suyun özelleştirilmesine dair İngiliz ve uluslararası deneyimin bir sentezi. Reformların yanlış sıralanması durumunda ne olduğu konusunda özellikle güçlü.
2. Elektrik piyasaları: temel kitaplık
Schweppe, Caramanis, Tabors & Bohn, Spot Pricing of Electricity (1988). Modern toptan piyasaların kuramsal kökeni. Bugün ABD piyasalarında kullanılan bölgesel marjinal fiyatlama doğrudan bu kitaptan doğdu.
Paul L. Joskow & Richard Schmalensee, Markets for Power (1983). Henüz hiçbir ülke elektrik sektörünü serbestleştirmeden on yıl önce yazıldı; üretimde rekabet ve şebeke düzenlemesi için analitik çerçeveyi kurdu. Öngördüklerinin çoğu gerçekleşti.
Sally Hunt, Making Competition Work in Electricity (2002). Piyasa tasarımı üzerine yazılmış en okunabilir eser. Dikey bütünleşik tekelden tam perakende rekabete dört sektör organizasyon modeli. Yöneticiler ve politika yapıcılar için en iyi başlangıç noktası.
Steven Stoft, Power System Economics (2002). Mühendislik ile iktisadı birleştiren kırk dört kısa bölüm: marjinal maliyet fiyatlaması, sabit maliyet geri kazanımı, piyasa gücü, kapasite piyasaları ve klasik tasarım yanılgıları. Alanın en çok atıf alan ders kitabı.
Daniel S. Kirschen & Goran Strbac, Fundamentals of Power System Economics (2004; 2. baskı 2018). Piyasa tarafına geçen mühendisler için standart lisansüstü ders kitabı. İkinci baskı yenilenebilir ve depolamayı ekler; Stoft'tan daha kısa ve erişilebilir.
Darryl R. Biggar & Mohammad Reza Hesamzadeh, The Economics of Electricity Markets (2014). Temel ilkelerden düğüm-bazlı fiyatlamaya, iletim haklarına ve piyasa gücüne uzanan titiz, bütünleşik bir inceleme. Hunt veya Kirschen & Strbac sonrası matematiksel derinlik isteyenler için.
Glachant, Joskow & Pollitt (ed.), Handbook on Electricity Markets (2021). Önde gelen uzmanlarca yazılmış yirmi iki bölüm: toptan ve perakende piyasalar, yenilenebilir entegrasyonu, elektrifikasyon, dağıtık üretim ve depolama. En güncel kapsamlı başvuru kaynağı.
Gretchen Bakke, The Grid (2016). Şebekenin genel okur için yazılmış kültürel ve tarihsel anlatısı. İletişim ekipleri ve şebekenin neden zor değiştiğini uzman olmayanlara anlatmak için faydalı.
3. Alanı değiştiren makaleler
William W. Hogan, 'Contract Networks for Electric Power Transmission' (1992). Finansal iletim haklarını icat ederek bölgesel fiyatlamayı uygulanabilir kıldı. Her ABD toptan piyasa tasarımı bu makaleye dayanır.
Paul L. Joskow, 'Lessons Learned from Electricity Market Liberalization' (2008). Reformun ilk yirmi yılında nelerin işe yaradığının ve nelerin başarısız olduğunun en iyi tek özeti. Tek bir akademik makale okunacaksa bu olmalı.
Severin Borenstein & James Bushnell, 'The US Electricity Industry After 20 Years of Restructuring' (2015). Açık sözlü bir değerlendirme: rekabetin nerede tasarruf sağladığı, nerede sağlamadığı ve perakende rekabetin neden beklentinin altında kaldığı.
Peter Cramton, 'Electricity Market Design' (2017). Enerji, kapasite ve yan hizmet piyasalarının nasıl bir araya geldiğine dair özlü bir sentez; önde gelen bir ihale tasarımcısının kaleminden.
Lion Hirth, 'The Market Value of Variable Renewables' (2013). Rüzgâr ve güneşin piyasa değerinin payları arttıkça neden düştüğünü açıklar. Destek mekanizması tasarlayan veya yüksek yenilenebilir paylı sistemlerde fiyat öngören herkes için temel.
4. Doğal gaz
Daniel Yergin, The Prize (1991). Petrol ve petro-politikanın Pulitzer ödüllü tarihi. İki devam kitabı hikâyeyi sürdürür: The Quest (2011) gaz, elektrik ve yenilenebilirleri; The New Map (2020) kaya gazını, LNG ticaretini ve Orta Asya dahil enerjinin yeni jeopolitiğini ele alır.
Jonathan Stern, The Future of Russian Gas and Gazprom (2005). Rus gaz arzı ve ithalatçı ülkelerle ilişkisi üzerine başvuru eseri — geniş Avrasya bölgesi için temel arka plan.
Jonathan Stern (ed.), The Pricing of Internationally Traded Gas (2012). Gaz fiyatlarının dünya genelinde nasıl oluştuğuna dair kesin inceleme: petrol endeksleme, hub fiyatlaması ve aralarındaki geçiş.
Vaclav Smil, Natural Gas: Fuel for the 21st Century (2015). Jeolojiden ve çıkarımdan taşımaya, kullanıma ve ticarete uzanan sistematik bir inceleme — tüm sektör üç yüz veri-yoğun sayfada.
OIES Gaz Programı makaleleri (2003'ten bugüne). Oxford Institute for Energy Studies gaz araştırmalarını oxfordenergy.org'da ücretsiz yayımlar — sektörün süregelen bir seminere en yakın hâli; Avrupa, Rus ve Orta Asya gazı üzerine düzenli makaleler.
5. Her yıl takip edilecek kurumsal yayınlar
IEA, World Energy Outlook (yıllık). Uluslararası Enerji Ajansı'nın amiral yayını ve en yaygın kullanılan uzun dönem senaryo seti. Yatırım komiteleri, kredi verenler ve düzenleyiciler hepsi referans alır.
ACER & CEER, Market Monitoring Report (yıllık). AB düzenleyicilerinin elektrik ve gaz piyasalarını ülke ülke ortak izlemesi — enerji piyasası performansının dünyadaki en kapsamlı sürekli ülkeler-arası karşılaştırması.
CEER, Report on Regulatory Frameworks for European Energy Networks (yıllık). Avrupalı düzenleyicilerin izin verilen getiri oranını, düzenlemeye esas varlık tabanını ve amortismanı nasıl belirlediğini karşılaştırır. Şebeke tarifeleriyle çalışan herkes için kıyas kütüphanesi.
Dünya Bankası, Rethinking Power Sector Reform in the Developing World (2020). Gelişmiş dünya dışındaki kırk yıllık reformun en kapsamlı değerlendirmesi. Resmî çerçevelerin çoğu zaman düzenleyici uygulamanın çok ilerisinde olduğu bulgusu, reform yapan her ülke için doğrudan ilgilidir.
Dünya Bankası & ESMAP, RISE: Regulatory Indicators for Sustainable Energy. Özbekistan dahil 140 ülkenin enerji politikası ve düzenleyici çerçevelerini puanlayan, ülkeler arası ve zaman içinde doğrudan karşılaştırma sağlayan bir karne.
ERRA yayınları ve tarife veri tabanı. Energy Regulators Regional Association, Orta Avrupa, Avrasya ve ötesinden düzenleyicileri bir araya getirir — AB ile Doğu Asya arasındaki bölgeye odaklanan az sayıda karşılaştırmalı kaynaktan biri.
Nereden başlamalı
Alana yeni başlayan bir profesyonel için pratik bir sıra: yön bulmak için Hunt ile başlayın, ardından teknik temeller için Kirschen & Strbac. Reform deneyiminin ne gösterdiğini anlamak için Joskow (2008)'u okuyun ve güncel sorular için Glachant–Joskow–Pollitt Handbook'u başvuru olarak elinizde tutun. Gazda, jeopolitik resim için The New Map, fiyatlama için Stern (2012). Sonra yıllık kurumsal yayınları izleyin; çünkü alan onlarla birlikte ilerler. Dönüşüm halindeki her piyasa için bu deneyim doğrudan geçerlidir: atılan her adım daha önce bir yerde atılmıştır — ve bu listeyi çalışmak, deneyleri tekrarlamaktan çok daha ucuzdur.
Kısaltmalar
Kısaltma
Açılım
ACER
European Union Agency for the Cooperation of Energy Regulators (AB Enerji Düzenleyicileri İşbirliği Ajansı)
CEER
Council of European Energy Regulators (Avrupa Enerji Düzenleyicileri Konseyi)
DSO
Dağıtım Sistemi İşletmecisi
ERRA
Energy Regulators Regional Association (Bölgesel Enerji Düzenleyicileri Birliği)
EU
Avrupa Birliği
IEA
International Energy Agency (Uluslararası Enerji Ajansı)
LNG
Sıvılaştırılmış Doğal Gaz
OIES
Oxford Institute for Energy Studies (Oxford Enerji Çalışmaları Enstitüsü)
RAB
Düzenlemeye Esas Varlık Tabanı (Regulatory Asset Base)
RISE
Regulatory Indicators for Sustainable Energy
RPI
Perakende Fiyat Endeksi (Retail Price Index)
TSO
İletim Sistemi İşletmecisi
Kaynakça
Averch, H. and Johnson, L. L. (1962), 'Behavior of the Firm Under Regulatory Constraint', American Economic Review, 52(5), pp. 1052-1069.
Bakke, G. (2016), The Grid: The Fraying Wires Between Americans and Our Energy Future, Bloomsbury, New York.
Biggar, D. R. and Hesamzadeh, M. R. (2014), The Economics of Electricity Markets, Wiley-IEEE Press, Chichester.
Borenstein, S. and Bushnell, J. (2015), 'The US Electricity Industry After 20 Years of Restructuring', Annual Review of Economics, 7, pp. 437-463.
Council of European Energy Regulators (annual), Report on Regulatory Frameworks for European Energy Networks, CEER, Brussels.
Cramton, P. (2017), 'Electricity Market Design', Oxford Review of Economic Policy, 33(4), pp. 589-612.
European Union Agency for the Cooperation of Energy Regulators and Council of European Energy Regulators (annual), Market Monitoring Report, ACER and CEER, Ljubljana and Brussels.
Foster, V. and Rana, A. (2020), Rethinking Power Sector Reform in the Developing World, World Bank, Washington, DC.
Glachant, J.-M., Joskow, P. L. and Pollitt, M. G. (eds.) (2021), Handbook on Electricity Markets, Edward Elgar, Cheltenham.
Hirth, L. (2013), 'The Market Value of Variable Renewables', Energy Economics, 38, pp. 218-236.
Hogan, W. W. (1992), 'Contract Networks for Electric Power Transmission', Journal of Regulatory Economics, 4(3), pp. 211-242.
Hunt, S. (2002), Making Competition Work in Electricity, John Wiley and Sons, New York.
International Energy Agency (annual), World Energy Outlook, IEA, Paris.
Joskow, P. L. (2008), 'Lessons Learned from Electricity Market Liberalization', The Energy Journal, 29(Special Issue 2), pp. 9-42.
Joskow, P. L. and Schmalensee, R. (1983), Markets for Power: An Analysis of Electric Utility Deregulation, MIT Press, Cambridge, MA.
Kahn, A. E. (1988), The Economics of Regulation: Principles and Institutions, MIT Press, Cambridge, MA (ilk baskı 1970-1971).
Kirschen, D. S. and Strbac, G. (2018), Fundamentals of Power System Economics, 2nd edition, John Wiley and Sons, Chichester.
Littlechild, S. C. (1983), Regulation of British Telecommunications' Profitability, Department of Industry, London.
Newbery, D. M. (2000), Privatization, Restructuring, and Regulation of Network Utilities, MIT Press, Cambridge, MA.
Schweppe, F. C., Caramanis, M. C., Tabors, R. D. and Bohn, R. E. (1988), Spot Pricing of Electricity, Kluwer Academic Publishers, Boston.
Smil, V. (2015), Natural Gas: Fuel for the 21st Century, John Wiley and Sons, Chichester.
Stern, J. P. (2005), The Future of Russian Gas and Gazprom, Oxford University Press, Oxford.
Stern, J. P. (ed.) (2012), The Pricing of Internationally Traded Gas, Oxford University Press and OIES, Oxford.
Stoft, S. (2002), Power System Economics: Designing Markets for Electricity, IEEE Press and Wiley-Interscience, New York.
World Bank and ESMAP (2022), Regulatory Indicators for Sustainable Energy (RISE) 2022: Building Resilience, World Bank, Washington, DC.
Yergin, D. (1991), The Prize: The Epic Quest for Oil, Money and Power, Simon and Schuster, New York.
Yergin, D. (2011), The Quest: Energy, Security, and the Remaking of the Modern World, Penguin Press, New York.
Yergin, D. (2020), The New Map: Energy, Climate, and the Clash of Nations, Penguin Press, New York.