China Below 50 Per Cent Coal, India at a Record Renewable Month: The Two Share Milestones of Summer 2026
Within days of each other in late July and early August, the two largest developing power systems reported share milestones. China's National Energy Administration said coal-fired plants generated 2.5 trillion kilowatt-hours in the first half of 2026 — 49.7 per cent of electricity output, the first recorded half-year below one half — while renewable generation exceeded 40 per cent of the mix for the first time. Grid-India data showed July was India's highest renewable generation month on record: 36.25 billion kilowatt-hours, 20.0 per cent of generation on a definition that excludes large hydro, with coal's share at 65.7 per cent, its lowest in twelve months. The two milestones have different mechanics. In China, coal generation grew 3.4 per cent against consumption growth of 5.3 per cent and renewable growth of about 9 — a year-on-year share decline of about 0.9 points on a like-for-like basis. In India, coal generation was 12.8 per cent higher than a year earlier and its share was above last July's; the July share fell from 69 per cent in June as record renewables met a second consecutive month of declining hydro. Neither is a volume exit from coal. This edition sets out both, in charts and one table.
On 30 July, China's National Energy Administration reported that coal-fired plants generated 2.5 trillion kilowatt-hours in the first half of 2026, or 49.7 per cent of the country's electricity output — the first recorded half-year below one half. On 1 August, Grid-India monthly data showed the strongest renewable generation month in India's record: 36.25 billion kilowatt-hours, up 30 per cent year on year, equal to 20.0 per cent of generation on the CEA's definition, which counts solar, wind, biomass and small hydro but not large hydro. The figures measure shares, not volumes: Chinese coal generation grew 3.4 per cent over the half, and India's grew 12.8 per cent in July as heatwave demand peaked. What differs is the arithmetic underneath. In China, clean supply and demand both outgrew coal. In India, the record month coincided with hydro output falling for a second consecutive month, and coal's share — while a twelve-month low — was higher than in July 2025. The distinction between share change and volume change runs through every number that follows.
China: coal at 49.7 per cent in the first half
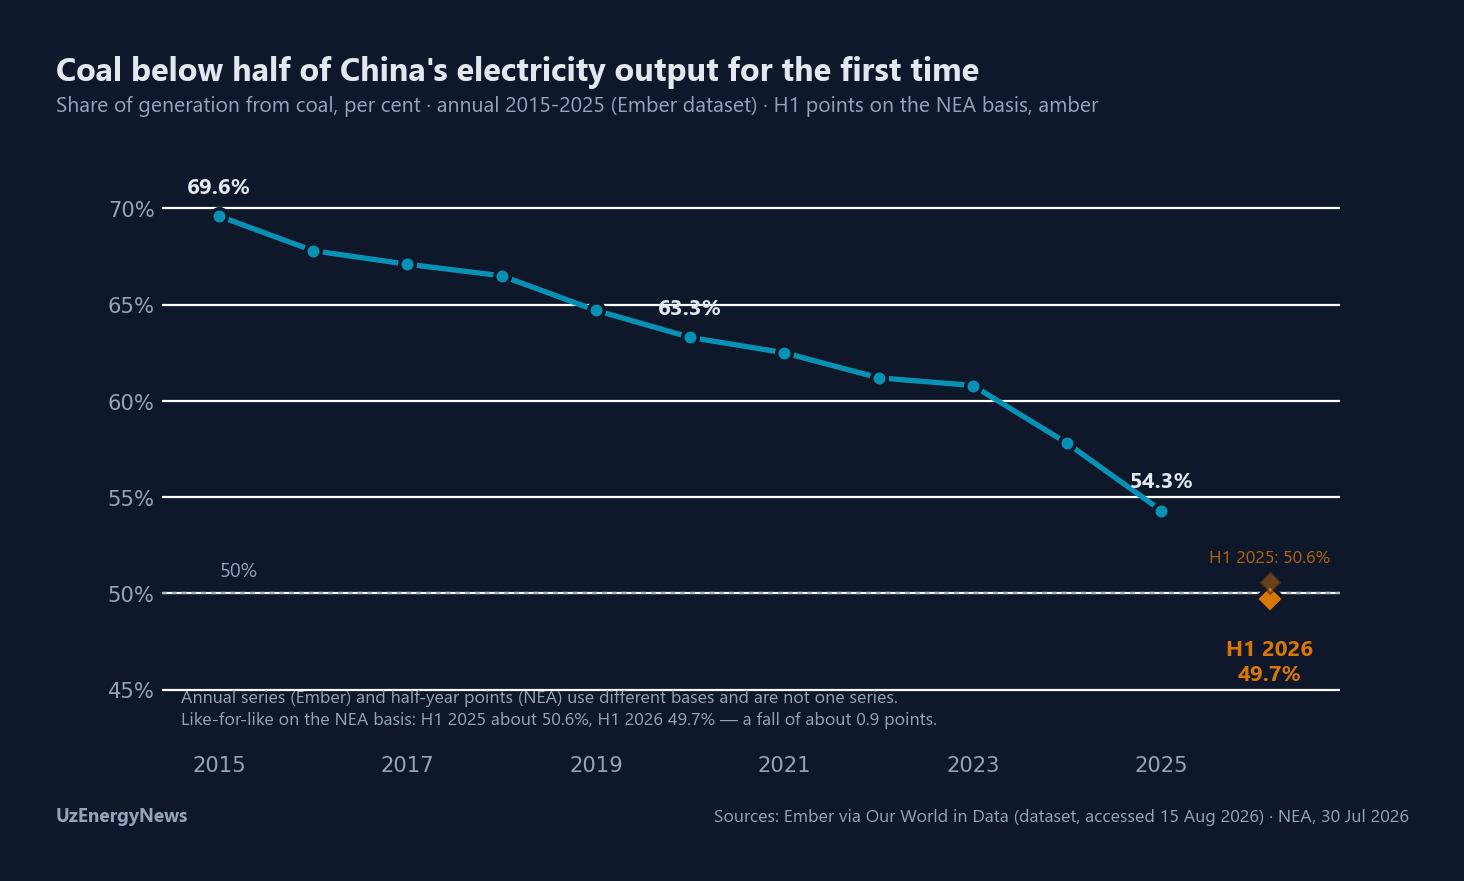
Electricity consumption in the first half of 2026 was 5,099.9 terawatt-hours, up 5.3 per cent. On the output side, coal accounted for 2.5 trillion kilowatt-hours, or 49.7 per cent of generation. Renewable generation was close to 2 trillion kilowatt-hours, up about 9 per cent, and crossed 40 per cent of output for the first time, at 41.2 per cent; wind and solar together exceeded 1.2 trillion kilowatt-hours, equivalent to about a quarter of consumption. The annual series gives the milestone its scale: on Ember's dataset, coal's share was 69.6 per cent in 2015 and 54.3 per cent in 2025. The half-year figure comes from Chinese official statistics — a different basis, on which the first half of 2025 stood at about 50.6 per cent, making the like-for-like decline about 0.9 points — and a full-year 2026 share above 50 per cent remains possible for seasonal reasons. The 2025 backdrop: clean generation covered the whole of demand growth for the first time, and coal generation fell for the first time since 2015 — by 71 terawatt-hours on Ember's accounting, roughly 90 on Carbon Brief's early estimate. Power-sector CO2 fell 1.5 per cent in 2025; economy-wide emissions were flat or falling for 21 months before rising about 2 per cent in the first quarter of 2026 (CREA). Curtailment: 360 terawatt-hours of wind and solar were curtailed in the first half, up 49 per cent — more than the half's entire increase in consumption, which was about 257 terawatt-hours (CREA/GEM).
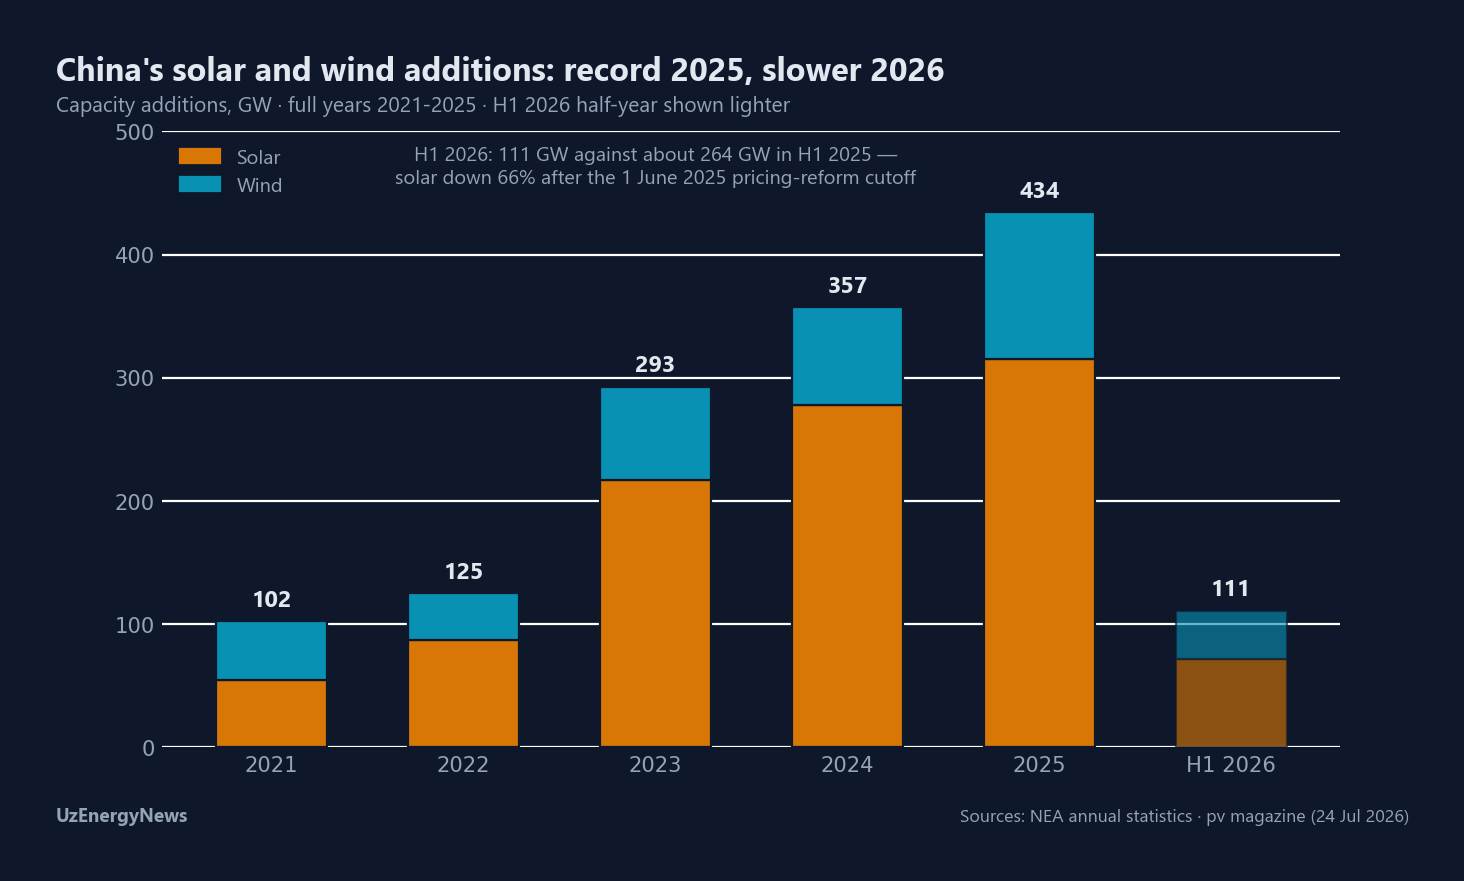
Capacity additions: 2025 record, 2026 first-half decline
China added 315.1 gigawatts of solar and 119.3 gigawatts of wind in 2025 — both records. By June 2026, cumulative wind and solar reached 1.95 terawatts, up 16.8 per cent in a year, within a total fleet of 4.04 terawatts; non-fossil sources are above 60 per cent of installed capacity. The first half of 2026 ran at a different pace: 72.1 gigawatts of solar, down 66 per cent year on year, and 39 gigawatts of wind — 111 gigawatts against roughly 264 in the first half of 2025. Reporting ties the fall to the February 2025 pricing reform, which replaced fixed tariffs with contracts for difference and pulled connections forward ahead of a 1 June 2025 cutoff. The targets have moved regardless: the 1,200-gigawatt wind-and-solar goal for 2030 was passed six years early in 2024, and the NDC announced in September 2025 sets 3,600 gigawatts or more by 2035. Coal capacity: proposals reached a record 161 gigawatts in 2025 and 78 gigawatts was commissioned, a ten-year high; in the first half of 2026, 30 gigawatts entered service against 2.7 retired (CREA/GEM).
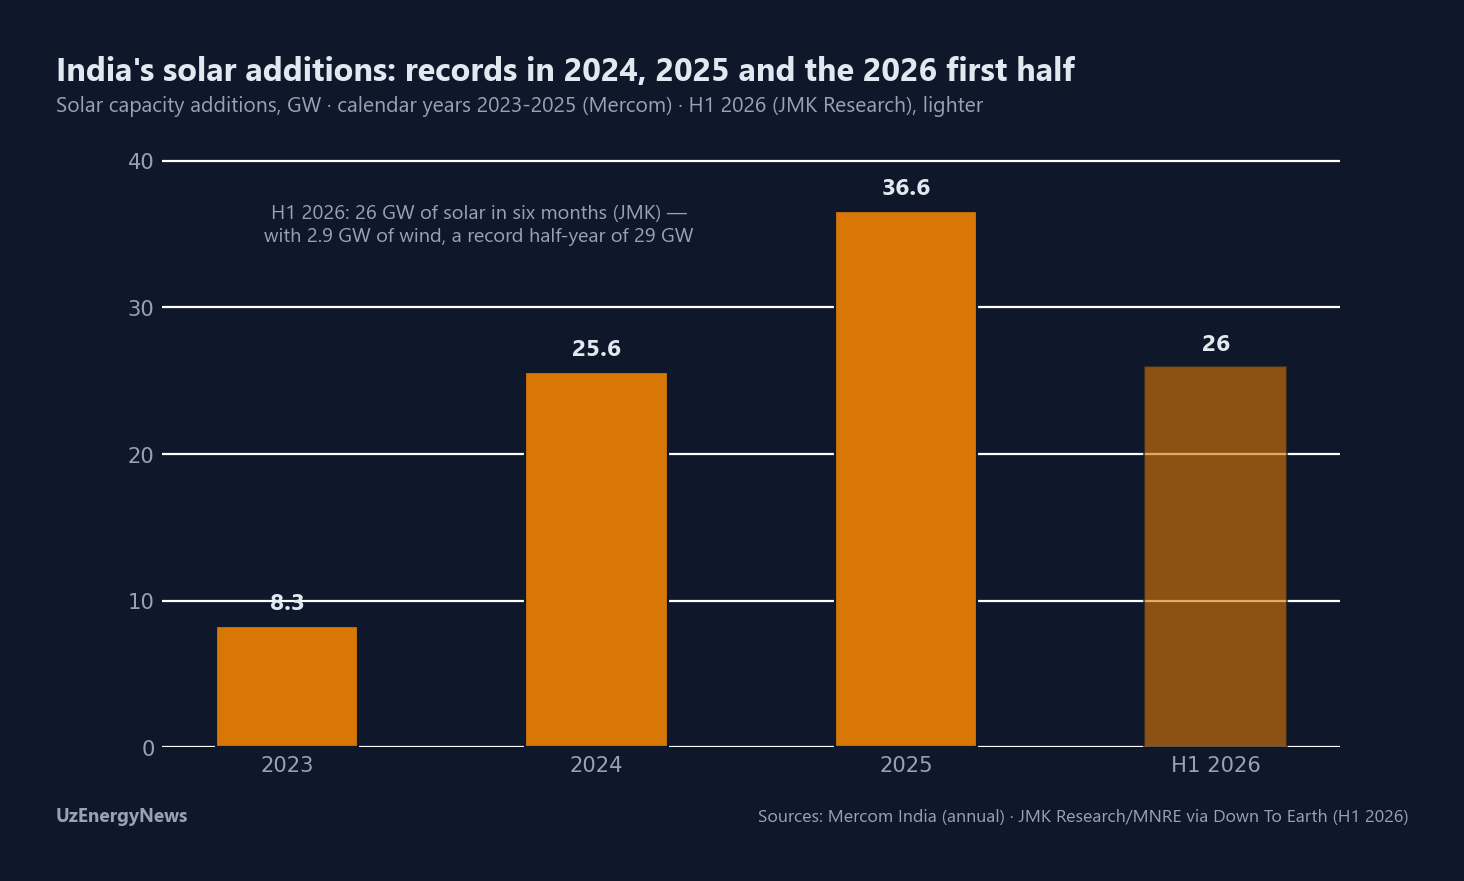
India: a record renewable month, with coal generation up 12.8 per cent
July's record is precise: 36.25 billion kilowatt-hours of renewable generation, up 30 per cent year on year, equal to 20.0 per cent of the month's 181.79 billion kilowatt-hours of total generation, which itself grew 10.4 per cent. Coal's share, 65.7 per cent, was the lowest in twelve months, down from 69 per cent in June — while coal generation rose 12.8 per cent from a year earlier and hydro output declined for a second consecutive month on weak rainfall. At 12:05 on 13 July, grid-connected solar and wind output reached 103.7 gigawatts, crossing 100 gigawatts for the first time and supplying 42.79 per cent of grid load at that instant. On the calendar-half measure the IEA uses, solar and wind produced 16.5 per cent of India's electricity in the first half of 2026, from 14.0 per cent a year earlier — solar up 31 per cent, wind up 12 per cent — while demand grew about 6 per cent and peak demand set a record of 270.8 gigawatts on 21 May. Capacity crossed two markers: non-fossil sources reached 300.5 gigawatts on 31 July — more than 54 per cent of the 552-gigawatt fleet, and over 60 per cent of the 500-gigawatt target for 2030 — and the first half's 29 gigawatts of solar and wind additions were a half-year record (solar 26 gigawatts, up 43 per cent, of which 6.4 rooftop under the PM Surya Ghar programme; wind 2.9, down 16 per cent). In 2025, fossil generation fell 3.3 per cent as solar and wind rose to 14 per cent of the mix, and India's solar additions passed the United States' for the first time — 38 against 35 gigawatts AC on Ember's count; Mercom's is 36.6. Coal pipeline: 23.5 gigawatts is under construction and 107.3 in pre-construction; official planning raises coal capacity from 223 to 283 gigawatts by 2031-32. Coal India's output fell 7.5 per cent in April-June as the company ran down about 28 million tonnes of pithead stocks and raised deliveries 3.5 per cent.
Share change and volume change, side by side
The table separates what moved from what it is often read as. In China, the share fell on a rising coal base: plus 3.4 per cent in volume, minus about 0.9 points in like-for-like share. In India, July's coal volume was 12.8 per cent higher than a year earlier and its share was above July 2025's; the twelve-month low is a within-year movement, produced by record renewables and two months of falling hydro. Both systems are adding coal capacity as they add record clean capacity. The global frame: China and India together account for more than a third of world electricity use, and world demand is growing 3.6 per cent this year on the IEA's mid-year update — both countries faster. On the crossing between renewables and coal in the world mix, the two reference datasets differ by scope: Ember's accounting has renewables ahead of coal already in 2025, at 33.9 against 33.0 per cent, while the IEA places the crossing in 2026. Watchpoints: China's full-year coal share and the post-reform additions pace; India's monsoon hydrology and summer coal burn; both countries' coal pipelines.
| Measure | China | India |
|---|---|---|
| Latest share marker | Coal 49.7% of output · H1 2026 (NEA) | Coal 65.7% of generation · July 2026 (Grid-India) |
| Coal generation, same period | +3.4% year on year | +12.8% year on year |
| Like-for-like share change | −0.9 points (H1 2025: 50.6%) | +1.4 points vs July 2025; −3.3 vs June |
| Solar and wind | >1.2 tn kWh in H1 ≈ a quarter of consumption | 16.5% of generation in H1 (IEA) |
| Demand growth | +5.3% (H1 consumption) | ~+6% (H1) |
| H1 2026 additions | Solar 72.1 + wind 39 GW | Solar 26 + wind 2.9 GW |
| Capacity marker | Wind+solar 1.95 TW; non-fossil >60% of 4.04 TW | Non-fossil 300.5 GW; 54% of 552 GW |
| Stated goal | 3,600+ GW wind+solar by 2035 (NDC) | 500 GW non-fossil by 2030 (60% reached) |
| Coal build, latest | 30 GW added vs 2.7 retired (H1 2026) | 23.5 GW building; 107.3 GW pre-construction |
Sources cited in text and figures: National Energy Administration press briefing of 30 July 2026, via Xinhua and gov.cn; Global Times/NEA (H1 consumption; wind and solar generation); Ember via Our World in Data, annual dataset (accessed 15 August 2026); CREA/GEM — Built for Backup, Contracted to Run (6 August 2026) and the China coal-power H2 2025 report; Carbon Brief (13 January and 12 February 2026); pv magazine (28 January and 24 July 2026); September 2025 NDC announcement as reported by CSIS and Caixin; Grid-India/CEA July 2026 data as reported by Reuters (SaurEnergy and Business Recorder syndications, 1-2 August 2026); IEA Electricity Mid-Year Update 2026; Ember Global Electricity Review 2026; Ministry of New and Renewable Energy/PIB capacity release of 31 July 2026; JMK Research via Down To Earth (H1 2026 additions); Mercom India (annual solar additions); Global Energy Monitor — Boom and Bust Coal 2026; CEA National Electricity Plan; Business Standard (5 July 2026, Coal India). Copyrighted material is not reproduced. Analysis by UzEnergyNews. Figures reflect public sources as of 15 August 2026.