23 Per Cent in 2025, 35 Per Cent Proposed for 2035: the IEA electrification measurements, IRENA's tripling and efficiency tracking, and the grid investment values ahead of COP31
1 October 2026 · 22 min read · UzEnergyNews · Energy & Market Intelligence
The International Energy Agency (IEA) measures electricity at 17 per cent of global final energy consumption in 2000 and 23 per cent in 2025. It places the 2035 share at about 30 per cent in scenarios based on "today's policy settings" and at 35 per cent in its High Electrification Scenario (IEA, Electrification – Special Report, 22 September 2026). The Presidency of the 31st Conference of the Parties to the United Nations Framework Convention on Climate Change (COP31) proposes 35 per cent by 2035 as a global objective for the conference in Antalya on 9–20 November 2026. The International Renewable Energy Agency (IRENA) published the third report in its annual tracking series with the COP31 Presidency and the Global Renewables Alliance on 21 September 2026. It records 5.15 terawatts of installed renewable power capacity at the end of 2025 after 693 gigawatts of additions in that year. The 2030 benchmark is 11.2 terawatts, and IRENA calculates the required additions at about 1.2 terawatts a year over 2026–2030. Energy intensity improved by 1.7 per cent in 2025; IRENA calculates the rate required over 2026–2030 at 5.6 per cent a year. This edition sets out the two measurement series, the rate each target requires against the rate recorded, and the grid investment values in both reports with their scope and price basis.
Publication details and the status of the 35 per cent proposal
The IEA released Electrification – Special Report on 22 September 2026 as a 198-page publication under a Creative Commons CC BY 4.0 licence. The governments of Türkiye and Australia requested the report. Türkiye is designated to hold the COP31 Presidency, and Australia is designated as COP31 President of Negotiations. The report was prepared within a strategic partnership between the COP31 Presidency and the IEA (IEA, pp. 3, 15, 25). Its three forewords are signed by the IEA Executive Director, the COP31 President-Designate and the COP31 President of Negotiations. Page references to the IEA report are given below as "IEA, p."
IRENA published the third edition of its annual tracking series, Delivering on the UAE Consensus: Tracking progress toward tripling renewable energy capacity and doubling energy efficiency by 2030 (ISBN 978-92-9260-750-0), jointly with the COP31 Presidency and the Global Renewables Alliance (GRA). IRENA was designated in early 2024 as the custodian agency for tracking two of the United Arab Emirates (UAE) Consensus goals (IRENA, p. 2). IRENA announced the release of the report on its official X account on 21 September 2026, and its launch press release places the release during Climate Week NYC. Page references to the IRENA report are given below as "IRENA, p." COP31 takes place in Antalya from 9 to 20 November 2026 (IRENA, p. 3).
The two targets tracked by IRENA come from paragraph 28 of the Outcome of the First Global Stocktake, agreed by 198 Parties at the 28th Conference of the Parties (COP28) in Dubai in 2023. The paragraph calls on Parties to contribute to "(a) Tripling renewable energy capacity globally and doubling the global average annual rate of energy efficiency improvements by 2030" (IRENA, p. 2).
Both reports present the 35 per cent electrification figure as a proposal of the COP31 Presidency:
IRENA report (p. 9). The COP31 President-Designate writes that the Presidency will advance its global electrification objective "to increase the share of electricity in global final energy consumption to 35% by 2035". The foreword issues "a global invitation for all actors to align behind this target".
IEA report (p. 5). The COP31 President-Designate refers to a "35-by-35 target" and writes that "Antalya will be the moment we commit to it together".
IRENA report (p. 11). Australia's Minister for Climate Change and Energy, as COP31 President of Negotiations, writes that Australia is working with Türkiye "to make COP31 an 'Electrification COP'".
The IEA report describes the 35 per cent level as a "goal, currently under international discussion" (IEA, p. 16). Neither report records the 35 per cent figure as an adopted decision of the Conference of the Parties.
As of 9 June 2026, 120 third-generation nationally determined contributions (NDC 3.0) had been submitted to the United Nations Framework Convention on Climate Change (NDC Registry data cited in IRENA, p. 55). They cover 77 per cent of global emissions. Of these submissions, 67 per cent contain a quantified renewable energy target and 43 per cent a quantified energy efficiency target (IRENA, p. 55).
The IEA measure: electricity's share of final energy consumption, 2000–2035
The IEA defines the electrification rate as the share of electricity in total final energy consumption (IEA, pp. 28–31, 186–187):
Non-energy uses such as chemical feedstocks are excluded from the denominator.
Traditional biomass is included. In the IEA's words, this "lowers the electrification rate" (IEA, p. 31).
International marine and aviation bunkers are included under transport in the world total.
The denominator is the one used for United Nations Sustainable Development Goal indicator 7.2.1 (IEA, p. 187).
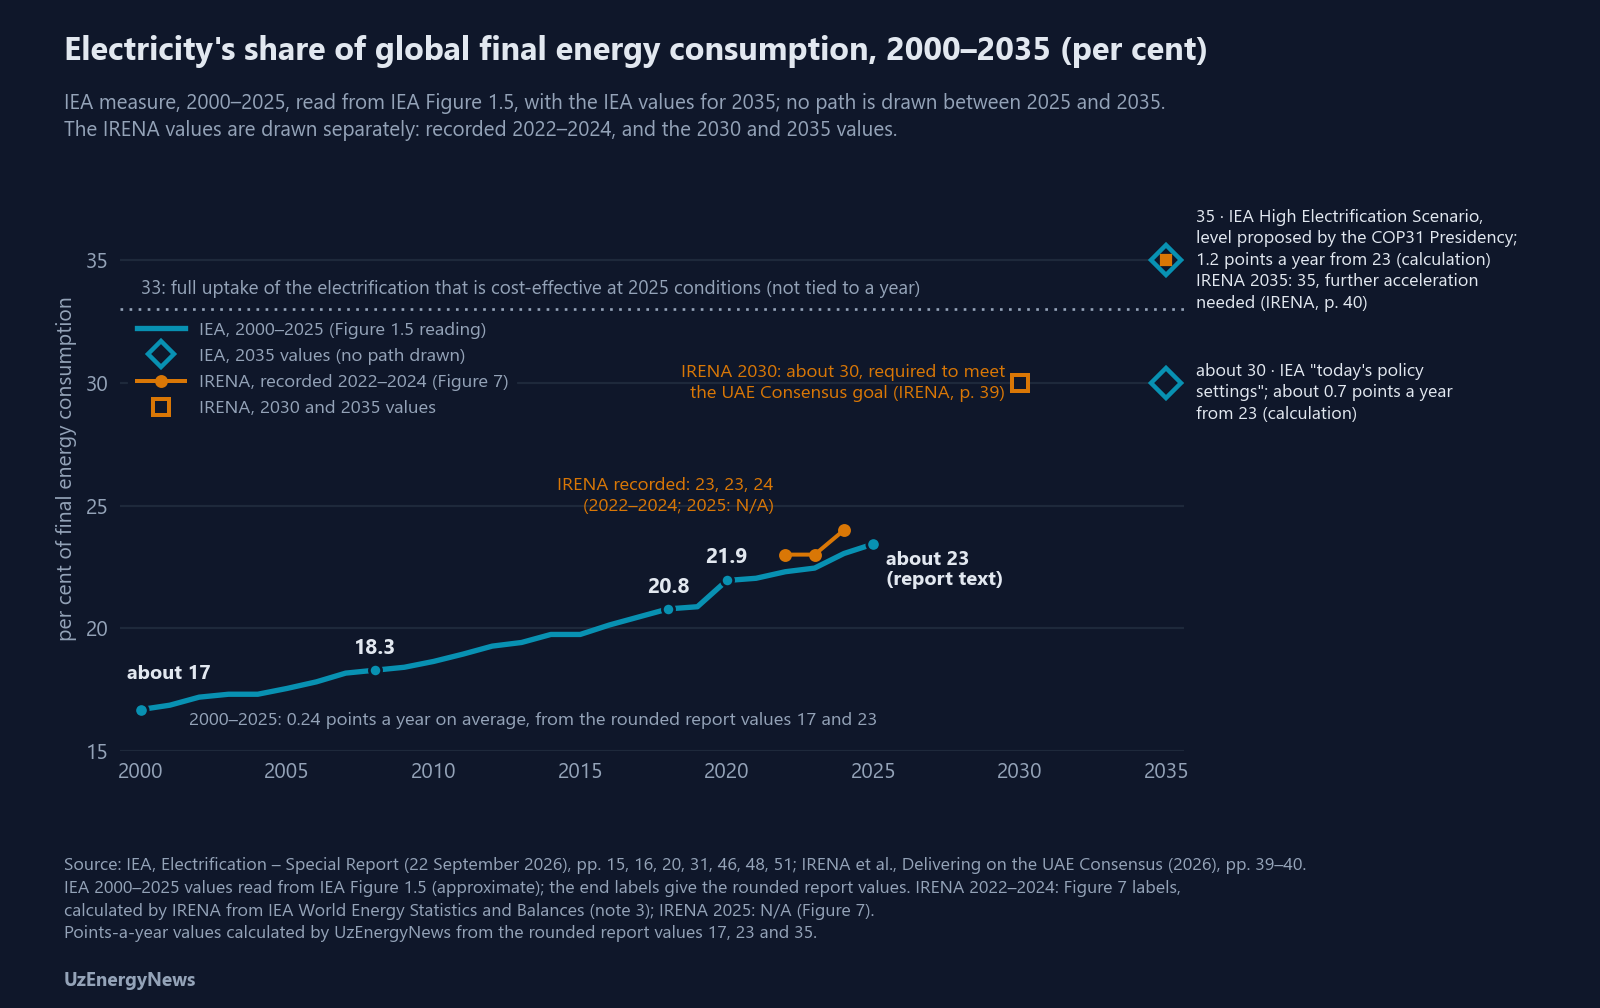
On this measure, electricity accounted for 17 per cent of global final energy consumption in 2000 and 23 per cent in 2025 (IEA, pp. 16, 31). These two rounded values from the report text give an average increase of 0.24 percentage points a year over 2000–2025 (calculation). Values read from IEA Figure 1.5 place the share at about 16.7 per cent in 2000, 18.3 per cent in 2008, 20.8 per cent in 2018, 21.9 per cent in 2020 and 23.4 per cent in 2025 (IEA, p. 31). On the 2000 and 2025 readings the average increase is about 0.27 points a year (calculation).
The IEA report gives three values for 2035:
About 30 per cent under "today's policy settings". In scenarios based on "today's policy settings" the share reaches "around 30%" (IEA, p. 20). Page 48 states it as "slightly less than 30%". This corresponds to about 0.7 points a year over 2025–2035 (calculation).
35 per cent in the High Electrification Scenario (IEA, pp. 15, 46). This is an average of 1.2 points a year over 2025–2035, five times the 2000–2025 average of 0.24 points; both rates are calculated from the rounded report values of 17, 23 and 35 per cent (calculation). The scenario is derived from the IEA's Net Zero Emissions by 2050 Scenario (IEA, p. 16).
33 per cent at full uptake of cost-effective electrification. This is the share that results if all electrification that is cost-effective for consumers at 2025 technology costs, energy prices and financing conditions is taken up. The calculation excludes system costs (IEA, p. 51).
The IEA report places the 33 per cent value "today" on pages 15 and 53 and "in 2035" on page 51. This edition states it on the 2025-conditions basis set out on page 51. The IEA states that its scenarios are not forecasts and that all of them use the same population and economic growth assumptions (IEA, p. 45).
By sector, electricity supplied about 40 per cent of final energy use in buildings, 28 per cent in industry and about 2 per cent in transport in 2025 (IEA, pp. 30, 31, 88). In the High Electrification Scenario the 2035 shares are about 56 per cent for buildings and about 39 per cent for industry, both read from IEA Figure 2.1 on page 49, which compares the Stated Policies Scenario (STEPS) with the High Electrification Scenario. The 2035 share for transport is 13 per cent (IEA, p. 49).
Global electricity demand exceeded 28,500 terawatt-hours (TWh) in 2025 (IEA, p. 27). Weekly Insight #13 of 30 July 2026 carried 28,600 TWh as the starting level, taken from the IEA Electricity Mid-Year Update of 23 July 2026. Annual demand growth averaged 750 TWh over 2015–2025. The IEA puts it at about 925 TWh a year in the Stated Policies Scenario and about 1,400 TWh a year in the High Electrification Scenario (IEA, p. 51).
Electrification in the IRENA report and the energy efficiency target
IRENA measures electrification as a component of the energy efficiency goal. IRENA states that electricity's share of total final energy consumption must rise from 23 per cent in 2023 to around 30 per cent by 2030 to meet the UAE Consensus goal (IRENA, p. 39). Page 40 states that further acceleration will be needed to reach 35 per cent by 2035 and cites IRENA's May 2026 report Transitioning away from fossil fuels for this value (IRENA, p. 40). IRENA's sector shares for 2023 and 2030 are (IRENA, p. 39):
buildings: 36 and 53 per cent;
industry: 27 and 31 per cent;
transport: 1 and 7 per cent.
IRENA Figure 7 gives the total electrification rate as 23 per cent in 2022 and 2023 and 24 per cent in 2024, and "N/A" for 2025; note 3 of the figure states that the recent-year values are calculated from IEA World Energy Statistics and Balances (IRENA, p. 40). For 2024 the reading of IEA Figure 1.5 is about 23.0 per cent (IEA, p. 31). Neither report explains the difference of about 1 point. IRENA's sector values are for 2023 and the IEA's for 2025, and IRENA names no source for its sector values on page 39. Because the two sets of sector values rest on different base years, this edition shows them separately and does not compare them line by line.
IRENA measures energy intensity as total primary energy supply divided by gross domestic product at 2025 purchasing power parity (IRENA, p. 38). Energy intensity improved by 1.7 per cent in 2025 (IRENA, pp. 16, 38). IRENA Figure 6 gives 2.0 per cent for 2022 and 1.1 per cent for each of 2023 and 2024 (IRENA, p. 38). IRENA expresses the goal of doubling energy efficiency from 2022 levels as an improvement of 4 per cent a year over 2023–2030. After the rates recorded for 2023–2025, the average required over 2026–2030 is 5.6 per cent a year (IRENA, pp. 7, 38), 3.3 times the 2025 rate (calculation). IRENA's updated Planned Energy Scenario gives about 3 per cent a year for 2026–2030 (IRENA, p. 38). The IRENA Director-General's foreword states that "the UAE Consensus goals may no longer be sufficient to keep the world on 1.5°C-compatible pathway" (IRENA, p. 7).
Renewable capacity: 5.15 TW at end-2025 against the 11.2 TW benchmark for 2030
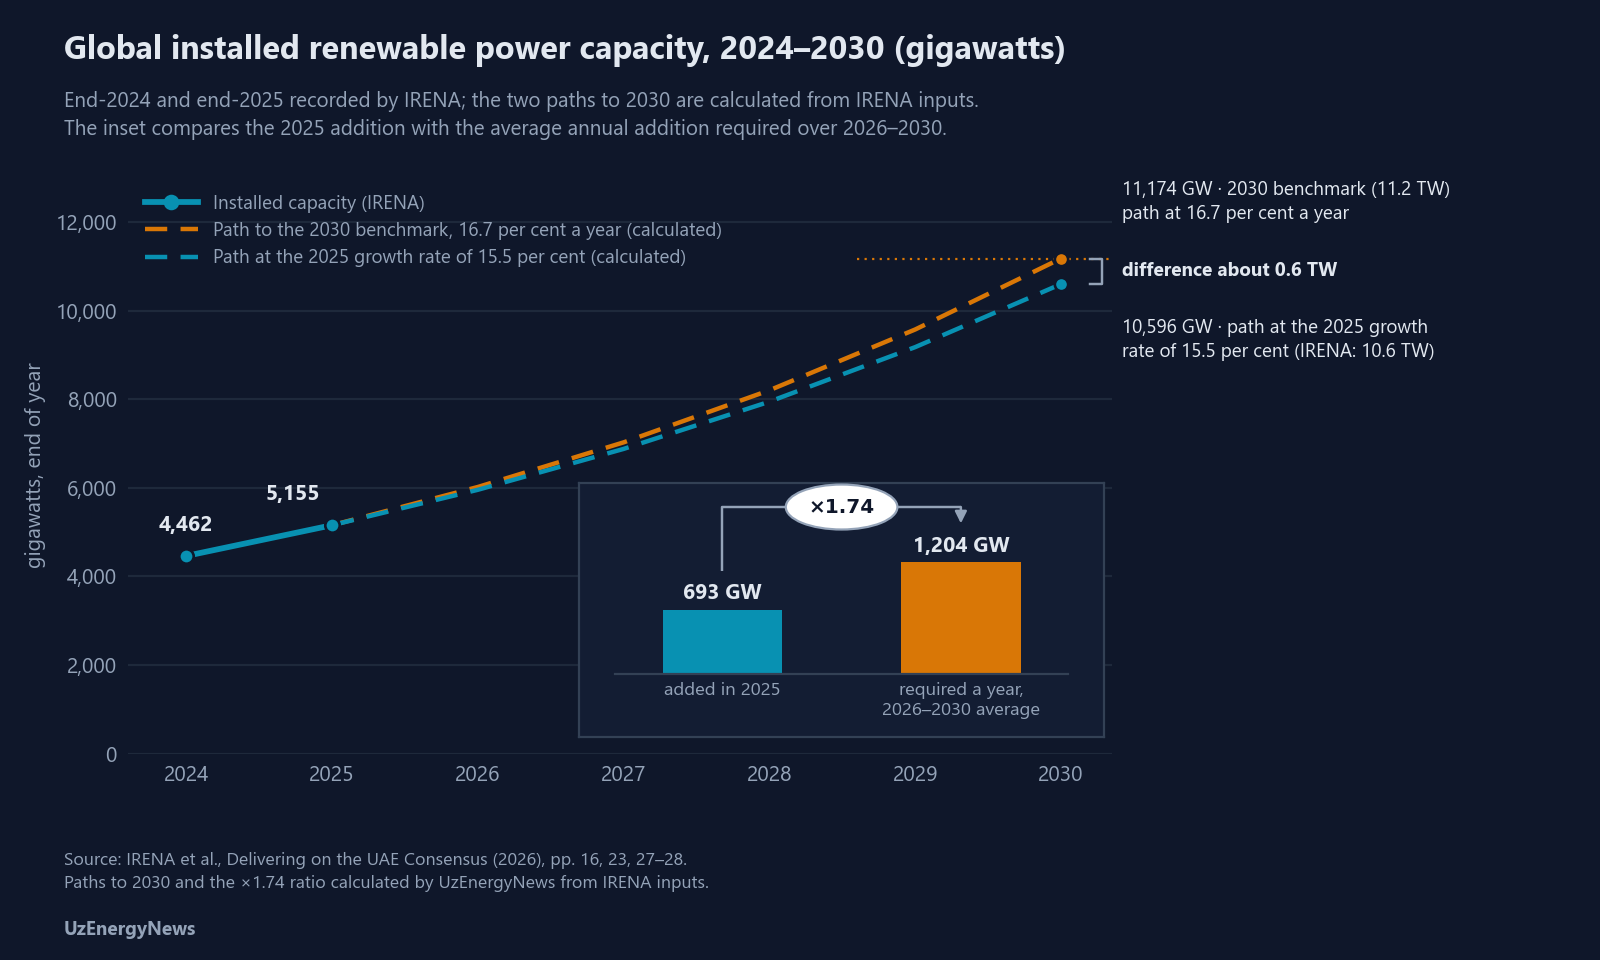
Installed renewable power capacity reached 5.15 terawatts (TW) at the end of 2025, equal to 5,155 gigawatts (GW); 1 TW equals 1,000 GW (IRENA, pp. 23, 27). Additions in 2025 were 693 GW. The growth rate was just over 15.5 per cent, against 15.1 per cent in 2024 (IRENA, p. 23). The GRA foreword in the same report states the 2025 addition as 692 GW (IRENA, p. 13); this edition uses the 693 GW of the main text.
The 2025 additions by technology were (IRENA, pp. 25–26):
solar photovoltaics: 513 GW, about three quarters of the total;
wind: 158 GW, of which 150 GW onshore;
hydropower, excluding pumped storage: 18.3 GW;
bioenergy, geothermal, concentrated solar power and marine energy together: about 4 GW, of which 72 per cent was bioenergy.
Variable renewables accounted for 96.9 per cent of net renewable additions in 2025 (IRENA, p. 25).
The 2030 benchmark is 11,174 GW, rounded to 11.2 TW. IRENA derived it from the analysis in its World Energy Transitions Outlook, which formed the statistical basis of the COP28 goal. IRENA retains the benchmark for continuity across the series (IRENA, p. 25).
Reaching the benchmark requires 6.02 TW of additions over 2026–2030. That is an average of about 1.2 TW a year and a compound annual growth rate of 16.7 per cent, against 16.6 per cent in the 2025 edition (IRENA, p. 23). The key findings and IRENA Figure 2 give the annual average as 1,204 GW (IRENA, pp. 16, 27). The required annual average is 1.74 times the 2025 addition (calculation).
If the 2025 growth rate of 15.5 per cent were maintained, capacity would reach 10.6 TW at the end of 2030, a shortfall of about 0.6 TW (IRENA, p. 23). IRENA compares this shortfall with North America's 2025 year-end renewable capacity of 612 GW (IRENA, p. 24). The shortfall stated in the series was:
1.49 TW in the 2024 edition (as cited in IRENA, p. 13);
0.9 TW in the 2025 edition (as cited in IRENA, p. 23);
0.6 TW in the 2026 edition (IRENA, p. 23).
By technology, the average annual additions required over 2026–2030 are 614 GW for solar photovoltaics (IRENA Figure 2 label, p. 27), 449 GW for wind and 34 GW for hydropower (IRENA, p. 26). If the benchmark is reached, variable renewables would account for about 62 per cent of total installed power capacity in 2030 (about 42 per cent solar and 20 per cent wind). The 2025 share is about 35 per cent (IRENA, p. 23).
Installed renewable power capacity by technology (gigawatts)
Technology
End-2024
End-2025
2030 benchmark
Solar photovoltaics
1,876
2,388
5,457
Onshore wind
1,050
1,200
3,040
Offshore wind
83
91
494
Hydropower (excluding pumped storage)
1,278
1,296
1,465
Bioenergy
153
155
343
Concentrated solar power
7
8
197
Geothermal
15
16
105
Marine
0.5
0.5
72
Total
4,462
5,155
11,174
Source: IRENA, Figure 3, p. 28. The text on pages 25–26 also states the 2025 values for solar photovoltaics, hydropower, bioenergy, geothermal and concentrated solar power, and the 2025 wind total of 1,291 GW. Rows do not sum exactly to the totals because of rounding in the source.
IRENA reports that commissioning in China was brought forward ahead of a pricing reform that took effect in June 2025. Nearly 93 GW of solar was installed in May 2025 alone (IRENA, p. 57). Against that base, Chinese solar additions in the first half of 2026 were 66 per cent lower year on year and wind additions about 25 per cent lower (Reuters report cited in IRENA, p. 57). The IRENA Director-General's foreword refers to "indications of a potential slowdown in capacity expansion" (IRENA, p. 7). As of 1 October 2026, full-year 2026 capacity statistics had not been published.
In 2025, 90 per cent of newly commissioned utility-scale renewable capacity produced electricity at a lower cost than the cheapest newly installed fossil fuel alternative. Global weighted-average levelised costs of electricity were 33 dollars a megawatt-hour for onshore wind, 44 dollars for solar photovoltaics and 78 dollars for offshore wind. Excluding China, the values for solar photovoltaics and onshore wind were 55 and 51 dollars a megawatt-hour (IRENA, p. 32). Battery storage additions reached 112 GW and 307 gigawatt-hours in 2025, 48 per cent more in power terms than in 2024 (BloombergNEF data cited in IRENA, p. 46).
Investment values in the two reports: scope, year and price basis
Values in the text of this section are in United States dollars at 2025 prices unless stated otherwise; 1 trillion equals 1,000 billion. The table of values carried in earlier editions states the price basis of each row in a separate column.
Renewable power and energy efficiency. Investment in renewable power generation capacity was 625 billion dollars in 2025, against 641 billion dollars in 2024. Solar photovoltaics accounted for 417 billion dollars, wind for 155 billion, hydropower for 37 billion and bioenergy for 12 billion (IRENA, pp. 45, 47). IRENA calculates this investment as annual capacity additions multiplied by the global weighted-average installed cost of each technology (IRENA, p. 45).
IRENA puts the renewable requirement at 8.6 trillion dollars over 2026–2030, an average of about 1.7 trillion dollars (1,725 billion) a year (IRENA, pp. 45, 47). By technology, IRENA states that annual investment in wind and hydropower must scale up to five and four times the 2025 levels respectively, and investment in bioenergy tenfold (IRENA, p. 45). Investment in energy efficiency and conservation was 369 billion dollars in 2025 (IRENA, pp. 46–47; page 16 of the same report gives 362 billion dollars), against a requirement of 3.2 trillion dollars (3,182 billion) a year over 2026–2030 (IRENA, pp. 46–47).
Across renewable power, energy efficiency, and grids and flexibility, IRENA records 1,518 billion dollars in 2025 against a required 5,782 to 5,889 billion dollars a year (IRENA, p. 47); the component values shown in the source differ from these totals by 1 billion dollars because of rounding (calculation). Total energy investment was 3.3 trillion dollars in 2025 (IRENA, p. 46, citing the IEA's World Energy Investment 2026). In the IEA report, investment in electricity supply and grids is set to reach 1.6 trillion dollars in 2026. Including end-use electrification the total is 2 trillion dollars, about 60 per cent of total global energy investment in 2026 (IEA, p. 34).
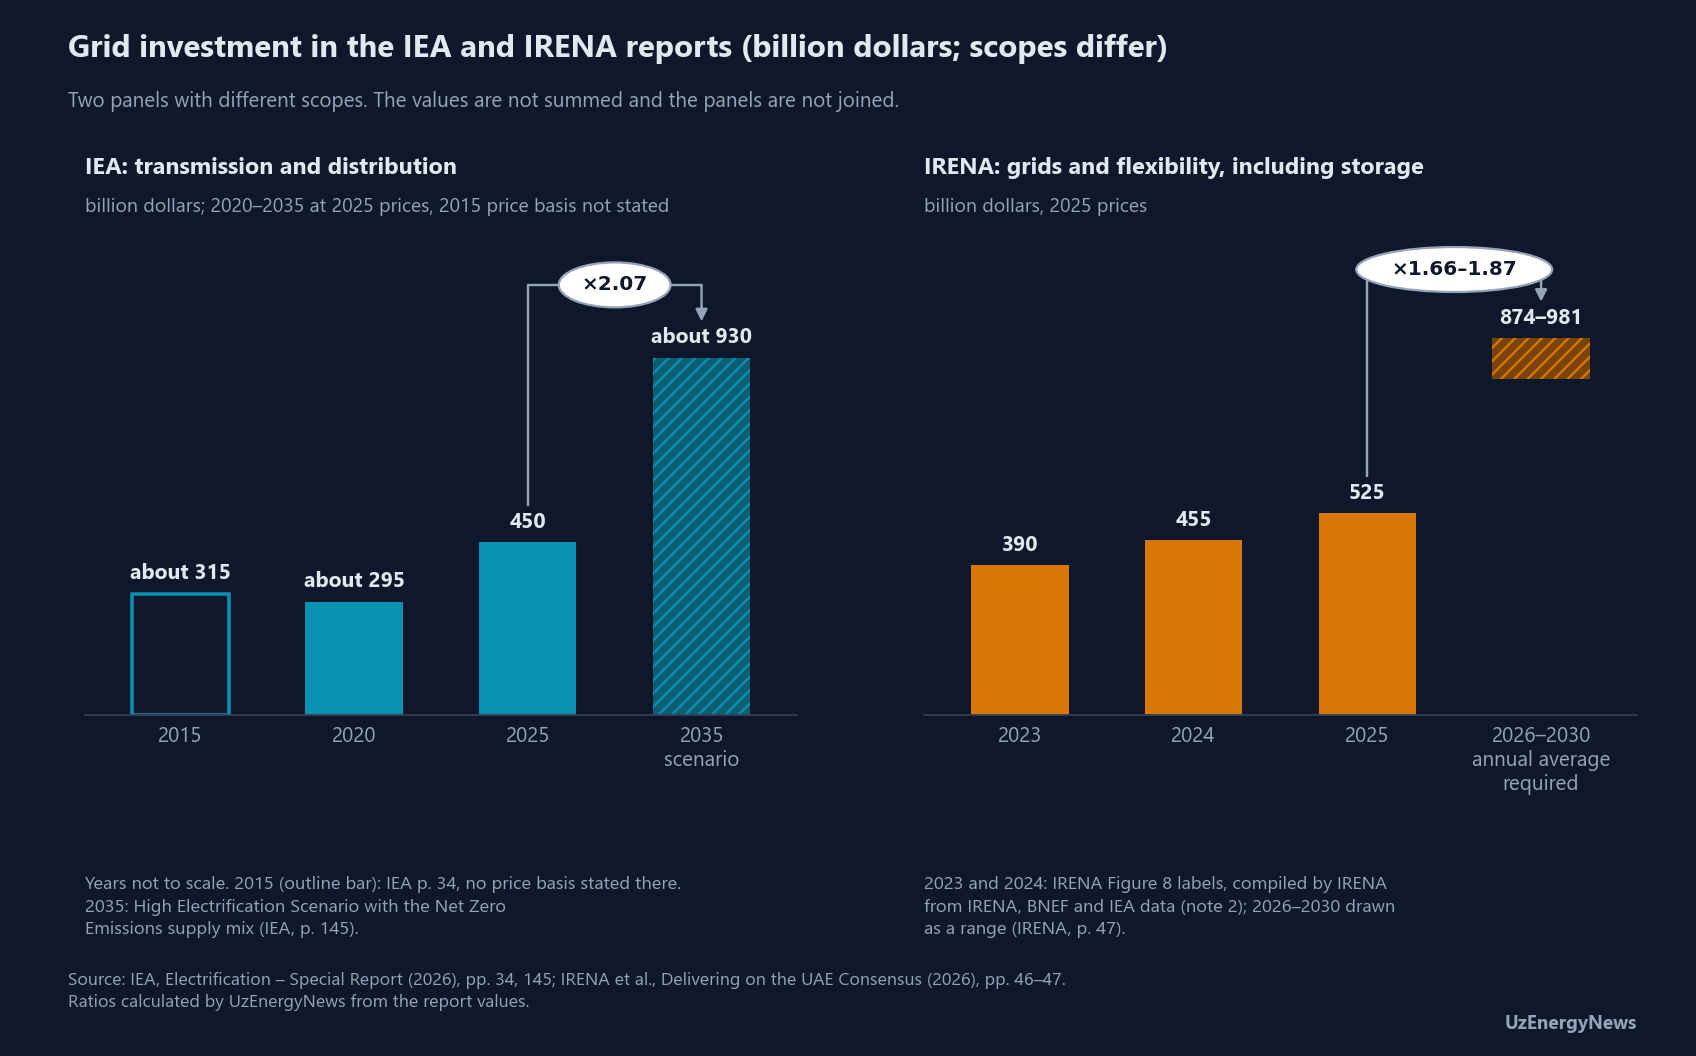
Grids in the IEA report. Investment in transmission and distribution networks was about 315 billion dollars in 2015 (IEA, p. 34, where no price basis is stated for this value), about 295 billion dollars in 2020 and 450 billion dollars in 2025. It reaches about 930 billion dollars in 2035 in the High Electrification Scenario with the Net Zero Emissions supply mix (IEA, p. 145). The 2035 value is 2.07 times the 2025 level, equivalent to about 7.5 per cent a year over 2025–2035 (calculation). In the IEA's words, "nearly two-thirds of investment in grids is in distribution networks" (IEA, p. 59). The IEA gives global network length as more than 85 million kilometres, of which about 80 million kilometres is distribution, without stating a year (IEA, p. 115). It reaches about 115 million kilometres in 2035 in the same scenario (IEA, pp. 115–116).
Grids and flexibility in the IRENA report. IRENA records 525 billion dollars of investment in grids and flexibility in 2025 (IRENA, p. 46). The total has two components, and the IRENA report cites the IEA's World Energy Investment 2026 for both:
422 billion dollars for grid infrastructure, 12 per cent more than in 2024 (IRENA, p. 46, citing World Energy Investment 2026);
103 billion dollars for energy storage including pumped hydropower, 33 per cent more than in 2024 (IRENA, p. 46, citing World Energy Investment 2026).
IRENA Figure 8 labels give the grids-and-flexibility total as 390 billion dollars in 2023 and 455 billion dollars in 2024; note 2 of the figure states that the recent-year values are compiled from IRENA, BloombergNEF and IEA data (IRENA, p. 47).
For 2026–2030 IRENA states a requirement of "up to USD 1 trillion" a year on average. It consists of about 800 billion dollars for grids and up to 200 billion dollars for storage (IRENA, p. 46). IRENA Figure 8 gives the range as 874 to 981 billion dollars a year (IRENA, p. 47). That range is 1.66 to 1.87 times the 2025 value of 525 billion dollars (calculation). The IRENA report also gives about 902 billion dollars a year of grid investment to 2030 under IRENA's revised 1.5°C Scenario, citing IRENA's May 2026 report Transitioning away from fossil fuels (IRENA, p. 64, where no price basis is stated for this value). The watch points below record the source of this value.
The 2025 value used in this edition. The IRENA report carries two values for 2025 network investment:
422 billion dollars for grid infrastructure (IRENA, p. 46, citing World Energy Investment 2026);
"around USD 450 billion" for transmission and distribution (IRENA, p. 64, citing BloombergNEF and the IEA).
The IEA Electrification report gives 450 billion dollars (IEA, p. 145). The IEA's World Energy Investment 2026 states that grid spending "rose USD 45 billion in 2025 to nearly USD 450 billion", in 2025 dollars (World Energy Investment 2026, p. 96). This edition uses 450 billion dollars, the value that appears in the IEA report, on page 64 of the IRENA report and in World Energy Investment 2026. The 422 billion dollars is stated as the grid component of IRENA's 525 billion dollar grids-and-flexibility total. Battery storage investment is 80 billion dollars in the IEA report (IEA, p. 145). The IRENA report gives 103 billion dollars for storage including pumped hydropower (IRENA, p. 46). The two values have different stated scopes; the watch points below record the source of the 103 billion dollar value.
Values carried in earlier editions of this publication. Weekly Insights #9 and #17 carried grid values from earlier releases. Each row below is a separate measurement from a separate publication, year, scope or scenario.
Publication and date (where stated)
Year or period
Scope
Value (billion dollars)
Price basis
Carried in
IEA, World Energy Investment 2025
2024–2025
global grid investment
about 400
publication's own basis; not converted
Weekly Insight #9 (27 June 2026)
IEA, as cited in #9 (publication not named in #9)
2030 requirement
global grid investment
more than 600
publication's own basis; not converted
#9
IEA, Electricity 2026 (February 2026), as cited in #17
year not stated in the source (Electricity 2026, pp. 10, 46)
global grid investment
about 400
publication's own basis; not converted
Weekly Insight #17 (4 September 2026)
IEA, Electricity 2026 (February 2026), as cited in #17
2030 requirement
global grid investment
about 600 (calculation: roughly 50 per cent above about 400; Electricity 2026, pp. 10, 46)
publication's own basis; not converted
#17
IEA, World Energy Investment 2026 (May 2026)
2026
global grid investment (transmission and distribution)
about 550
USD 2025, MER
#17
IRENA, "Funding Grid and Storage Enhancement: The Call for Stronger Public-Private Collaboration" (8 January 2026)
a year until 2030, IRENA 1.5°C Scenario
grid investment requirement
671
publication's own basis; not converted
#17
IEA, Electrification (22 September 2026)
2025
global grid investment (transmission and distribution)
450
USD 2025, MER
this edition
IEA, Electrification (22 September 2026)
2035, High Electrification Scenario, Net Zero Emissions supply mix
global grid investment (transmission and distribution)
about 930
USD 2025, MER
this edition
IRENA tracking report (2026 edition)
2025
grids and flexibility, including storage
525 (422 grids, 103 storage)
USD 2025
this edition
IRENA tracking report (2026 edition)
2026–2030 annual average, tripling calculation
grids and flexibility, including storage
874–981 (p. 47); p. 46 gives up to 1,000, of which about 800 grids and up to 200 storage
USD 2025
this edition
IRENA tracking report (2026 edition), p. 64, citing IRENA's Transitioning away from fossil fuels (May 2026)
a year to 2030, revised 1.5°C Scenario
grids
about 902
not stated on p. 64; not converted
this edition
Sources: IEA, Electrification, pp. 145–146; IRENA tracking report, pp. 46–47, 64; IEA, World Energy Investment 2026, pp. 9, 95; IEA, Electricity 2026, pp. 10, 46; IRENA article of 8 January 2026; earlier values as carried in Weekly Insights #9 and #17. "USD 2025, MER" is the unit stated in the IEA charts (World Energy Investment 2026, p. 95; Electrification, p. 146); "USD 2025" is stated in IRENA Figure 8, note 1 (p. 47). "Publication's own basis; not converted" marks rows whose price basis was not verified; those values are not converted to 2025 prices.
Connection queues, curtailment and negative-price hours
About 2,500 GW of renewable, storage and large-load projects at advanced stages are waiting in grid connection queues (IRENA, p. 64, citing the IEA's Electricity 2026). Weekly Insight #17 of 4 September 2026 carried a value of more than 2,500 GW from the same IEA source. Weekly Insight #9 of 27 June 2026 carried about 1,500 GW for advanced renewable projects alone; the two values cover different sets of projects.
The IEA Electrification report gives the additional hosting capacity from two groups of measures, citing the IEA's Electricity 2026 (IEA, p. 119):
grid-enhancing technologies: 450 to 700 GW;
flexible connection arrangements: 750 to 900 GW.
The IRENA report states that the two groups of measures together could connect 1,200 to 1,600 GW of advanced-stage projects (IRENA, p. 65, citing the IEA's Electricity 2026).
Curtailment and price readings:
Germany, France and the Netherlands together curtailed 3.9 TWh of renewable output in 2025, 21 per cent more than in 2024 (Montel Analytics data cited in IRENA, p. 63).
China: national average curtailment was 5.7 per cent for wind and 5.2 per cent for solar in 2025, against 2.7 and 2.0 per cent in 2023 (National Energy Administration data cited in IRENA, p. 63).
Germany: 301 hours of negative wholesale prices in 2023, 457 in 2024 and 573 in 2025 (Bundesnetzagentur data cited in IRENA, p. 66).
More than 60 markets: the average number of negative-price hours rose from 110 in 2019 to more than 450 in 2025 (IEA, p. 58).
Under IRENA's revised 1.5°C Scenario, power system flexibility requirements increase over 2023–2030 by 2.8 times for daily, 2.6 times for weekly and 2.3 times for monthly balancing (IRENA, p. 65).
Oil displacement, import bills and emissions: IEA and IRENA values
The IEA press release of 22 September 2026 is titled "Electrification takes centre stage as Hormuz shock spurs countries to seek to enhance energy security". The IEA report counts 25 countries that have announced new electrification-related policies since February 2026 (IEA, p. 15). Page 36 of the same report dates the start of this count to March.
The IEA gives the oil demand avoided by electric cars, motorcycles, trucks and buses as about 2.3 million barrels a day, without stating a year (IEA, pp. 17, 34). The IEA puts the displacement by electric vehicles in 2035 at about 10 million barrels a day under "today's policy settings" and at 18 million barrels a day in the High Electrification Scenario (IEA, p. 17).
In the High Electrification Scenario, the import bill of energy importers is about one quarter lower in 2035 than in 2025. The reduction is about 400 billion dollars a year, or more than 500 billion dollars when assessed against the higher energy prices of 2026 (IEA, p. 17). End-use emissions fall by about 40 per cent by 2035 in the same scenario. About 5 gigatonnes of carbon dioxide of the reduction comes from electrification and about 3 gigatonnes from other measures (IEA, pp. 18, 156).
In the IRENA report, renewables avoided 480 billion dollars of fossil fuel costs and 8.4 gigatonnes of carbon dioxide emissions in 2025 (IRENA, p. 34). The GRA foreword refers to the constraint on oil and gas supplies caused by the military confrontation in the Strait of Hormuz (IRENA, p. 13). Weekly Insight #19 of 18 September 2026 recorded liquefied natural gas transits through the Strait of Hormuz and European Union storage levels.
Recorded and required values for seven indicators
Indicator
Recorded
Required or scenario value
Ratio (calculation)
Source
Electricity share of final energy consumption, change a year
0.24 points a year, 2000–2025 (calculation)
1.2 points a year, 2025–2035, to reach 35 per cent (calculation)
5.0
IEA, pp. 15, 16, 31, 46
Renewable capacity additions
693 GW in 2025
1,204 GW a year on average, 2026–2030
1.74
IRENA, pp. 16, 23, 27
Energy intensity improvement
1.7 per cent in 2025
5.6 per cent a year, 2026–2030
3.3
IRENA, pp. 16, 38
Transmission and distribution investment
450 billion dollars in 2025
about 930 billion dollars in 2035 (High Electrification Scenario, Net Zero Emissions supply mix)
2.07
IEA, p. 145
Grids and flexibility investment
525 billion dollars in 2025
874–981 billion dollars a year on average, 2026–2030
1.66–1.87
IRENA, pp. 46–47
Renewable power investment
625 billion dollars in 2025
1,725 billion dollars a year on average, 2026–2030
2.76
IRENA, pp. 45, 47
Energy efficiency and conservation investment
369 billion dollars in 2025
3,182 billion dollars a year on average, 2026–2030
8.6
IRENA, pp. 46–47
Investment values in 2025 dollars. Ratios are calculated in this edition from the report values shown. The points-a-year values in the first row are calculated from the rounded IEA report values of 17, 23 and 35 per cent; with the IEA Figure 1.5 readings for 2000 and 2025 (about 16.7 and 23.4 per cent) the two rates are about 0.27 and 1.16 points a year and the ratio is about 4.3 (calculation).
Watch points: items not measured or not reconciled
Item
Status
Status of the 35 per cent objective
Stated in both reports as the COP31 Presidency's proposal and invitation; the IEA report describes it as a "goal, currently under international discussion" (p. 16). Neither report records an adopted decision of the Conference of the Parties; adoption is a matter for COP31, 9–20 November 2026 (IRENA, p. 3).
2024 electrification rate: about 23.0 or 24 per cent
The reading of IEA Figure 1.5 for 2024 is about 23.0 per cent (IEA, p. 31). IRENA Figure 7 gives 24 per cent, calculated from IEA World Energy Statistics and Balances (IRENA, p. 40, note 3). Neither report explains the difference. For 2025 the IEA Figure 1.5 reading is about 23.4 per cent and the report text gives 23 per cent (IEA, pp. 16, 31). The statement in this edition that the two sets of values rest on different base years applies to the sector values only.
2025 grid investment: 422 or 450 billion dollars
The IRENA report carries 422 billion dollars for grid infrastructure, citing World Energy Investment 2026 (p. 46), and about 450 billion dollars for transmission and distribution (p. 64); the IEA Electrification report carries 450 billion dollars (p. 145). World Energy Investment 2026 gives "nearly USD 450 billion" for 2025 and a further 17 per cent increase in 2026 (p. 96), and "around USD 550 billion in 2026, up nearly 20%" (p. 9); its values are in 2025 dollars at market exchange rates. Applied to 450 billion dollars, the 17 per cent rate gives about 527 billion dollars for 2026 (calculation). The 422 billion dollar value was not located in the text of World Energy Investment 2026.
2025 storage investment: 103 billion dollars
The IRENA report gives 103 billion dollars for energy storage including pumped hydropower and cites World Energy Investment 2026 (p. 46). The value was not located in the text of World Energy Investment 2026, which counts pumped hydro storage under renewable power and not under battery storage (World Energy Investment 2026, p. 67). The IEA Electrification report gives 80 billion dollars for battery storage in 2025 (p. 145). Neither the 422 nor the 103 billion dollar component of the 525 billion dollar total was located in the text of World Energy Investment 2026.
Source of the 902 billion dollar grid value
Stated on page 64 of the IRENA report with a citation to IRENA's May 2026 report Transitioning away from fossil fuels. The value was not located in the text of that report, which gives grid investment of about 1 trillion dollars a year over 2026–2035 (Table 1, p. 27) and 5.5 trillion dollars for power grids and energy flexibility over 2026–2030 (p. 26).
Two IRENA 1.5°C grid values: 671 and 902 billion dollars
Weekly Insight #17 carried 671 billion dollars a year, which an IRENA article of 8 January 2026 gives as the annual grid investment need until 2030 under IRENA's 1.5°C Scenario. The IRENA tracking report gives about 902 billion dollars a year to 2030 under IRENA's revised 1.5°C Scenario (p. 64) and states that the revised scenario will feature in the forthcoming World Energy Transitions Outlook 2026 (p. 25). The sources consulted do not reconcile the two values.
Timing of the IEA 33 per cent value
The IEA report places the cost-effective share "today" (pp. 15, 53) and "in 2035" (p. 51); the IEA press release uses "by 2035". This edition states the value at 2025 conditions, the basis given on page 51.
2035 share under "today's policy settings"
"Around 30%" (IEA, p. 20) and "slightly less than 30%" (IEA, p. 48). Neither page names a scenario. Page 51 names the Stated Policies Scenario for the demand growth value of about 925 TWh a year, and IEA Figure 2.1 on page 49 is labelled "STEPS and HES" (HES: High Electrification Scenario). The 2035 share is stated here as about 30 per cent in scenarios based on "today's policy settings".
Start of the count of 25 countries
"Since February 2026" (IEA, p. 15) and "Since March, around 25 countries" (IEA, p. 36).
2025 solar and wind additions
The IEA report gives about 600 GW of solar and about 140 GW of wind on page 35, and about 630 GW and about 160 GW on page 100. IRENA gives 513 GW and 158 GW (pp. 25–26). IRENA states on page 26 that its data cover plants in commercial operation on 31 December, compiled mainly from official member submissions. Capacity values in this edition are taken from IRENA only.
Values taken from figures
Values from IEA Figure 1.5 (2000–2025 shares) and IEA Figure 2.1 on page 49 are read from the charts and are approximate. Values from IRENA Figures 1, 2, 3, 6, 7 and 8 are chart labels. IRENA calculates the recent-year values in Figure 7 from IEA World Energy Statistics and Balances (p. 40, note 3) and compiles the recent-year values in Figure 8 from IRENA, BloombergNEF and IEA data (p. 47, note 2). The 2024 capacity values match the 2025 values less the 2025 additions to within about 1 GW. The 2024 grids-and-flexibility value of 455 billion dollars is within about 1 billion dollars of the 2025 components discounted by their stated growth rates of 12 and 33 per cent (calculation).
2025 energy efficiency investment: 362 or 369 billion dollars
The IRENA report gives 362 billion dollars on page 16 and 369 billion dollars on pages 46–47; 369 billion dollars is used here.
2025 energy intensity improvement in IRENA's press release
IRENA's launch press release states that energy intensity "improved by around 2% in 2025". The report gives 1.7 per cent (pp. 16, 38); 1.7 per cent is used here.
"More than double" in IRENA's press release
The launch press release gives "nearly USD 1 trillion annually between 2026-2030, more than double 2025 levels". The report gives "up to USD 1 trillion" a year for grids and flexibility (p. 46) and a range of 874–981 billion dollars (p. 47). Against the 525 billion dollar grids-and-flexibility total for 2025, 1 trillion dollars is 1.90 times and the range is 1.66 to 1.87 times (calculation). The grids-only requirement of about 800 billion dollars is 1.90 times the 422 billion dollar grid component (calculation).
Investment requirement across IRENA editions
IRENA's press release of 11 October 2024 on the 2024 edition gives 1.5 trillion dollars a year over 2024–2030 for renewable capacity. IRENA's press release of 14 October 2025 on the 2025 edition gives at least 1.4 trillion dollars a year over 2025–2030 for renewables. The 2026 edition gives 1.7 trillion dollars a year over 2026–2030 for renewable power generation capacity, in 2025 dollars (pp. 45, 47). The price bases of the earlier values were not verified, so the three values are not compared here.
China, full year 2026
The IRENA report publishes only first-half 2026 changes (p. 57). As of 1 October 2026, full-year statistics had not been published.
Sources.
International Energy Agency, Electrification – Special Report (22 September 2026, CC BY 4.0), and IEA press release of 22 September 2026.
International Renewable Energy Agency, COP31 Presidency and Global Renewables Alliance, Delivering on the UAE Consensus: Tracking progress toward tripling renewable energy capacity and doubling energy efficiency by 2030 (2026 edition, ISBN 978-92-9260-750-0). This includes:
data cited in that report from the IEA's World Energy Investment 2026 and Electricity 2026, BloombergNEF, Montel Analytics, China's National Energy Administration, Germany's Bundesnetzagentur, the NDC Registry of the United Nations Framework Convention on Climate Change and a Reuters report of 22 July 2026;
the text of the Outcome of the First Global Stocktake (United Nations Framework Convention on Climate Change, 2023), reproduced on page 2.
IRENA press release "Renewables Gain Ground, but Must Accelerate Towards the 2030 Goal" and IRENA's announcement of the release on X (21 September 2026).
International Energy Agency, World Energy Investment 2026 (28 May 2026; revised version, June 2026), pp. 9, 67, 95, 96; International Renewable Energy Agency, Transitioning away from fossil fuels (May 2026), pp. 26–27. Both were consulted for values cited in the IRENA tracking report.
International Energy Agency, Electricity 2026 (February 2026), pp. 10, 46, consulted for the value carried in Weekly Insight #17.
IRENA press releases "Global Goal of Tripling Renewables Needs USD 1.5 Trillion Investment Per Year" (11 October 2024) and "World Breaks Renewable Records but Must Move Faster to Hit 2030 Tripling Goal" (14 October 2025); IRENA article "Funding Grid and Storage Enhancement: The Call for Stronger Public-Private Collaboration" (8 January 2026).
This publication's Weekly Insights #9 (27 June 2026), #13 (30 July 2026), #17 (4 September 2026) and #19 (18 September 2026).
Quotations are limited to short excerpts with page references. Analysis by UzEnergyNews.
2025'te %23, 2035 için önerilen %35: COP31 öncesinde IEA elektrifikasyon ölçümleri, IRENA'nın üçe katlama ve verimlilik takibi, iki rapordaki şebeke yatırımı değerleri
1 Ekim 2026 · 18 dk okuma · UzEnergyNews · Enerji ve Piyasa İstihbaratı
Uluslararası Enerji Ajansı (IEA), elektriğin küresel nihai enerji tüketimindeki payını 2000'de %17, 2025'te %23 olarak ölçmektedir. IEA, 2035 için bu payı yürürlükteki politika ayarlarına dayanan senaryolarda yaklaşık %30, Yüksek Elektrifikasyon Senaryosu kapsamında %35 olarak vermektedir (IEA, Electrification – Special Report, 22.09.2026). Birleşmiş Milletler İklim Değişikliği Çerçeve Sözleşmesi 31. Taraflar Konferansı (COP31) Başkanlığı, 2035'e kadar %35'lik payı küresel hedef olarak önermektedir. Konferans 9-20 Kasım 2026 tarihlerinde Antalya'da toplanacaktır. Uluslararası Yenilenebilir Enerji Ajansı (IRENA), yıllık izleme raporunun üçüncü sayısını COP31 Başkanlığı ve Global Renewables Alliance ile birlikte 21.09.2026'da yayımlamıştır. Rapor, 2025 sonunda 5,15 teravat (TW) yenilenebilir kurulu güç ve aynı yıl içinde 693 gigavat (GW) ilave kaydetmektedir. 2030 ölçüt değeri 11,2 TW'tır; IRENA, bu değere ulaşmak için 2026-2030 döneminde gereken ilaveyi yılda yaklaşık 1,2 TW olarak hesaplamaktadır. Enerji yoğunluğu 2025'te %1,7 iyileşmiştir; IRENA, 2026-2030 dönemi için gereken hızı yılda %5,6 olarak hesaplamaktadır. Bu sayıda iki ölçüm serisi, her hedefin gerektirdiği hız ile kaydedilen hız ve iki rapordaki şebeke yatırımı değerleri kapsam ve fiyat bazıyla birlikte verilmektedir.
Yayın künyesi ve %35 önerisinin statüsü
IEA, Electrification – Special Report başlıklı raporu 22.09.2026'da yayımlamıştır. Rapor 198 sayfadır ve Creative Commons CC BY 4.0 lisansıyla yayımlanmıştır. Rapor, Türkiye ve Avustralya hükûmetlerinin talebiyle hazırlanmıştır. Türkiye, COP31 Başkanlığını, Avustralya ise COP31 Müzakere Başkanlığını üstlenecektir. Rapor, COP31 Başkanlığı ile IEA arasındaki stratejik ortaklık çerçevesinde hazırlanmıştır (IEA, s. 3, 15, 25). Raporun üç önsözü IEA İcra Direktörü, COP31 Dönem Başkanı adayı ve COP31 Müzakere Başkanı tarafından imzalanmıştır. IEA raporuna yapılan sayfa atıfları aşağıda "IEA, s." biçiminde verilmektedir.
IRENA, yıllık izleme serisinin üçüncü sayısı olan Delivering on the UAE Consensus: Tracking progress toward tripling renewable energy capacity and doubling energy efficiency by 2030 başlıklı raporu (ISBN 978-92-9260-750-0) COP31 Başkanlığı ve Global Renewables Alliance (GRA) ile birlikte yayımlamıştır. IRENA, 2024 başında Birleşik Arap Emirlikleri Mutabakatı (UAE Consensus) hedeflerinden ikisinin izlenmesinden sorumlu kuruluş olarak belirlenmiştir (IRENA, s. 2). IRENA, raporun yayımlandığını 21.09.2026'da resmî X hesabından duyurmuştur; IRENA'nın lansman basın bülteni yayını Climate Week NYC dönemine yerleştirmektedir. IRENA raporuna yapılan sayfa atıfları aşağıda "IRENA, s." biçiminde verilmektedir. COP31, 9-20 Kasım 2026 tarihlerinde Antalya'da toplanacaktır (IRENA, s. 3).
IRENA'nın izlediği iki hedef, Birinci Küresel Durum Değerlendirmesi sonuç metninin 28. paragrafından gelmektedir. Metin, 2023'te Dubai'de toplanan 28. Taraflar Konferansında (COP28) 198 Tarafça kabul edilmiştir. Paragraf, Tarafları "(a) Tripling renewable energy capacity globally and doubling the global average annual rate of energy efficiency improvements by 2030" (2030'a kadar küresel yenilenebilir enerji kapasitesinin üç katına, enerji verimliliği iyileşmesinin küresel ortalama yıllık hızının iki katına çıkarılması) hedefine katkıya çağırmaktadır (IRENA, s. 2).
%35'lik elektrifikasyon değeri iki raporda da COP31 Başkanlığının önerisi olarak yer almaktadır:
IRENA raporu (s. 9). COP31 Dönem Başkanı adayı, Başkanlığın küresel elektrifikasyon hedefini "to increase the share of electricity in global final energy consumption to 35% by 2035" (2035'e kadar elektriğin küresel nihai enerji tüketimindeki payını %35'e çıkarmak) biçiminde ilerleteceğini yazmaktadır. Önsöz, "a global invitation for all actors to align behind this target" (tüm aktörlere bu hedefin arkasında birleşmeleri için küresel bir davet) ifadesiyle çağrıda bulunmaktadır.
IEA raporu (s. 5). COP31 Dönem Başkanı adayı "35-by-35 target" (2035'e kadar %35 hedefi) ifadesini kullanmakta ve "Antalya will be the moment we commit to it together" (Antalya, bu hedefe birlikte bağlanacağımız an olacaktır) diye yazmaktadır.
IRENA raporu (s. 11). Avustralya İklim Değişikliği ve Enerji Bakanı, COP31 Müzakere Başkanı sıfatıyla, Avustralya'nın Türkiye ile birlikte "to make COP31 an 'Electrification COP'" (COP31'i bir "Elektrifikasyon COP'u" yapmak) amacıyla çalıştığını yazmaktadır.
IEA raporu %35 düzeyini "goal, currently under international discussion" (uluslararası düzeyde görüşülmekte olan hedef) olarak nitelemektedir (IEA, s. 16). İki rapor da %35 değerini Taraflar Konferansının kabul edilmiş bir kararı olarak kaydetmemektedir.
09.06.2026 itibarıyla 120 üçüncü nesil ulusal katkı beyanı (NDC 3.0) Birleşmiş Milletler İklim Değişikliği Çerçeve Sözleşmesine sunulmuştur (NDC Registry verisi, IRENA, s. 55'teki aktarım). Bu beyanlar küresel emisyonların %77'sini kapsamaktadır. Beyanların %67'si sayısal bir yenilenebilir enerji hedefi, %43'ü sayısal bir enerji verimliliği hedefi içermektedir (IRENA, s. 55).
IEA ölçüsü: elektriğin nihai enerji tüketimindeki payı, 2000-2035
IEA, elektrifikasyon oranını elektriğin toplam nihai enerji tüketimindeki payı olarak tanımlamaktadır (IEA, s. 28-31, 186-187):
Kimyasal hammadde gibi enerji dışı kullanımlar paydadan çıkarılmaktadır.
Geleneksel biyokütle paydaya dâhildir; IEA, bunun elektrifikasyon oranını düşürdüğünü belirtmektedir (IEA, s. 31).
Uluslararası deniz ve hava yakıtları dünya toplamında ulaştırma kalemine dâhildir.
Payda, Birleşmiş Milletler Sürdürülebilir Kalkınma Amacı göstergesi 7.2.1'in paydasıdır (IEA, s. 187).
Bu ölçüye göre elektrik, küresel nihai enerji tüketiminin 2000'de %17'sini, 2025'te %23'ünü oluşturmaktadır (IEA, s. 16, 31). Rapor metnindeki bu iki yuvarlanmış değere göre 2000-2025 döneminde ortalama artış yılda 0,24 puandır (hesap). IEA Şekil 1.5'ten okunan değerler payı 2000'de yaklaşık %16,7, 2008'de %18,3, 2018'de %20,8, 2020'de %21,9, 2025'te %23,4 olarak göstermektedir (IEA, s. 31). 2000 ve 2025 okumalarına göre ortalama artış yılda yaklaşık 0,27 puandır (hesap).
IEA raporu 2035 için üç değer vermektedir:
Yürürlükteki politika ayarlarında yaklaşık %30. Yürürlükteki politika ayarlarına dayanan senaryolarda ("today's policy settings") pay yaklaşık %30 ("around 30%") düzeyine ulaşmaktadır (IEA, s. 20). 48. sayfada aynı değer "slightly less than 30%" (%30'un biraz altında) olarak geçmektedir. Bu, 2025-2035 döneminde yılda yaklaşık 0,7 puana karşılık gelmektedir (hesap).
Yüksek Elektrifikasyon Senaryosu kapsamında %35 (IEA, s. 15, 46). Bu, 2025-2035 döneminde yılda ortalama 1,2 puan ve 2000-2025 dönemindeki yılda 0,24 puanlık ortalamanın 5 katıdır; iki hız da rapor metnindeki %17, %23 ve %35 yuvarlanmış değerlerinden hesaplanmıştır (hesap). Senaryo, IEA'nın 2050 Net Sıfır Emisyon Senaryosundan türetilmiştir (IEA, s. 16).
Maliyet-etkin elektrifikasyonun tamamında %33. Bu değer, 2025 teknoloji maliyetleri, enerji fiyatları ve finansman koşullarında tüketici açısından maliyet-etkin olan elektrifikasyonun tamamı gerçekleştiğinde oluşan paydır. Hesap sistem maliyetlerini içermemektedir (IEA, s. 51).
IEA raporu %33 değerini 15. ve 53. sayfalarda yıl belirtmeden ("today"), 51. sayfada 2035 için ("in 2035") vermektedir. Bu sayıda değer, 51. sayfadaki 2025 koşulları dayanağıyla verilmektedir. IEA, senaryolarının tahmin olmadığını ve tümünün aynı nüfus ve ekonomik büyüme varsayımlarını kullandığını belirtmektedir (IEA, s. 45).
Sektör bazında elektrik, 2025'te binalarda nihai enerji kullanımının yaklaşık %40'ını, sanayide %28'ini, ulaştırmada yaklaşık %2'sini karşılamaktadır (IEA, s. 30, 31, 88). Yüksek Elektrifikasyon Senaryosu kapsamında 2035 payları binalarda yaklaşık %56, sanayide yaklaşık %39'dur; bu iki değer, Açıklanan Politikalar Senaryosu (STEPS) ile Yüksek Elektrifikasyon Senaryosunu karşılaştıran IEA Şekil 2.1'den (s. 49) okunmuştur. Ulaştırmada 2035 payı %13'tür (IEA, s. 49).
Küresel elektrik talebi 2025'te 28.500 teravat saati (TWh) aşmıştır (IEA, s. 27). 30.07.2026 tarihli Weekly Insight #13, başlangıç düzeyi olarak 28.600 TWh değerini vermiştir; bu değer IEA'nın 23.07.2026 tarihli Electricity Mid-Year Update raporundan alınmıştır. Yıllık talep artışı 2015-2025 döneminde ortalama 750 TWh'tir. IEA bu artışı Açıklanan Politikalar Senaryosunda yılda yaklaşık 925 TWh, Yüksek Elektrifikasyon Senaryosu kapsamında yılda yaklaşık 1.400 TWh olarak vermektedir (IEA, s. 51).
IRENA raporunda elektrifikasyon payı ve enerji verimliliği hedefi
IRENA, elektrifikasyonu enerji verimliliği hedefinin bir bileşeni olarak ölçmektedir. IRENA, UAE Consensus hedefine ulaşmak için elektriğin toplam nihai enerji tüketimindeki payının 2023'teki %23'ten 2030'a kadar yaklaşık %30'a yükselmesi gerektiğini belirtmektedir (IRENA, s. 39). 40. sayfa, 2035'e kadar %35'e ulaşmak için ek hızlanma gerektiğini belirtmekte ve bu değer için IRENA'nın Mayıs 2026 tarihli Transitioning away from fossil fuels raporuna atıf yapmaktadır (IRENA, s. 40). IRENA'nın 2023 ve 2030 sektör payları şöyledir (IRENA, s. 39):
binalar: %36 ve %53;
sanayi: %27 ve %31;
ulaştırma: %1 ve %7.
IRENA Şekil 7, toplam elektrifikasyon oranını 2022 ve 2023'te %23, 2024'te %24 olarak, 2025 için "N/A" (değer yok) olarak vermektedir; şeklin 3 numaralı notu son yıl değerlerinin IEA World Energy Statistics and Balances verisinden hesaplandığını belirtmektedir (IRENA, s. 40). 2024 için IEA Şekil 1.5 okuması yaklaşık %23,0'dır (IEA, s. 31). İki rapor da yaklaşık 1 puanlık farkı açıklamamaktadır. IRENA'nın sektör değerleri 2023, IEA'nınkiler 2025 yılına aittir; IRENA 39. sayfada sektör değerleri için kaynak belirtmemektedir. İki sektör değer kümesi farklı baz yıllarına dayandığından bu sayıda ayrı verilmekte, satır satır karşılaştırılmamaktadır.
IRENA, enerji yoğunluğunu toplam birincil enerji arzının gayrisafi yurt içi hasılaya bölümü olarak ölçmektedir; hasıla 2025 satın alma gücü paritesiyle hesaplanmaktadır (IRENA, s. 38). Enerji yoğunluğu 2025'te %1,7 iyileşmiştir (IRENA, s. 16, 38). IRENA Şekil 6, iyileşme oranını 2022 için %2,0, 2023 ve 2024 için ayrı ayrı %1,1 olarak vermektedir (IRENA, s. 38). IRENA, enerji verimliliğini 2022 düzeyine göre ikiye katlama hedefini 2023-2030 döneminde yılda %4 iyileşme olarak ifade etmektedir. 2023-2025 döneminde kaydedilen hızlardan sonra 2026-2030 için gereken ortalama yılda %5,6'dır (IRENA, s. 7, 38); bu, 2025 hızının 3,3 katıdır (hesap). IRENA'nın güncellenmiş Planlanan Enerji Senaryosu 2026-2030 için yılda yaklaşık %3 vermektedir (IRENA, s. 38). IRENA Genel Direktörünün önsözü, UAE Consensus hedeflerinin dünyayı 1,5°C ile uyumlu patikada tutmaya artık yetmeyebileceğini belirtmektedir: "the UAE Consensus goals may no longer be sufficient to keep the world on 1.5°C-compatible pathway" (IRENA, s. 7).
Yenilenebilir kurulu güç: 2025 sonunda 5,15 TW, 2030 için 11,2 TW ölçüt değeri
Yenilenebilir enerji kurulu gücü 2025 sonunda 5,15 teravata (TW), yani 5.155 gigavata (GW) ulaşmıştır; 1 TW 1.000 GW'a eşittir (IRENA, s. 23, 27). 2025'teki ilave 693 GW'tır. Büyüme hızı %15,5'in biraz üzerindedir; 2024'te bu hız %15,1'dir (IRENA, s. 23). Aynı rapordaki GRA önsözü 2025 ilavesini 692 GW olarak vermektedir (IRENA, s. 13); burada ana metindeki 693 GW kullanılmaktadır.
2025 ilavesinin teknolojiye göre dağılımı şöyledir (IRENA, s. 25-26):
güneş fotovoltaik: 513 GW, toplamın yaklaşık dörtte üçü;
rüzgâr: 158 GW, bunun 150 GW'ı karada;
pompalı depolama hariç hidroelektrik: 18,3 GW;
biyoenerji, jeotermal, yoğunlaştırılmış güneş enerjisi ve deniz enerjisi birlikte: yaklaşık 4 GW, bunun %72'si biyoenerji.
Değişken yenilenebilir kaynaklar 2025'teki net yenilenebilir ilavenin %96,9'unu oluşturmaktadır (IRENA, s. 25).
2030 ölçüt değeri 11.174 GW'tır ve 11,2 TW'a yuvarlanmaktadır. IRENA bu değeri World Energy Transitions Outlook raporundaki analizden türetmiştir; bu analiz COP28 hedefinin istatistiksel dayanağını oluşturmaktadır. IRENA değeri seri boyunca süreklilik için korumaktadır (IRENA, s. 25).
IRENA, ölçüt değere ulaşmak için 2026-2030 döneminde gereken ilaveyi 6,02 TW olarak hesaplamaktadır. Bu, yılda ortalama yaklaşık 1,2 TW ve %16,7 bileşik yıllık büyüme demektir; 2025 sayısında bu oran %16,6'dır (IRENA, s. 23). Raporun temel bulgular sayfası ve IRENA Şekil 2 yıllık ortalamayı 1.204 GW olarak vermektedir (IRENA, s. 16, 27). Gereken yıllık ortalama, 2025 ilavesinin 1,74 katıdır (hesap).
2025'teki %15,5 büyüme hızı sürdürülürse kurulu güç 2030 sonunda 10,6 TW'a ulaşmakta ve yaklaşık 0,6 TW açık kalmaktadır (IRENA, s. 23). IRENA bu açığı Kuzey Amerika'nın 2025 sonundaki 612 GW yenilenebilir kurulu gücüyle karşılaştırmaktadır (IRENA, s. 24). Seride belirtilen açık şöyledir:
2024 sayısında 1,49 TW (IRENA, s. 13'teki aktarım);
2025 sayısında 0,9 TW (IRENA, s. 23'teki aktarım);
2026 sayısında 0,6 TW (IRENA, s. 23).
Teknoloji bazında 2026-2030 döneminde gereken ortalama yıllık ilave güneş fotovoltaikte 614 GW'tır (IRENA Şekil 2 etiketi, s. 27). Rüzgârda bu değer 449 GW, hidroelektrikte 34 GW'tır (IRENA, s. 26). Ölçüt değere ulaşıldığında değişken yenilenebilir kaynaklar 2030'da toplam kurulu gücün yaklaşık %62'sini (yaklaşık %42 güneş, %20 rüzgâr) oluşturmaktadır; 2025'te bu pay yaklaşık %35'tir (IRENA, s. 23).
Teknolojiye göre yenilenebilir kurulu güç (GW)
Teknoloji
2024 sonu
2025 sonu
2030 ölçüt değeri
Güneş fotovoltaik
1.876
2.388
5.457
Kara rüzgârı
1.050
1.200
3.040
Deniz rüzgârı
83
91
494
Hidroelektrik (pompalı depolama hariç)
1.278
1.296
1.465
Biyoenerji
153
155
343
Yoğunlaştırılmış güneş enerjisi
7
8
197
Jeotermal
15
16
105
Deniz enerjisi
0,5
0,5
72
Toplam
4.462
5.155
11.174
Kaynak: IRENA, Şekil 3, s. 28. Güneş fotovoltaik, hidroelektrik, biyoenerji, jeotermal ve yoğunlaştırılmış güneş enerjisinin 2025 değerleri ile 1.291 GW'lık 2025 rüzgâr toplamı 25-26. sayfalardaki metinde de yer almaktadır. Kaynaktaki yuvarlama nedeniyle satırların toplamı toplam satırıyla tam örtüşmemektedir.
IRENA, Çin'de işletmeye alma işlemlerinin Haziran 2025'te yürürlüğe giren fiyatlama reformu öncesine çekildiğini kaydetmektedir. Yalnız Mayıs 2025'te yaklaşık 93 GW güneş kurulmuştur (IRENA, s. 57). Bu taban karşısında Çin'in güneş ilavesi 2026'nın ilk yarısında yıllık bazda %66, rüzgâr ilavesi yaklaşık %25 düşmüştür (Reuters haberi, IRENA, s. 57'deki aktarım). IRENA Genel Direktörünün önsözü "indications of a potential slowdown in capacity expansion" (kapasite artışında olası bir yavaşlamaya ilişkin işaretler) ifadesini içermektedir (IRENA, s. 7). 01.10.2026 itibarıyla 2026 tam yıl kurulu güç istatistikleri yayımlanmamıştır.
2025'te işletmeye alınan şebeke ölçeğindeki yenilenebilir kapasitenin %90'ı, yeni kurulan en ucuz fosil yakıtlı seçenekten daha düşük maliyetle elektrik üretmiştir. Küresel ağırlıklı ortalama seviyelendirilmiş elektrik maliyeti megavat saat başına kara rüzgârında 33 dolar, güneş fotovoltaikte 44 dolar, deniz rüzgârında 78 dolardır. Çin hariç tutulduğunda güneş fotovoltaik ve kara rüzgârı değerleri megavat saat başına 55 ve 51 dolardır (IRENA, s. 32). Batarya depolama ilavesi 2025'te 112 GW ve 307 gigavat saate (GWh) ulaşmış, güç bazında 2024'e göre %48 artmıştır (BloombergNEF verisi, IRENA, s. 46'daki aktarım).
İki rapordaki yatırım değerleri: kapsam, yıl ve fiyat bazı
Bu bölümün metnindeki tutarlar, aksi belirtilmedikçe Amerika Birleşik Devletleri doları cinsinden ve 2025 fiyatlarıyladır; 1 trilyon 1.000 milyara eşittir. Önceki sayılarda yer alan değerler tablosu, her satırın fiyat bazını ayrı bir sütunda vermektedir.
Yenilenebilir enerji ve enerji verimliliği. Yenilenebilir enerji üretim kapasitesine yatırım 2025'te 625 milyar dolar, 2024'te 641 milyar dolardır. 2025 tutarının 417 milyar doları güneş fotovoltaik, 155 milyar doları rüzgâr, 37 milyar doları hidroelektrik, 12 milyar doları biyoenerjidir (IRENA, s. 45, 47). IRENA bu yatırımı, yıllık kapasite ilavesinin her teknolojinin küresel ağırlıklı ortalama kurulum maliyetiyle çarpımı olarak hesaplamaktadır (IRENA, s. 45).
IRENA, 2026-2030 dönemi yenilenebilir enerji ihtiyacını 8,6 trilyon dolar, yılda ortalama yaklaşık 1,7 trilyon dolar (1.725 milyar) olarak vermektedir (IRENA, s. 45, 47). IRENA, teknoloji bazında yıllık yatırımın rüzgârda 2025 düzeyinin 5, hidroelektrikte 4 katına, biyoenerjide 10 katına çıkması gerektiğini belirtmektedir (IRENA, s. 45). Enerji verimliliği ve enerji tasarrufu yatırımı 2025'te 369 milyar dolardır (IRENA, s. 46-47; aynı raporun 16. sayfası 362 milyar dolar vermektedir). 2026-2030 dönemi için hesaplanan ihtiyaç yılda 3,2 trilyon (3.182 milyar) dolardır (IRENA, s. 46-47).
IRENA, yenilenebilir enerji, enerji verimliliği ile şebeke ve esneklik kalemlerinin toplamını 2025 için 1.518 milyar dolar, ihtiyacı yılda 5.782-5.889 milyar dolar olarak kaydetmektedir (IRENA, s. 47); kaynakta gösterilen bileşen değerleri yuvarlama nedeniyle bu toplamlardan 1 milyar dolar farklıdır (hesap). Toplam enerji yatırımı 2025'te 3,3 trilyon dolardır (IRENA, s. 46; IEA World Energy Investment 2026 aktarımı). IEA raporunda elektrik arzı ve şebekelere yatırımın 2026'da 1,6 trilyon dolara, son kullanım elektrifikasyonu dâhil 2 trilyon dolara ulaşması öngörülmektedir. Bu, 2026'daki küresel toplam enerji yatırımının yaklaşık %60'ıdır (IEA, s. 34).
IEA raporunda şebekeler. İletim ve dağıtım şebekelerine yatırım 2015'te yaklaşık 315 milyar dolar (IEA, s. 34; sayfa bu değer için fiyat bazı belirtmemektedir), 2020'de yaklaşık 295 milyar dolar, 2025'te 450 milyar dolardır. Bu yatırım, Net Sıfır Emisyon üretim karmasıyla Yüksek Elektrifikasyon Senaryosu kapsamında 2035'te yaklaşık 930 milyar dolara ulaşmaktadır (IEA, s. 145). 2035 değeri 2025 düzeyinin 2,07 katıdır ve 2025-2035 döneminde yılda yaklaşık %7,5 artışa karşılık gelmektedir (hesap). IEA'ya göre şebeke yatırımının yaklaşık üçte ikisi dağıtım şebekelerine yapılmaktadır (IEA, s. 59). IEA, küresel şebeke uzunluğunu yıl belirtmeden 85 milyon kilometrenin üzerinde, bunun yaklaşık 80 milyon kilometresini dağıtım şebekesi olarak vermektedir (IEA, s. 115). Aynı senaryoda şebeke uzunluğu 2035'te yaklaşık 115 milyon kilometreye ulaşmaktadır (IEA, s. 115-116).
IRENA raporunda şebeke ve esneklik. IRENA, 2025'te şebeke ve esneklik yatırımını 525 milyar dolar olarak kaydetmektedir (IRENA, s. 46). Bu toplam iki bileşenden oluşmaktadır; IRENA raporu ikisi için de IEA World Energy Investment 2026 raporuna atıf yapmaktadır:
422 milyar dolarlık şebeke altyapısı yatırımı; 2024'e göre %12 artmıştır (IRENA, s. 46; World Energy Investment 2026 aktarımı);
pompalı hidroelektrik dâhil 103 milyar dolarlık enerji depolama yatırımı; 2024'e göre %33 artmıştır (IRENA, s. 46; World Energy Investment 2026 aktarımı).
IRENA Şekil 8 etiketleri şebeke ve esneklik toplamını 2023 için 390 milyar dolar, 2024 için 455 milyar dolar olarak vermektedir; şeklin 2 numaralı notu son yıl değerlerinin IRENA, BloombergNEF ve IEA verilerinden derlendiğini belirtmektedir (IRENA, s. 47).
IRENA, 2026-2030 dönemi için yılda ortalama en çok 1 trilyon dolarlık ("up to USD 1 trillion") bir ihtiyaç vermektedir. Bunun yaklaşık 800 milyar doları şebeke, 200 milyar dolara kadar olan kısmı depolamadır (IRENA, s. 46). IRENA Şekil 8 bu aralığı yılda 874-981 milyar dolar olarak vermektedir (IRENA, s. 47). Bu aralık, 2025'teki 525 milyar dolarlık değerin 1,66-1,87 katıdır (hesap). IRENA raporu ayrıca IRENA'nın revize 1,5°C Senaryosu için 2030'a kadar yılda yaklaşık 902 milyar dolarlık şebeke yatırımı vermekte ve bu değer için IRENA'nın Mayıs 2026 tarihli Transitioning away from fossil fuels raporuna atıf yapmaktadır (IRENA, s. 64; sayfa bu değer için fiyat bazı belirtmemektedir). Bu değerin kaynağı aşağıdaki izleme noktalarında kaydedilmiştir.
Bu sayıda kullanılan 2025 değeri. IRENA raporu 2025 şebeke yatırımı için iki değer taşımaktadır:
şebeke altyapısı için 422 milyar dolar (IRENA, s. 46; World Energy Investment 2026 aktarımı);
iletim ve dağıtım için yaklaşık 450 milyar dolar (IRENA, s. 64; BloombergNEF ve IEA aktarımı).
IEA Electrification raporu 450 milyar dolar vermektedir (IEA, s. 145). IEA'nın World Energy Investment 2026 raporu, şebeke harcamasının 2025'te 45 milyar dolar artarak yaklaşık 450 milyar dolara ("nearly USD 450 billion") ulaştığını 2025 fiyatlarıyla kaydetmektedir (World Energy Investment 2026, s. 96). Bu sayıda IEA raporunda, IRENA raporunun 64. sayfasında ve World Energy Investment 2026'da yer alan 450 milyar dolarlık değer kullanılmaktadır. 422 milyar dolar ise IRENA'nın 525 milyar dolarlık şebeke ve esneklik toplamının şebeke bileşeni olarak verilmektedir. Batarya depolama yatırımı IEA raporunda 80 milyar dolardır (IEA, s. 145). IRENA raporunda pompalı hidroelektriği de kapsayan depolama yatırımı 103 milyar dolardır (IRENA, s. 46). İki değerin belirtilen kapsamları farklıdır; 103 milyar dolarlık değerin kaynağı aşağıdaki izleme noktalarında kaydedilmiştir.
Bu yayının önceki sayılarında yer alan değerler. Weekly Insight #9 ve #17, önceki yayınlardan şebeke değerleri vermiştir. Aşağıdaki her satır ayrı bir yayın, yıl, kapsam veya senaryodan gelen ayrı bir ölçümdür.
Yayın ve tarih (belirtildiyse)
Yıl veya dönem
Kapsam
Değer (milyar dolar)
Fiyat bazı
Yer aldığı sayı
IEA, World Energy Investment 2025
2024-2025
küresel şebeke yatırımı
yaklaşık 400
yayının kendi bazı; çevrilmedi
Weekly Insight #9 (27.06.2026)
IEA (#9'daki aktarım; yayın adı #9'da belirtilmemiştir)
yaklaşık 600 (hesap: yaklaşık 400'ün kabaca %50 üzeri; Electricity 2026, s. 10, 46)
yayının kendi bazı; çevrilmedi
#17
IEA, World Energy Investment 2026 (Mayıs 2026)
2026
küresel şebeke yatırımı (iletim ve dağıtım)
yaklaşık 550
2025 doları, piyasa kuru
#17
IRENA, "Funding Grid and Storage Enhancement: The Call for Stronger Public-Private Collaboration" (08.01.2026)
2030'a kadar yıllık, IRENA 1,5°C Senaryosu
şebeke yatırımı ihtiyacı
671
yayının kendi bazı; çevrilmedi
#17
IEA, Electrification (22.09.2026)
2025
küresel şebeke yatırımı (iletim ve dağıtım)
450
2025 doları, piyasa kuru
bu sayı
IEA, Electrification (22.09.2026)
2035, Yüksek Elektrifikasyon Senaryosu, Net Sıfır Emisyon üretim karması
küresel şebeke yatırımı (iletim ve dağıtım)
yaklaşık 930
2025 doları, piyasa kuru
bu sayı
IRENA izleme raporu (2026 sayısı)
2025
şebeke ve esneklik, depolama dâhil
525 (422 şebeke, 103 depolama)
2025 doları
bu sayı
IRENA izleme raporu (2026 sayısı)
2026-2030 yıllık ortalama, üçe katlama hesabı
şebeke ve esneklik, depolama dâhil
874-981 (s. 47); s. 46 en çok 1.000 vermektedir, bunun yaklaşık 800'ü şebeke, 200'e kadar olan kısmı depolamadır
2025 doları
bu sayı
IRENA izleme raporu (2026 sayısı), s. 64; IRENA Transitioning away from fossil fuels (Mayıs 2026) atfıyla
2030'a kadar yıllık, revize 1,5°C Senaryosu
şebeke
yaklaşık 902
s. 64'te belirtilmemiştir; çevrilmedi
bu sayı
Kaynaklar: IEA, Electrification, s. 145-146; IRENA izleme raporu, s. 46-47, 64; IEA, World Energy Investment 2026, s. 9, 95; IEA, Electricity 2026, s. 10, 46; IRENA'nın 08.01.2026 tarihli makalesi; önceki değerler Weekly Insight #9 ve #17'de yer aldığı biçimiyle. "2025 doları, piyasa kuru" IEA grafiklerinde belirtilen birimdir (World Energy Investment 2026, s. 95; Electrification, s. 146); "2025 doları" IRENA Şekil 8'in 1 numaralı notunda belirtilmektedir (s. 47). "Yayının kendi bazı; çevrilmedi" ifadesi fiyat bazı teyit edilmeyen satırları göstermektedir; bu değerler 2025 fiyatlarına çevrilmemiştir.
Bağlantı kuyrukları, kısıntı ve negatif fiyatlı saatler
İleri aşamadaki yaklaşık 2.500 GW yenilenebilir enerji, depolama ve büyük yük projesi şebeke bağlantı kuyruklarında beklemektedir (IRENA, s. 64; IEA Electricity 2026 aktarımı). 04.09.2026 tarihli Weekly Insight #17 aynı IEA kaynağından 2.500 GW'ın üzerinde bir değer vermiştir. 27.06.2026 tarihli Weekly Insight #9 ise yalnız ileri aşamadaki yenilenebilir projeler için yaklaşık 1.500 GW değerini vermiştir; iki değer farklı proje kümelerini kapsamaktadır.
IEA Electrification raporu, iki önlem grubunun sağlayabileceği ek bağlantı kapasitesini IEA Electricity 2026 raporuna atıfla şöyle vermektedir (IEA, s. 119):
IRENA raporu, iki önlem grubunun birlikte ileri aşamadaki 1.200-1.600 GW projenin bağlanmasına yetecek kapasite açabileceğini belirtmektedir (IRENA, s. 65; IEA Electricity 2026 aktarımı).
Kısıntı ve fiyat okumaları şöyledir:
Almanya, Fransa ve Hollanda 2025'te birlikte 3,9 TWh yenilenebilir üretimi kısmıştır; bu değer 2024'ün %21 üzerindedir (Montel Analytics verisi, IRENA, s. 63'teki aktarım).
Çin: ulusal ortalama kısıntı oranı 2025'te rüzgârda %5,7, güneşte %5,2'dir; 2023'te bu oranlar %2,7 ve %2,0'dır (Çin Ulusal Enerji İdaresi verisi, IRENA, s. 63'teki aktarım).
Almanya: negatif toptan fiyatlı saat sayısı 2023'te 301, 2024'te 457, 2025'te 573'tür (Almanya Federal Şebeke Ajansı [Bundesnetzagentur] verisi, IRENA, s. 66'daki aktarım).
60'tan fazla piyasa: ortalama negatif fiyatlı saat sayısı 2019'da 110'dan 2025'te 450'nin üzerine çıkmıştır (IEA, s. 58).
IRENA'nın revize 1,5°C Senaryosu kapsamında elektrik sisteminin esneklik ihtiyacı 2023-2030 döneminde günlük dengelemede 2,8, haftalıkta 2,6, aylıkta 2,3 kat artmaktadır (IRENA, s. 65).
Petrol ikamesi, ithalat faturası ve emisyonlar: IEA ve IRENA değerleri
IEA'nın 22.09.2026 tarihli basın bülteninin başlığı "Electrification takes centre stage as Hormuz shock spurs countries to seek to enhance energy security" (Hürmüz şoku ülkeleri enerji güvenliğini artırmaya yöneltirken elektrifikasyon ön plana çıkıyor) şeklindedir. IEA raporu, Şubat 2026'dan bu yana elektrifikasyonla ilgili yeni politika açıklayan 25 ülke saymaktadır (IEA, s. 15). Aynı raporun 36. sayfası bu sayımın başlangıcını Mart olarak vermektedir.
IEA, elektrikli otomobil, motosiklet, kamyon ve otobüslerin ikame ettiği petrol talebini yıl belirtmeden günde yaklaşık 2,3 milyon varil olarak vermektedir (IEA, s. 17, 34). IEA, elektrikli taşıtların 2035'teki ikamesini yürürlükteki politika ayarlarında ("today's policy settings") günde yaklaşık 10 milyon varil, Yüksek Elektrifikasyon Senaryosu kapsamında günde 18 milyon varil olarak vermektedir (IEA, s. 17).
Yüksek Elektrifikasyon Senaryosu kapsamında enerji ithalatçısı ülkelerin ithalat faturası 2035'te 2025'e göre yaklaşık dörtte bir düşmektedir. Bu azalış yılda yaklaşık 400 milyar dolardır; 2026'daki daha yüksek enerji fiyatlarıyla değerlendirildiğinde 500 milyar doların üzerine çıkmaktadır (IEA, s. 17). Son kullanım emisyonları aynı senaryoda 2035'e kadar yaklaşık %40 azalmaktadır. Azalışın yaklaşık 5 gigaton (Gt) karbondioksiti elektrifikasyondan, yaklaşık 3 Gt'u diğer önlemlerden gelmektedir (IEA, s. 18, 156).
IRENA raporuna göre yenilenebilir enerji 2025'te 480 milyar dolarlık fosil yakıt maliyetini ve 8,4 Gt karbondioksit emisyonunu önlemiştir (IRENA, s. 34). GRA önsözü, Hürmüz Boğazı'ndaki askerî çatışmanın petrol ve gaz arzında yol açtığı kısıta atıf yapmaktadır (IRENA, s. 13). 18.09.2026 tarihli Weekly Insight #19, Hürmüz Boğazı'ndan sıvılaştırılmış doğal gaz geçişlerini ve Avrupa Birliği depolama düzeylerini kaydetmiştir.
Yedi göstergede kaydedilen ve gereken değerler
Gösterge
Kaydedilen
Gereken veya senaryo değeri
Oran (hesap)
Kaynak
Elektriğin nihai enerji tüketimindeki payı, yıllık değişim
2000-2025'te yılda 0,24 puan (hesap)
%35'e ulaşmak için 2025-2035'te yılda 1,2 puan (hesap)
5,0
IEA, s. 15, 16, 31, 46
Yenilenebilir kapasite ilavesi
2025'te 693 GW
2026-2030'da yılda ortalama 1.204 GW
1,74
IRENA, s. 16, 23, 27
Enerji yoğunluğu iyileşmesi
2025'te %1,7
2026-2030'da yılda %5,6
3,3
IRENA, s. 16, 38
İletim ve dağıtım yatırımı
2025'te 450 milyar dolar
2035'te yaklaşık 930 milyar dolar (Yüksek Elektrifikasyon Senaryosu, Net Sıfır Emisyon üretim karması)
2,07
IEA, s. 145
Şebeke ve esneklik yatırımı
2025'te 525 milyar dolar
2026-2030'da yılda ortalama 874-981 milyar dolar
1,66-1,87
IRENA, s. 46-47
Yenilenebilir enerji yatırımı
2025'te 625 milyar dolar
2026-2030'da yılda ortalama 1.725 milyar dolar
2,76
IRENA, s. 45, 47
Enerji verimliliği ve tasarrufu yatırımı
2025'te 369 milyar dolar
2026-2030'da yılda ortalama 3.182 milyar dolar
8,6
IRENA, s. 46-47
Yatırım değerleri 2025 fiyatlarıyla dolar cinsindendir. Oranlar, gösterilen rapor değerlerinden bu sayıda hesaplanmıştır. İlk satırdaki yıllık puan değerleri IEA rapor metnindeki %17, %23 ve %35 yuvarlanmış değerlerinden hesaplanmıştır; 2000 ve 2025 için IEA Şekil 1.5 okumalarıyla (yaklaşık %16,7 ve %23,4) iki hız yılda yaklaşık 0,27 ve 1,16 puan, oran yaklaşık 4,3 olmaktadır (hesap).
İzleme noktaları: ölçülemeyen veya uzlaştırılamayan kalemler
Kalem
Durum
%35 hedefinin statüsü
İki raporda da COP31 Başkanlığının önerisi ve çağrısı olarak yer almaktadır; IEA raporu bu düzeyi "goal, currently under international discussion" (uluslararası düzeyde görüşülmekte olan hedef) olarak nitelemektedir (s. 16). İki rapor da Taraflar Konferansının kabul edilmiş bir kararını kaydetmemektedir; kabul konusu 9-20 Kasım 2026 tarihli COP31'e aittir (IRENA, s. 3).
2024 elektrifikasyon oranı: yaklaşık %23,0 veya %24
2024 için IEA Şekil 1.5 okuması yaklaşık %23,0'dır (IEA, s. 31). IRENA Şekil 7, IEA World Energy Statistics and Balances verisinden hesaplanan %24 değerini vermektedir (IRENA, s. 40, 3 numaralı not). İki rapor da farkı açıklamamaktadır. 2025 için IEA Şekil 1.5 okuması yaklaşık %23,4, rapor metnindeki değer %23'tür (IEA, s. 16, 31). Bu sayıdaki iki değer kümesinin farklı baz yıllarına dayandığı ifadesi yalnız sektör değerleri için geçerlidir.
2025 şebeke yatırımı: 422 veya 450 milyar dolar
IRENA raporu şebeke altyapısı için World Energy Investment 2026 atfıyla 422 milyar dolar (s. 46), iletim ve dağıtım için yaklaşık 450 milyar dolar (s. 64) vermektedir; IEA Electrification raporu 450 milyar dolar vermektedir (s. 145). World Energy Investment 2026, 2025 için "nearly USD 450 billion" (yaklaşık 450 milyar dolar) ve 2026'da ayrıca %17 artış (s. 96), 2026 için "around USD 550 billion in 2026, up nearly 20%" (2026'da yaklaşık 550 milyar dolar, yaklaşık %20 artış; s. 9) vermektedir; değerleri piyasa kurlarıyla 2025 dolarıdır. %17 oranı 450 milyar dolara uygulandığında 2026 için yaklaşık 527 milyar dolar elde edilmektedir (hesap). 422 milyar dolarlık değer World Energy Investment 2026 metninde bulunamamıştır.
2025 depolama yatırımı: 103 milyar dolar
IRENA raporu pompalı hidroelektrik dâhil enerji depolaması için 103 milyar dolar vermekte ve World Energy Investment 2026'ya atıf yapmaktadır (s. 46). Değer World Energy Investment 2026 metninde bulunamamıştır; bu yayın pompalı hidroelektrik depolamayı batarya depolama kalemi altında değil, yenilenebilir enerji kalemi altında saymaktadır (World Energy Investment 2026, s. 67). IEA Electrification raporu 2025 batarya depolama yatırımını 80 milyar dolar olarak vermektedir (s. 145). 525 milyar dolarlık toplamın 422 ve 103 milyar dolarlık bileşenlerinin ikisi de World Energy Investment 2026 metninde bulunamamıştır.
902 milyar dolarlık şebeke değerinin kaynağı
IRENA raporunun 64. sayfasında IRENA'nın Mayıs 2026 tarihli Transitioning away from fossil fuels raporuna atıfla verilmektedir. Değer bu raporun metninde bulunamamıştır; rapor 2026-2035 dönemi için şebekelere yılda yaklaşık 1 trilyon dolar (Tablo 1, s. 27), 2026-2030 dönemi için elektrik şebekeleri ve enerji esnekliğine toplam 5,5 trilyon dolar (s. 26) vermektedir.
IRENA'nın iki 1,5°C şebeke değeri: 671 ve 902 milyar dolar
Weekly Insight #17, IRENA'nın 08.01.2026 tarihli makalesinde IRENA 1,5°C Senaryosu kapsamında 2030'a kadar yıllık şebeke yatırımı ihtiyacı olarak verilen 671 milyar doları aktarmıştır. IRENA izleme raporu revize 1,5°C Senaryosu kapsamında 2030'a kadar yılda yaklaşık 902 milyar dolar vermekte (s. 64) ve revize senaryonun yayımlanacak World Energy Transitions Outlook 2026'da yer alacağını belirtmektedir (s. 25). İncelenen kaynaklar iki değeri uzlaştırmamaktadır.
IEA'nın %33 değerinin zamanı
IEA raporu maliyet-etkin payı 15. ve 53. sayfalarda yıl belirtmeden ("today"), 51. sayfada 2035 için ("in 2035") vermektedir; IEA basın bülteni 2035'e kadar ("by 2035") ifadesini kullanmaktadır. Bu sayıda değer, 51. sayfadaki dayanakla 2025 koşullarında verilmektedir.
Yürürlükteki politika ayarlarında ("today's policy settings") 2035 payı
"Around 30%" (yaklaşık %30; IEA, s. 20) ve "slightly less than 30%" (%30'un biraz altında; IEA, s. 48). İki sayfa da senaryo adı vermemektedir. 51. sayfa yılda yaklaşık 925 TWh'lik talep artışı değeri için Açıklanan Politikalar Senaryosu (STEPS) adını vermektedir; 49. sayfadaki IEA Şekil 2.1'in başlığında "STEPS and HES" (HES: Yüksek Elektrifikasyon Senaryosu) yer almaktadır. 2035 payı burada yürürlükteki politika ayarlarına dayanan senaryolarda yaklaşık %30 olarak verilmektedir.
25 ülke sayımının başlangıcı
"Since February 2026" (Şubat 2026'dan bu yana; IEA, s. 15) ve "Since March, around 25 countries" (Mart'tan bu yana yaklaşık 25 ülke; IEA, s. 36).
2025 güneş ve rüzgâr ilavesi
IEA raporu 35. sayfada yaklaşık 600 GW güneş ve yaklaşık 140 GW rüzgâr, 100. sayfada yaklaşık 630 GW ve yaklaşık 160 GW vermektedir. IRENA 513 GW ve 158 GW vermektedir (s. 25-26). IRENA, 26. sayfada verilerinin 31 Aralık itibarıyla ticari işletmedeki santralleri kapsadığını ve ağırlıklı olarak üye ülkelerin resmî bildirimlerinden derlendiğini belirtmektedir. Bu sayıda kapasite değerleri yalnız IRENA'dan alınmıştır.
Şekillerden alınan değerler
IEA Şekil 1.5 (2000-2025 payları) ve 49. sayfadaki IEA Şekil 2.1'den alınan değerler grafikten okunmuştur ve yaklaşıktır. IRENA Şekil 1, 2, 3, 6, 7 ve 8'den alınan değerler grafik etiketleridir. IRENA, Şekil 7'deki son yıl değerlerini IEA World Energy Statistics and Balances verisinden hesaplamakta (s. 40, 3 numaralı not), Şekil 8'deki son yıl değerlerini IRENA, BloombergNEF ve IEA verilerinden derlemektedir (s. 47, 2 numaralı not). 2024 kurulu güç değerleri, 2025 değerlerinden 2025 ilavesi düşüldüğünde elde edilen değerlerle yaklaşık 1 GW farkla örtüşmektedir. 455 milyar dolarlık 2024 şebeke ve esneklik değeri ise 2025 bileşenlerinin belirtilen %12 ve %33 artış oranlarıyla geriye indirgenmiş toplamından yaklaşık 1 milyar dolar farklıdır (hesap).
2025 enerji verimliliği yatırımı: 362 veya 369 milyar dolar
IRENA raporu 16. sayfada 362 milyar dolar, 46-47. sayfalarda 369 milyar dolar vermektedir; burada 369 milyar dolar kullanılmaktadır.
IRENA basın bülteninde 2025 enerji yoğunluğu iyileşmesi
IRENA'nın lansman basın bülteni enerji yoğunluğunun 2025'te yaklaşık %2 iyileştiğini ("improved by around 2%") belirtmektedir. Rapor %1,7 vermektedir (s. 16, 38); burada %1,7 kullanılmaktadır.
IRENA basın bülteninde "iki katından fazla" ifadesi
Lansman basın bülteni "nearly USD 1 trillion annually between 2026-2030, more than double 2025 levels" (2026-2030 döneminde yılda yaklaşık 1 trilyon dolar, 2025 düzeylerinin iki katından fazla) ifadesini kullanmaktadır. Rapor şebeke ve esneklik için yılda en çok 1 trilyon dolar ("up to USD 1 trillion"; s. 46) ve 874-981 milyar dolarlık bir aralık (s. 47) vermektedir. 2025'teki 525 milyar dolarlık şebeke ve esneklik toplamına göre 1 trilyon dolar 1,90 kat, aralık 1,66-1,87 kattır (hesap). Yalnız şebekeye ilişkin yaklaşık 800 milyar dolarlık ihtiyaç, 422 milyar dolarlık şebeke bileşeninin 1,90 katıdır (hesap).
IRENA sayıları arasında yatırım ihtiyacı
IRENA'nın 2024 sayısına ilişkin 11.10.2024 tarihli basın bülteni, yenilenebilir kapasite için 2024-2030 döneminde yılda 1,5 trilyon dolar vermektedir. IRENA'nın 2025 sayısına ilişkin 14.10.2025 tarihli basın bülteni, yenilenebilir enerji için 2025-2030 döneminde yılda en az 1,4 trilyon dolar vermektedir. 2026 sayısı, yenilenebilir enerji üretim kapasitesi için 2026-2030 döneminde 2025 fiyatlarıyla yılda 1,7 trilyon dolar vermektedir (s. 45, 47). Önceki değerlerin fiyat bazı teyit edilmediğinden üç değer burada karşılaştırılmamaktadır.
Çin, 2026 tam yıl
IRENA raporunda yalnız 2026 ilk yarısına ait değişimler yayımlanmıştır (s. 57). 01.10.2026 itibarıyla tam yıl istatistikleri yayımlanmamıştır.
Kaynaklar.
Uluslararası Enerji Ajansı, Electrification – Special Report (22.09.2026, CC BY 4.0) ve IEA'nın 22.09.2026 tarihli basın bülteni.
Uluslararası Yenilenebilir Enerji Ajansı, COP31 Başkanlığı ve Global Renewables Alliance, Delivering on the UAE Consensus: Tracking progress toward tripling renewable energy capacity and doubling energy efficiency by 2030 (2026 sayısı, ISBN 978-92-9260-750-0). Bu kaynak şunları da kapsamaktadır:
raporda aktarılan IEA World Energy Investment 2026 ve Electricity 2026, BloombergNEF, Montel Analytics, Çin Ulusal Enerji İdaresi, Almanya Federal Şebeke Ajansı (Bundesnetzagentur), Birleşmiş Milletler İklim Değişikliği Çerçeve Sözleşmesi NDC Registry verileri ve 22.07.2026 tarihli Reuters haberi;
raporun 2. sayfasında yer alan Birinci Küresel Durum Değerlendirmesi sonuç metni (Birleşmiş Milletler İklim Değişikliği Çerçeve Sözleşmesi, 2023).
IRENA'nın "Renewables Gain Ground, but Must Accelerate Towards the 2030 Goal" başlıklı basın bülteni ve raporun yayımlandığına ilişkin 21.09.2026 tarihli X duyurusu.
Uluslararası Enerji Ajansı, World Energy Investment 2026 (28.05.2026; revize sürüm, Haziran 2026), s. 9, 67, 95, 96; Uluslararası Yenilenebilir Enerji Ajansı, Transitioning away from fossil fuels (Mayıs 2026), s. 26-27. İki yayın, IRENA izleme raporunda atıf yapılan değerler için incelenmiştir.
Uluslararası Enerji Ajansı, Electricity 2026 (Şubat 2026), s. 10, 46; Weekly Insight #17'de yer alan değer için incelenmiştir.
IRENA'nın "Global Goal of Tripling Renewables Needs USD 1.5 Trillion Investment Per Year" (11.10.2024) ve "World Breaks Renewable Records but Must Move Faster to Hit 2030 Tripling Goal" (14.10.2025) başlıklı basın bültenleri; IRENA'nın "Funding Grid and Storage Enhancement: The Call for Stronger Public-Private Collaboration" başlıklı makalesi (08.01.2026).
Bu yayının Weekly Insight #9 (27.06.2026), #13 (30.07.2026), #17 (04.09.2026) ve #19 (18.09.2026) sayıları.
Alıntılar sayfa atıflı kısa pasajlarla sınırlıdır. Değerlendirme UzEnergyNews tarafından yapılmıştır.