Zero LNG Transits Through Hormuz Since 11 July: Europe's storage series, the price readings and the fourth-quarter estimates
Kpler recorded no laden liquefied natural gas transit through the Strait of Hormuz after 11 July 2026. The closure that began on 28 February removed more than 10 billion cubic feet a day of supply, about 20 per cent of global LNG trade, predominantly at Qatar's Ras-Laffan complex (United States Energy Information Administration, 28 April 2026). Qatar shipped 18 cargoes in the first six months of the conflict against 509 in the same period a year earlier, and the International Energy Agency measures Qatari and Emirati supply 35 billion cubic metres lower between March and June than in the same four months of 2025. European Union storage stood at 68.04 per cent, or 769.87 terawatt-hours, at 06:00 CEST on 13 September (Gas Infrastructure Europe, AGSI+), against a five-year seasonal comparison base that different sources place between 82 and 88 per cent. The Dutch front-month contract was assessed at 84.275 euros a megawatt-hour on 14 September and at 78.80 euros on 18 September. Four institutions place their fourth-quarter estimates between 45 and 80 euros a megawatt-hour. This edition sets out the transit series, the volumes withdrawn from the market, the price readings with their dates, and the injection mechanics behind the filling rate.
The closure sequence and the transit count
The closure of the Strait of Hormuz began on 28 February 2026. On 4 March the Islamic Revolutionary Guard Corps (IRGC) stated that it held full control over the strait, and QatarEnergy declared force majeure on its liquefied natural gas contracts on the same date (United States Energy Information Administration, 28 April 2026; secondary accounts carry 3 March for the declaration and the agency date is used here). An understanding reached on 17 June was followed by a renewed closure on 20 June; the ceasefire lapsed on 8 July, and on 12 July the IRGC Navy declared the strait formally closed. Reports of attacks and transit interruptions continued through mid-September (GlobalSecurity daily compilation, 16-17 September 2026).
Kpler recorded no laden LNG vessel transiting the strait in March, four in April, eight in May and 40 in June, and none after 11 July, when a vessel operated on behalf of Adnoc made the last recorded passage. The 40 June transits do not fit inside the three days between the 17 June understanding and the 20 June reclosure; the Kpler record places passages on dates through the month and includes a vessel entering the Gulf on 26 June. The observation window of the Energy Information Administration covers 1 March to 24 April and records no laden LNG transit in that window; the dates of the four April transits within the month have not been published. On the same count, 13 LNG vessels were in ballast, five were laden and four were berthed at terminals in the Gulf.
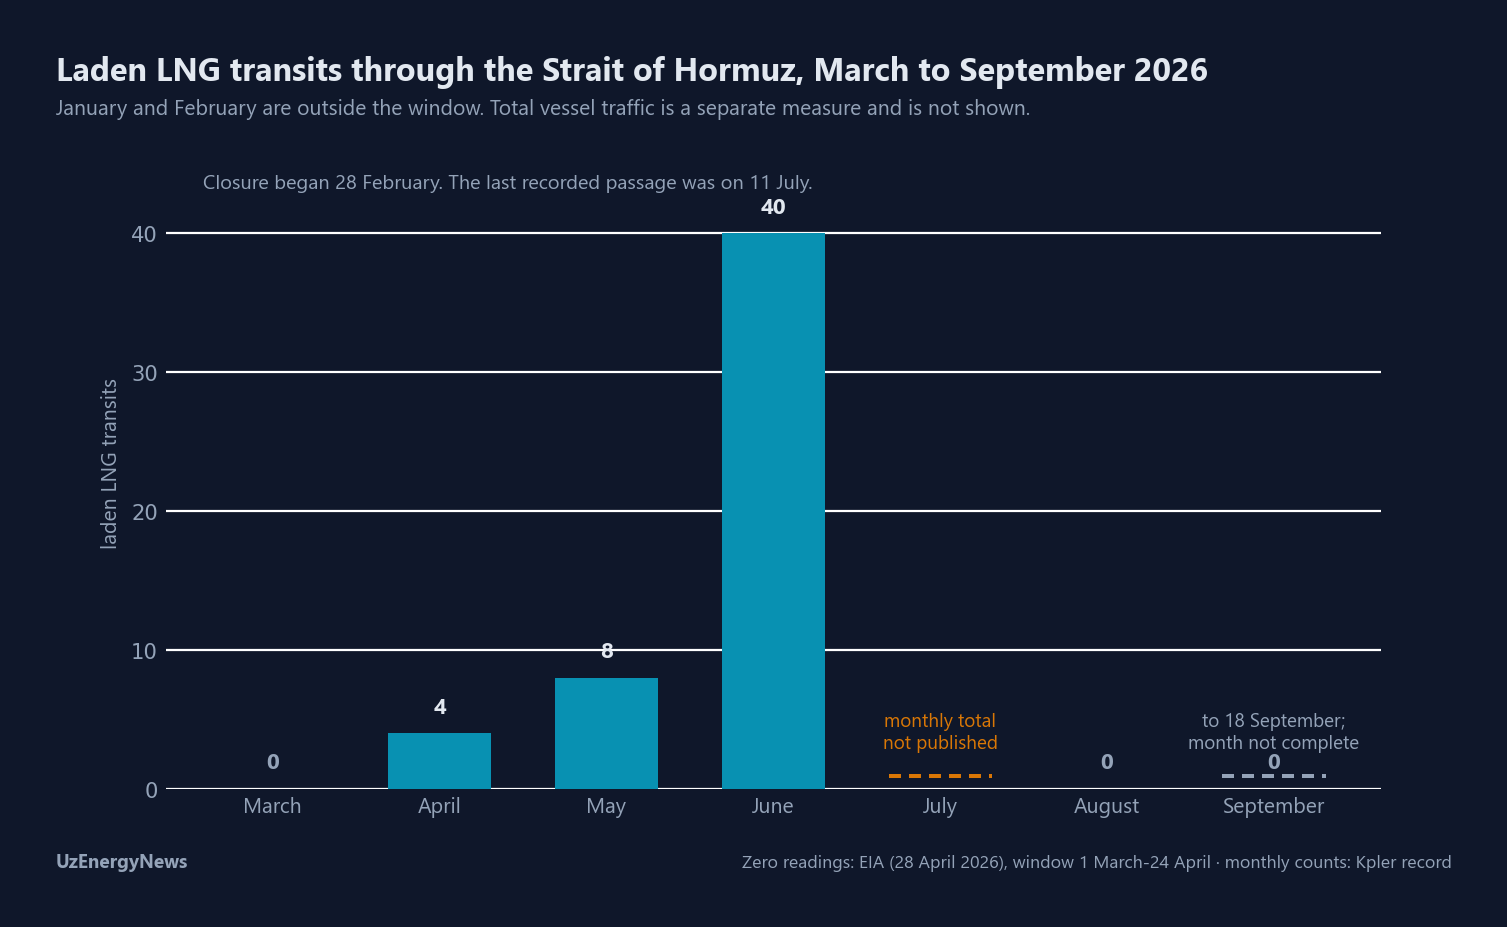
Total vessel traffic is counted differently by different methods. Kpler figures reported on 15 September show four transits that day against a ten-day average of 18, while Windward counted 12 transits on 16 September, of which three were broadcasting automatic identification system signals; the remainder were detected by satellite. The pre-conflict baseline was about 125 transits a day. For liquefied natural gas the measurement is separate: zero laden transits since 11 July. Weekly Insight #17 measured network financing and #18 the nuclear fuel chain; this edition measures gas and liquefied natural gas.
Volumes withdrawn from the market
The closure affected more than 10 billion cubic feet a day of global liquefied natural gas supply, about 20 per cent of global LNG trade, predominantly at Qatar's Ras-Laffan facility. More than 80 per cent of QatarEnergy's sales are contracted to Asia. United States LNG exports reached 17.9 billion cubic feet a day in March with terminal utilisation at 94 per cent, against 17.3 billion cubic feet a day and 91 per cent in February, and Henry Hub was 9 per cent below its 28 February level (United States Energy Information Administration, 28 April 2026).
Qatar shipped 18 cargoes in the first six months of the conflict against 509 in the same period of the previous year, a decline of 96 per cent, and gas sales not realised over those six months are placed at about 24 billion dollars, equal to about 20.7 billion euros at 1.1594 dollars to the euro (Euronews, 8 September 2026). Two of the 14 liquefaction trains are damaged, taking 17 per cent of Qatari capacity — about 12.8 million tonnes a year — out of service, with repair stated at three to five years; Qatari and Emirati volumes are 36 million tonnes below the 2025 level for the year to date, of which about 20 million tonnes have been covered by United States and Canadian cargoes (The National, 14 September 2026).
On the International Energy Agency measure, Qatari and Emirati supply between March and June was 35 billion cubic metres lower than in the same four months of 2025, with production in those months down about 80 per cent. Production outside the Gulf rose 18 per cent, or about 27 billion cubic metres, covering some three quarters of the Gulf shortfall. Global LNG output was 4 per cent, or 8 billion cubic metres, lower over the same four months and is flat year on year for 2026 as a whole. The three readings close against each other: 35 billion cubic metres withdrawn less 27 billion replaced leaves the 8 billion measured as the global shortfall. Global gas demand is measured 0.5 per cent, or about 20 billion cubic metres, lower in 2026, the third annual contraction of the decade, and the cumulative 2026-2030 supply loss is estimated at 140 billion cubic metres (International Energy Agency, Gas Market Report Q3-2026 and statement of 7 July 2026).
Three cargoes were moved by ship-to-ship transfer off Oman and the United Arab Emirates in August, destined for India and Japan. Each transfer adds more than one million dollars and 30 to 35 hours of additional voyage time (Euronews, 8 September 2026, on Kpler and Vortexa data).
Price readings, each with its date
The readings below are stated with the date and the instrument on which each was made. Front-month futures, weekly averages and forward spot assessments are not interchangeable and are not combined here. Two sources state year-to-date percentage changes on bases that differ from one another; those percentages are listed among the watch points rather than reproduced in the table.
| Date | Indicator | Reading | Source |
|---|---|---|---|
| Week of 24 April 2026 | TTF | 14.80 dollars a million British thermal units, 35 per cent above 28 February | EIA, 28 April 2026 |
| Week of 24 April 2026 | JKM | 16.02 dollars a million British thermal units, 51 per cent above 28 February | EIA, 28 April 2026 |
| Second quarter 2026 average | TTF / Platts JKM | about 16 dollars (+32 per cent year on year) / 17.5 dollars (+45 per cent) | IEA, Gas Market Report Q3-2026 |
| 20 August 2026 | TTF front month | 65 euros a megawatt-hour, highest since March | Euronews, 20 August 2026 |
| 4 September 2026 | TTF front month | 72.50 euros a megawatt-hour; weekly gain above 8 per cent, fourth consecutive weekly increase; highest since 2023 | Reuters, reported 4 September 2026 |
| 6 September 2026 | TTF October contract / November-March strip | 72.90 / 70.90 euros a megawatt-hour | Citigroup analysis, reported 6 September 2026 |
| 14 September 2026, 07:50 Amsterdam | TTF front month | 84.275 euros a megawatt-hour, equal to 97.31 dollars; intraday gain 6 per cent; above the January 2023 level | Mansfield Energy daily note, 14 September 2026 (single source) |
| 15 September 2026 | North-east Asia spot LNG, four to eight weeks forward | 28.40 dollars a million British thermal units, 2.70 dollars higher on the week | Energy Intelligence |
| 15 September 2026 | South-west Europe spot LNG | 27.50 dollars a million British thermal units, 3.00 dollars higher on the week | Energy Intelligence |
| 17 September 2026 | Brent settlement | 104.82 dollars a barrel | Market compilation; no dated primary release identified |
| 18 September 2026 | TTF front month | 78.80 euros a megawatt-hour, an intraday reading; intraday gain 3.20 per cent | TradingEconomics |
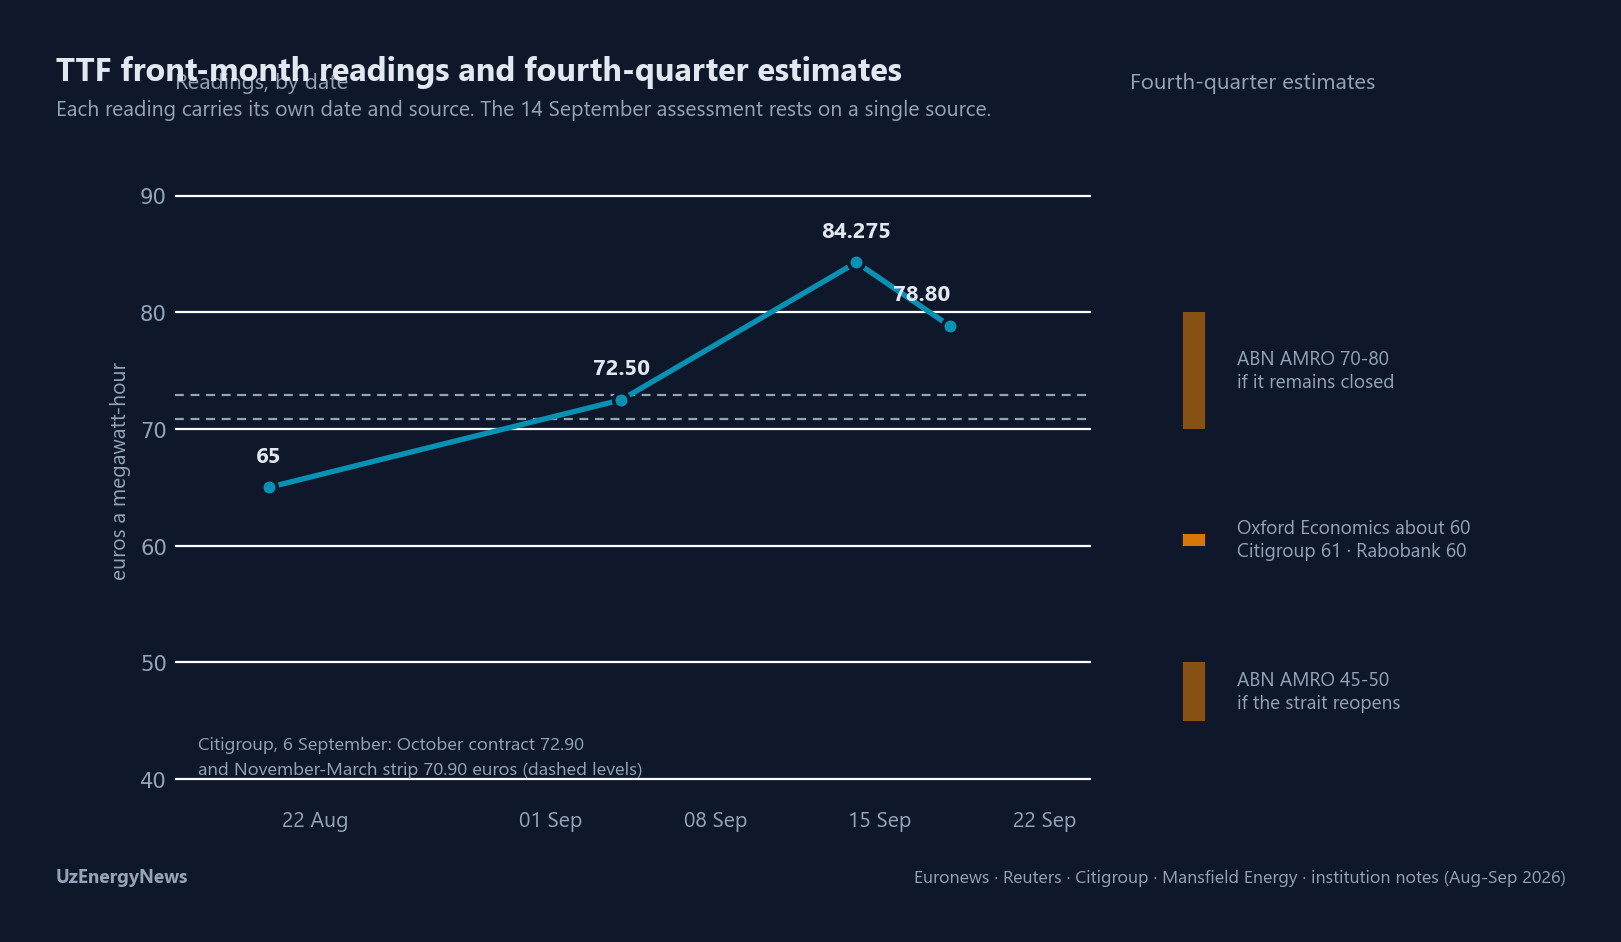
Converted at 3.412 million British thermal units to the megawatt-hour, the 14 September European front-month reading of 97.31 dollars a megawatt-hour equals 28.5 dollars a million British thermal units. The north-east Asian spot assessment for 15 September is 28.40 dollars and the south-west European assessment 27.50 dollars. The three readings fall within about one dollar of each other; they are one day apart and are made on different instruments, a front-month futures contract in the first case and forward spot assessments in the other two.
Injection economics: the seasonal spread and terminal utilisation
When the near-dated contract trades above the forward-dated one, gas bought for injection cannot be sold forward at a price that covers its purchase cost, and the commercial incentive to fill storage is removed irrespective of available physical capacity. The summer 2026 contract traded 0.5 euros a megawatt-hour above the winter 2026 contract in January 2026 (Timera Energy, 26 January 2026). From 1 April the summer-winter spread averaged minus 1.2 euros a megawatt-hour within a band of minus 1 to minus 2.5 euros, and injections ran 20 per cent below the previous year at about 200 million cubic metres a day, a rate implying 70 per cent filling on 1 November (European Gas Hub, 13 May 2026).
The European Union Agency for the Cooperation of Energy Regulators reported on 7 July 2026 that unfavourable winter-summer price differences weaken the incentive to fill storage, with regasification capacity providing partial compensation. Initiative Energien Speichern stated on 8 September 2026 that the insufficient injection incentive arises from the high prices caused by the Hormuz closure together with a summer-winter difference that has at times been negative. The latest injection rate on the AGSI+ reading of 13 September 2026 is 0.19 percentage points a day.
Physical import capacity is measured separately. European Union LNG import capacity stands at 242 billion cubic metres a year, 76 billion cubic metres of which was added between 2021 and 2025, and average terminal utilisation was 55 per cent in the first quarter of 2026 against 51 per cent in 2025 and 42 per cent in 2024 (IEEFA European LNG Tracker; European Commission). The utilisation measurement and the injection-rate measurement are two separate readings and are stated together.
The storage series and the comparison base
European Union storage readings are set out below with their dates. The five-year seasonal comparison base is stated between 82 and 88 per cent depending on the source, and each reading below carries the base used by the source that published it.
| Date | Reading | Comparison base stated by the source | Source |
|---|---|---|---|
| 1 April 2026 (end of winter) | 28 per cent | five-year average 41 per cent | EIA, 28 April 2026; ACER, 7 July 2026 |
| 2 July 2026 | about 49 per cent | below the ten-year average and below 2025 | ACER, 7 July 2026 |
| 1 August 2026 | 57.1 per cent | lowest on record for that calendar day | Euronews, 20 August 2026 |
| 15 August 2026 | 60.8 per cent | below recent years | GIE, reported by S&P Global, 17 August 2026 |
| 4 September 2026 | about 62 per cent | below the five-year seasonal average | Reuters, 4 September 2026 |
| 6 September 2026 | 66.59 per cent | base not stated | derived AGSI+ reading |
| 13 September 2026, 06:00 CEST | 68.04 per cent, 769.87 terawatt-hours | five-year base stated between 82 and 88 per cent across sources; the gap is 13.96 points against 82 per cent and 19.96 points against 88 per cent | GIE AGSI+ |
| mid-September 2026 (cut-off date not stated) | 65 per cent | average 82 per cent | ABN AMRO, Gas Market Strategist |
| Germany, early September 2026 | about 53 per cent, lowest for that date in 15 years of records | about 71 per cent a year earlier | INES, 8 September 2026 |
| Germany, mid-September 2026 | about 55 per cent, about 136 terawatt-hours | reserved capacity about 83 per cent | INES and press reports |
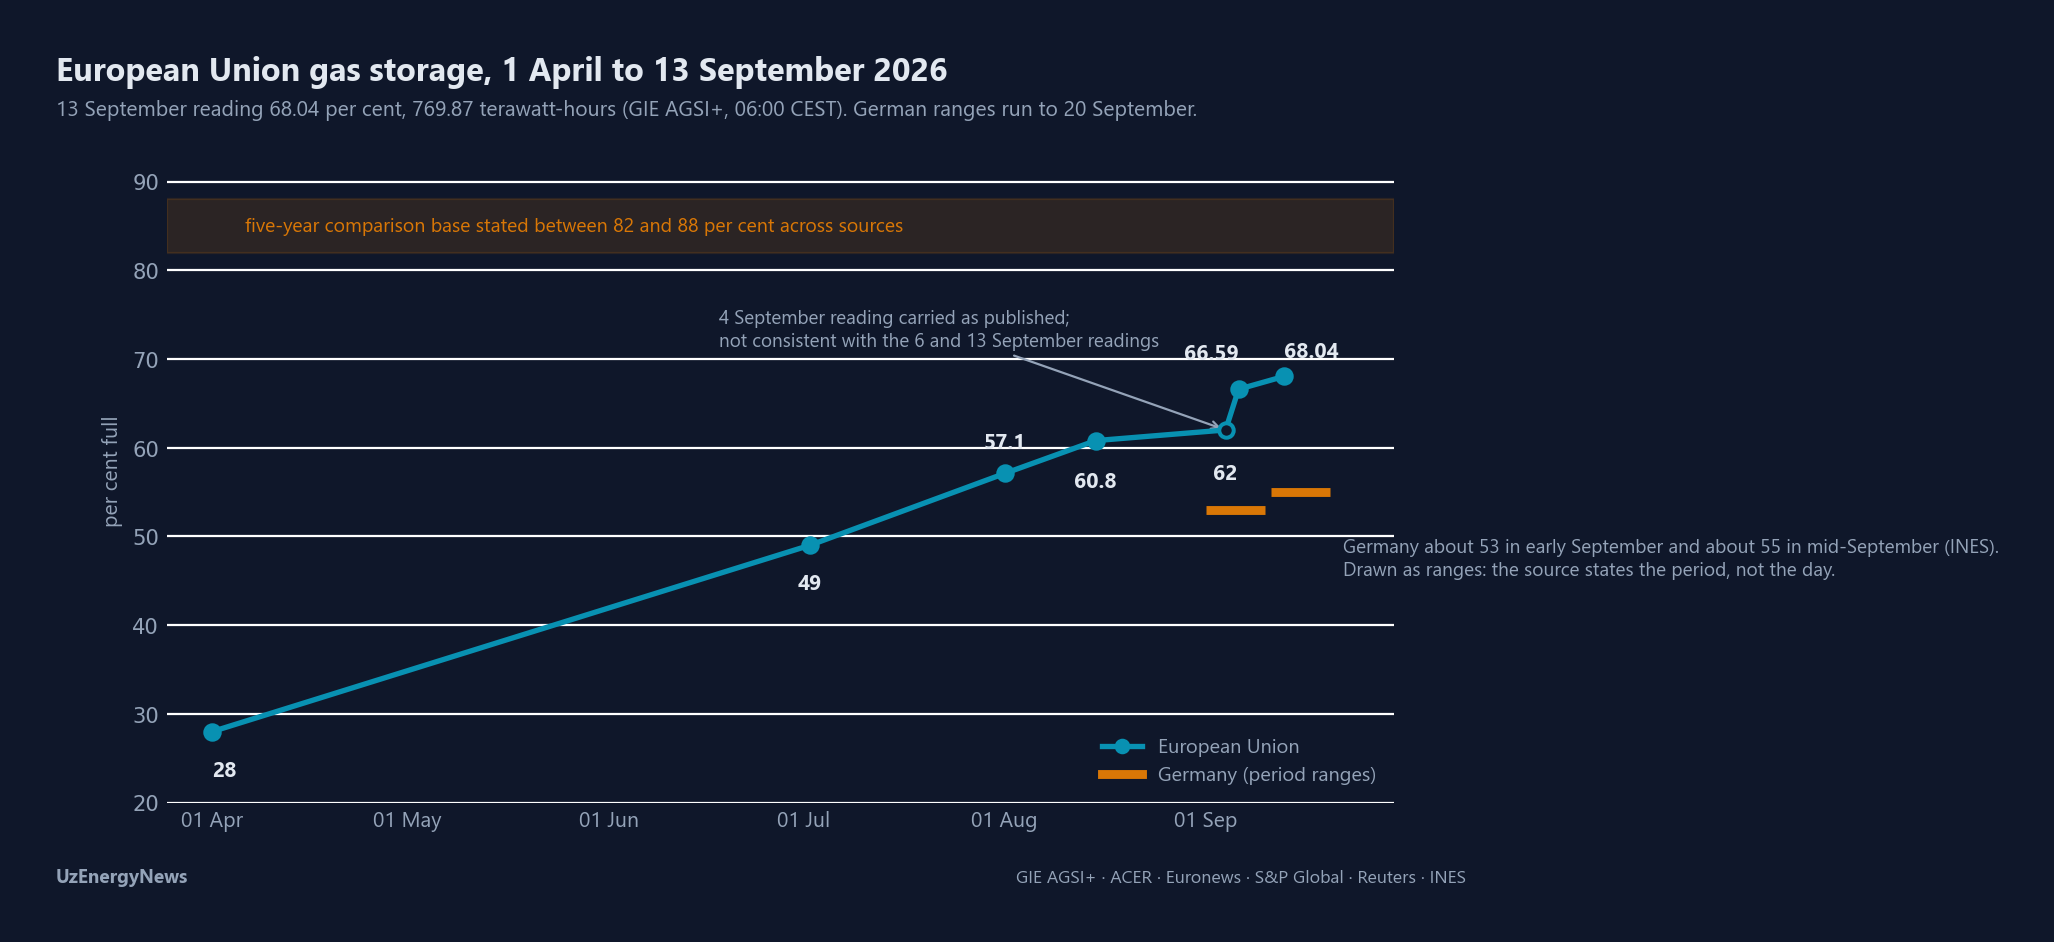
Two readings for the same week differ: 65 per cent in the ABN AMRO note, which does not state its cut-off date, and 68.04 per cent on the AGSI+ reading of 13 September. The difference of about three points has not been reconciled in a published series.
The European Union filling target is 90 per cent, attainable on any date between 1 October and 1 December, with a deviation of up to 10 percentage points permitted in difficult market conditions; the regime has been extended to 31 December 2027 (European Parliament and Council documents). The same assessment of 7 July 2026 stated that meeting the 90 per cent target requires European Union LNG imports about 13 per cent above the 2025 level, while the 80 per cent level is attainable at 2025 import volumes. For Germany, Initiative Energien Speichern calculates that about 77 per cent is technically attainable on 1 November and that, in an extreme cold winter, the gap on individual January days exceeds 25 per cent of daily demand.
Fourth-quarter estimates from four institutions
Four institutions have published fourth-quarter estimates. The attributions below are by institution and title; individual names are not reproduced.
| Institution | Estimate | Date |
|---|---|---|
| ABN AMRO (senior energy economist) | 45-50 euros a megawatt-hour in the fourth quarter if Hormuz reopens; 70-80 euros if it remains closed | publication date not verified |
| Oxford Economics (economist) | about 60 euros a megawatt-hour on average across the fourth quarter of 2026 and the first quarter of 2027; euro-area headline inflation 3.5 per cent in the second half of 2026 against 3 per cent in the baseline | 20 August 2026 |
| Citigroup | probability-weighted winter estimate of 61 euros a megawatt-hour, against market pricing of 72.90 euros for October and 70.90 for November-March | 6 September 2026 |
| Rabobank (energy strategist) | 60 euros a megawatt-hour average in the fourth quarter of 2026; 42 euros as the 2027 baseline and 50-60 euros in an infrastructure-damage scenario | 8 September 2026 |
Three of the four estimates for the winter fall between 60 and 61 euros a megawatt-hour, and the fourth is stated as a range conditional on the strait. The market front-month contract was assessed at 84.275 euros on 14 September and 78.80 euros on 18 September. The difference between the institutional estimates and the traded front month is between about 18 and 24 euros a megawatt-hour on those two dates.
The electricity link
Coal fell to its lowest recorded share of European generation in 2025 (Ember, European Electricity Review 2026), which narrows the margin available from coal-to-gas switching. The share of hours in which gas set the wholesale electricity price in individual member states, and the day-ahead price bands recorded during the periods of tension, could not be tied to a dated primary release and are listed among the watch points.
Three further factors slowed injection over the 2026 summer: gas-fired generation raised by the southern European heatwave, Norwegian offshore maintenance outages and delays to Qatari LNG deliveries (Reuters, 4 September 2026).
Eurasia: pipeline volumes and the region's exposure
| Indicator | Reading | Source |
|---|---|---|
| Gazprom deliveries to Kazakhstan, Kyrgyzstan and Uzbekistan, 2026 | about 70 per cent higher | Times of Central Asia |
| Russian gas deliveries to Uzbekistan | 6.48 billion cubic metres in 2025 (+15 per cent); above 10 billion cubic metres expected for 2026 | IEA; Times of Central Asia |
| Uzbek gas production, first half of 2026 | 18.3 billion cubic metres, 16.4 per cent lower year on year | Times of Central Asia; Kursiv |
| Türkiye LNG imports | 11.1 billion cubic metres in January-October 2025, 24.55 per cent of total gas imports; 16.6 billion cubic metres projected for 2026 (publication date of the projection not stated) | S&P Global Commodity Insights |
| Azerbaijani gas exports, first half of 2026 | about 13 billion cubic metres in total; the first Trans Adriatic Pipeline expansion was completed in January 2026, adding 1.2 billion cubic metres a year | Caspian News, 21 July 2026 |
Central Asia imports no liquefied natural gas, and its exposure to the closure runs through pipeline volumes and domestic tariffs rather than through cargo pricing. That exposure has not been measured in a published series and is not quantified here.
The 19 June entry in this record
This publication carried a Top Story on 19 June 2026 under the title "Hormuz Set to Reopen and Brent Drops Below $80: A Gulf De-escalation That Reshapes the Map for Caspian Exporters", published at 08:00 on that date. The measurement current on the day of publication was a Brent price below 80 dollars a barrel and an understanding reached on 17 June; that entry recorded the understanding as extending the ceasefire by 60 days. The ceasefire lapsed on 8 July, 19 days after the entry. June carries 40 laden LNG transits on the Kpler count, the only month of 2026 with a material figure. The closure resumed on 20 June, the last laden LNG transit was recorded on 11 July and the IRGC Navy declaration followed on 12 July. Brent settled at 104.82 dollars a barrel on 17 September 2026 (market compilation; no dated primary release identified).
No separate follow-up on the status of the strait was published after 20 June. The consequences of the closure were carried in two later entries: Weekly Insight #13 of 30 July 2026, which recorded that the closure had removed nearly 20 per cent of global LNG supply, and the Top Story of 3 August 2026 on the Kirkuk-Ceyhan corridor, which recorded Iraqi oil shipments down by more than 80 per cent and monthly revenues falling from about 6 billion dollars to under 2 billion. The archive Top Stories carry no separate page and no permanent link; the 19 June entry is cited here by date and title, and the archive card carries its original headline without a correction note.
Watch points: what could not be measured
The following items are stated as unmeasured rather than estimated.
| Item | Status |
|---|---|
| Daily transit count | Method-dependent. Kpler figures reported by Reuters show four transits on 15 September and a ten-day average of 18; Windward counted 12 on 16 September, three of them broadcasting AIS. The difference arises from satellite detection of vessels with transponders switched off. A single daily figure cannot be stated. |
| LNG vessels in the Gulf | The count reports 21 vessels waiting, while the composition published alongside it — 13 in ballast, five laden, four berthed — sums to 22. A single total cannot be stated. |
| Dates of the four April transits | Not published. The Energy Information Administration window of 1 March to 24 April records no laden transit, and the placement of the April transits within the month has not been reconciled in a published series. If both counts hold, the four transits fall between 25 and 30 April; that window is derived here and is not published as such. |
| Transit count against cargo count | The 52 laden transits recorded between March and June and the 18 Qatari cargoes recorded over six months measure different sets: transits through the strait regardless of origin in the first case, delivered Qatari cargoes in the second. The two have not been reconciled in a published series. |
| Consistency of the 4 September storage reading | The reading of about 62 per cent on 4 September implies a fill of 2.3 percentage points a day to the 66.59 per cent reading of 6 September, against 0.06 to 0.27 points a day in every other segment of the series. The reading is carried as published and is not adjusted here; which of the two readings is the outlier has not been established. |
| Pre-conflict daily transit baseline | The figure of about 125 transits a day is carried without a dated attribution; no source for it is listed in the sources paragraph and it could not be tied to a published series. |
| Euro-dollar basis | Two rates are implied on this page and neither is dated: 1.1594 in the conversion of 24 billion dollars to 20.7 billion euros, which is arithmetic performed here rather than a source reading, and 1.1547 implied by the pairing of 84.275 euros with 97.31 dollars. The basis and date of each could not be established. |
| Five-year storage comparison base | Stated between 82 and 88 per cent across sources; a single base could not be established. |
| Basis of the 35 and 27 billion cubic metre figures | Stated in one account on an annualised basis and consistent in this text with the four-month period reading; the International Energy Agency's own basis could not be confirmed against the primary release. |
| Year-to-date percentage changes in gas prices | Two sources state 130 per cent above the start of the year at 65 euros (20 August) and 143 per cent at 78.80 euros (18 September), which imply start-of-year bases of 28.26 and 32.43 euros a megawatt-hour. The bases differ and are not reproduced here. |
| The 14 September reading of 84.275 euros | Single-source. Independent compilations place the peak of about 84 euros in early September and 16 September in a band of 77.58 to 78.03 euros; the date was not confirmed by a second source. |
| The weekly change to 18 September | TradingEconomics states this reading as 2 per cent lower on the week and the first weekly decline in six weeks. The 18 September leg is an intraday reading; the basis and time of the 11 September leg are not published. No settlement pair for the two dates was established from a published source, so the weekly percentage is not carried in the price table above. |
| Period of the 24 billion dollars of unrealised sales | Stated here as the first six months of the conflict on the reporting source; the relationship to QatarEnergy's own statements could not be verified. |
| Gas price-setting hours and day-ahead bands | The share of hours in which gas set the price in Italy, Germany, the Netherlands, Spain and Portugal, and the Italian and French day-ahead bands during the periods of tension, rest on market compilations; no dated primary release was identified. |
| Brent settlement of 104.82 dollars | Market compilation; no dated primary release identified. |
| Additional 5-point deviation from the filling target | Reported in secondary accounts as available by Commission decision; the article reference could not be confirmed in the regulation texts and it is not stated in the body. |
| Publication date of the ABN AMRO estimate and the cut-off of its 65 per cent reading | Not verified by direct access; two retrieval attempts timed out. |
| Qatari reloading schedule | Not published. Executives of four major producers stated on 14 September that exports would not return to normal levels immediately on a reopening; no date was given. |
| Institutional winter projection from the International Energy Agency | The fourth-quarter 2026 Gas Market Report has not been published; October is expected. |
| Saudi pipeline incident of 17 September and crude volumes rerouted around Hormuz | Not verifiable from a primary source; the source page returned an access error. |
| European LNG import outturn for 2026 | Not measured. The available projection of 145 million tonnes is dated December 2025 and rests on pre-closure assumptions. |
| Direct exposure of Uzbekistan and Central Asia | Not measured; the region imports no LNG and the linkage runs through pipeline imports and domestic tariffs. |
Sources cited in text and figures: United States Energy Information Administration, Today in Energy (28 April 2026); International Energy Agency, Gas Market Report Q3-2026 and statement of 7 July 2026; European Union Agency for the Cooperation of Energy Regulators (7 July 2026); Kpler transit and vessel data, including its statement on LNG transits since 11 July; Euronews (20 August and 8 September 2026) on Kpler and Vortexa data; The National (14 September 2026); Energy Intelligence spot LNG assessments (15 September 2026); Mansfield Energy daily note (14 September 2026); Reuters (4 September 2026); Citigroup analysis reported 6 September 2026; ABN AMRO Gas Market Strategist; Oxford Economics (20 August 2026); Rabobank commentary reported 8 September 2026; Initiative Energien Speichern (8 September 2026); Gas Infrastructure Europe, AGSI+ (13 September 2026); S&P Global Commodity Insights (17 August 2026); Timera Energy (26 January 2026); European Gas Hub (13 May 2026); IEEFA European LNG Tracker; European Commission and European Parliament documents on the storage regulation; Ember, European Electricity Review 2026; TradingEconomics (18 September 2026); Windward and GlobalSecurity daily compilations (16-17 September 2026); Caspian News (21 July 2026); Times of Central Asia and Kursiv; and this publication's own archive entries of 19 June, 30 July and 3 August 2026. Copyrighted material is not reproduced. Analysis by UzEnergyNews.
↩ Weekly Insight #13 — The World's Power System at Mid-Year: the closure and power markets by fuel exposure →