The World's Power System at Mid-Year: The IEA's 2026 Update in Numbers
The International Energy Agency's Electricity Mid-Year Update, published on 23 July, resets the reference numbers for the world's power system: demand growth revised up to 3.6 percent for 2026 and 3.8 percent for 2027, consumption heading from 28,600 to about 30,700 terawatt-hours, renewables overtaking coal in 2026 after more than half a century of coal at the top, solar adding around 600 terawatt-hours a year, emissions broadly flat while demand accelerates, and a war-driven fuel shock that has split wholesale prices by region. This edition presents the full dataset, in charts and tables.
Twice a year the IEA rebases the numbers every electricity analysis leans on, and the July edition lands in the middle of the most eventful year the power system has had since 2022: record heat, a record artificial-intelligence build-out, and the loss of nearly a fifth of global LNG supply after the closure of the Strait of Hormuz. Four findings organise the update. Demand growth is accelerating, not settling. The generation mix passes a historic threshold, with renewables overtaking coal after more than fifty years. Emissions plateau even as consumption surges. And the year's supply shock has priced very differently depending on what a power system burns. The numbers behind each follow.
Demand: the acceleration is broad-based
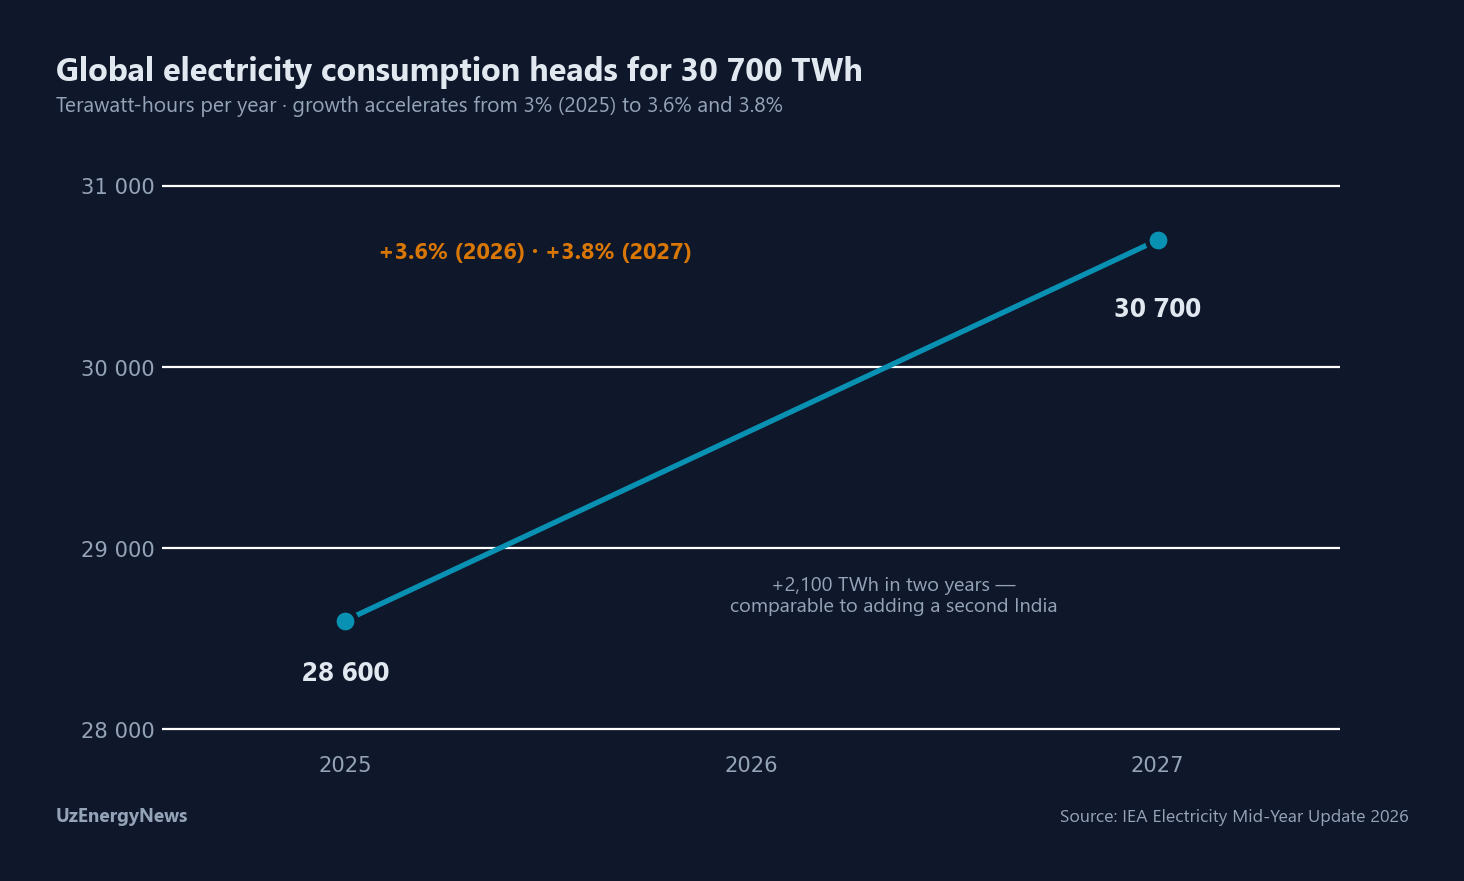
Global electricity demand grew 3 percent in 2025 and is now forecast to grow 3.6 percent in 2026 and 3.8 percent in 2027, lifting consumption from 28,600 terawatt-hours to about 30,700 terawatt-hours — an increment of more than 2,000 terawatt-hours in two years, comparable to adding a second India to the world's power system. The drivers are industrial electrification, air-conditioning, data centres and the electrification of transport and heating; the IEA flags a stronger-than-expected El Niño as an upside risk that would raise cooling demand further.
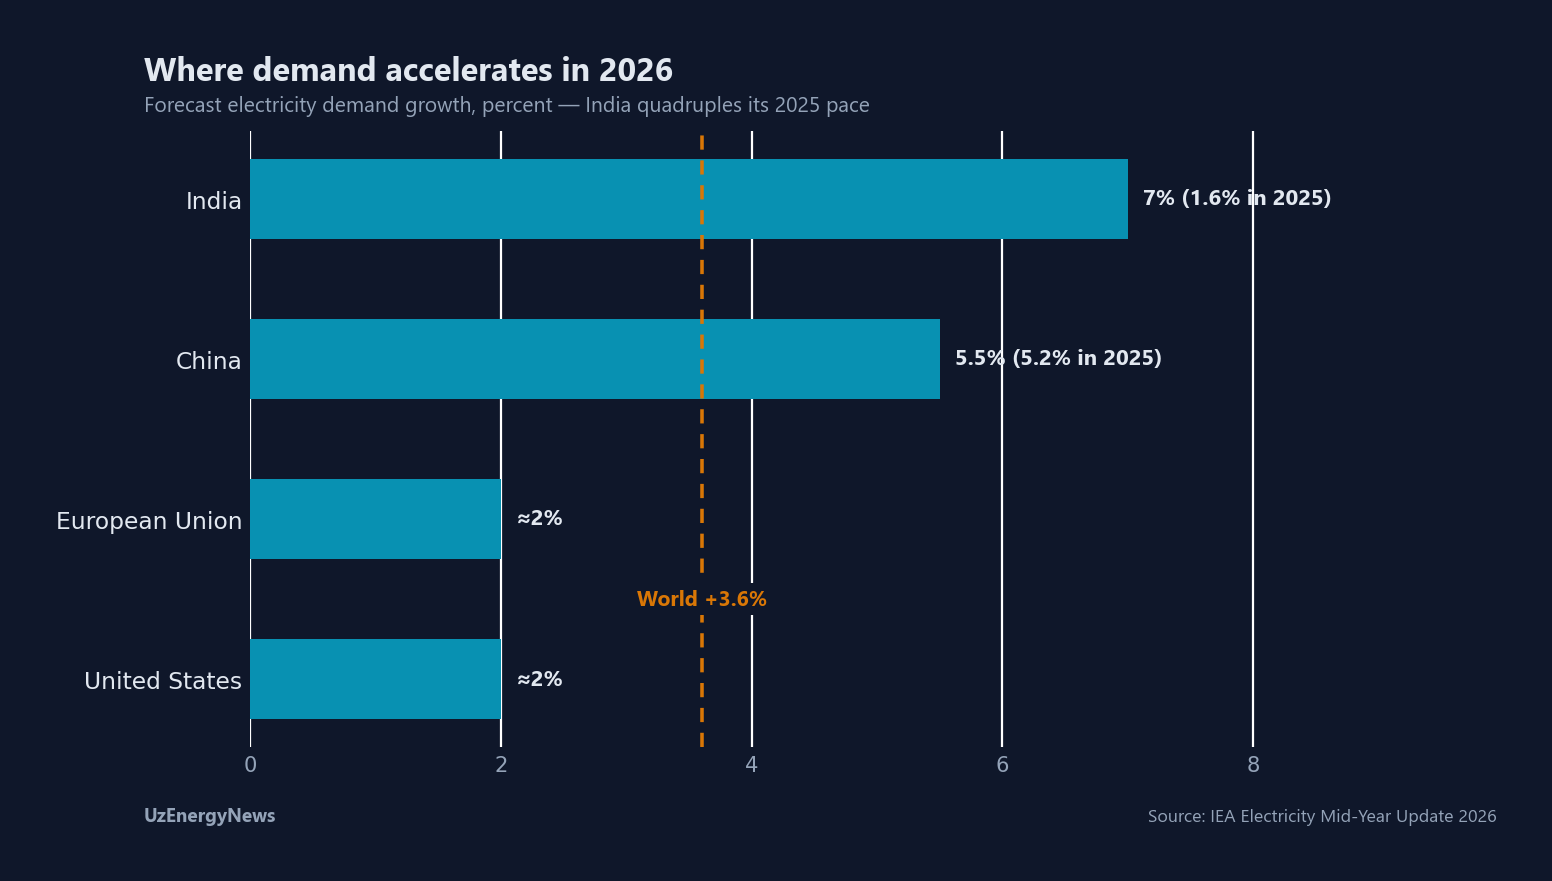
The geography matters as much as the total. India quadruples its pace, from 1.6 percent in 2025 to about 7 percent in 2026; China grows 5.5 percent, slightly above its 2025 rate; the United States adds close to 2 percent with data centres taking a large share of the increment; the European Union grows about 2 percent as industrial demand stabilises. Central Asia needs no forecast to illustrate the trend: Uzbekistan set six consecutive daily consumption records in a single July week and crossed 300 million kilowatt-hours a day for the first time.
| Indicator | 2025 | 2026 (f) | 2027 (f) |
|---|---|---|---|
| Global demand growth | 3.0% | 3.6% | 3.8% |
| Global consumption (TWh) | 28,600 | — | ≈30,700 |
| China | 5.2% | 5.5% | — |
| India | 1.6% | ≈7% | — |
| United States | — | ≈2% | — |
| European Union | — | ≈2% | — |
| Power-sector CO2 | — | ≈+1% | broadly flat |
The mix: coal's half-century at the top ends
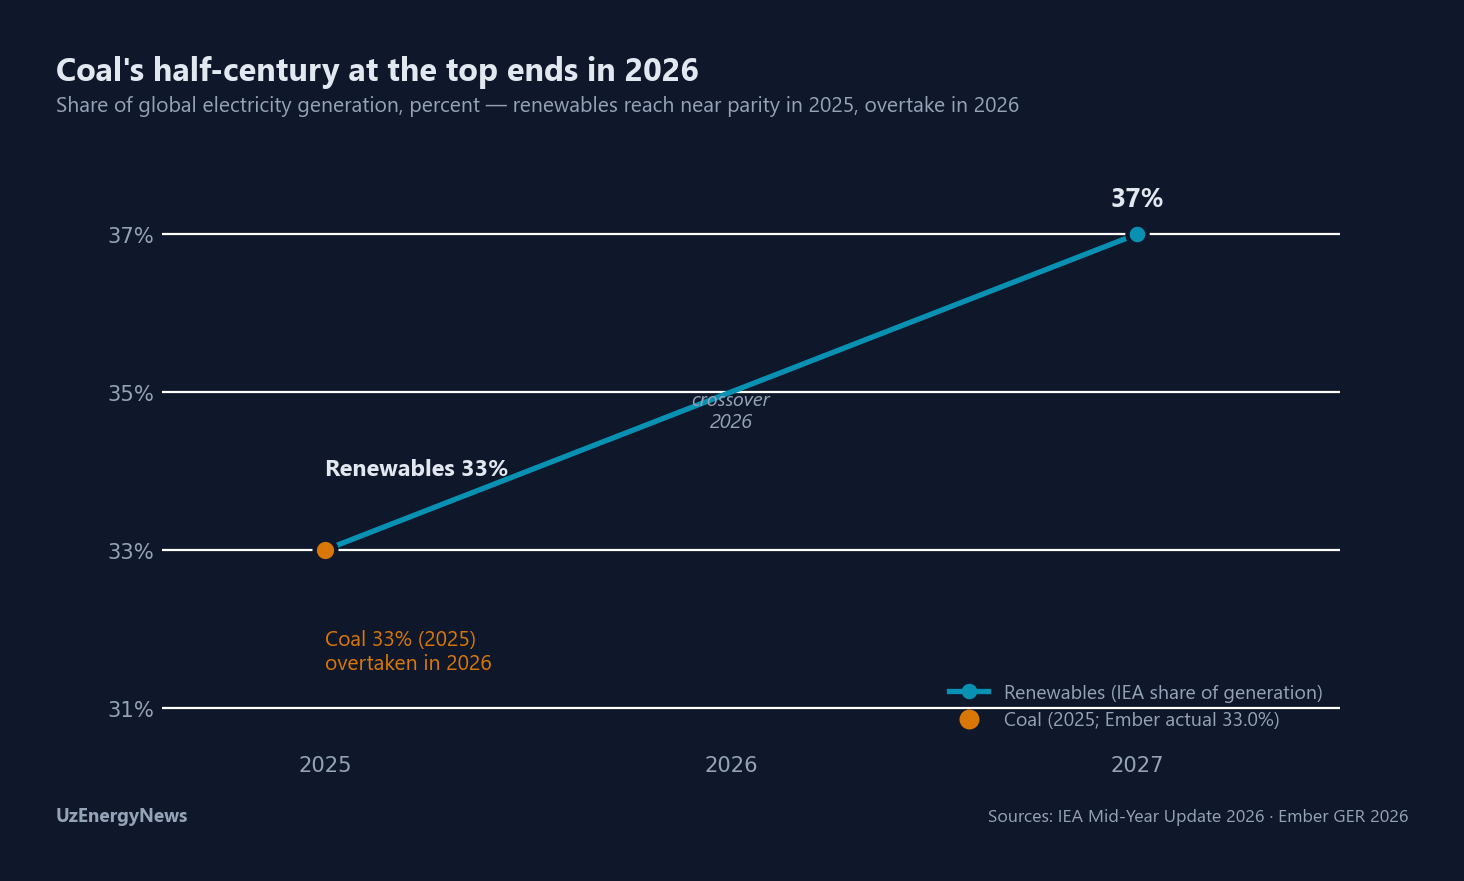
Renewables reached near parity with coal in 2025 and are forecast to overtake coal-fired output in 2026, taking their share of the generation mix from 33 percent in 2025 to 37 percent by 2027. Ember's dataset of 2025 actuals, covering 91 countries and about 93 percent of world demand, already reads renewables marginally ahead — 33.8 percent of generation against 33.0 percent for coal; the two institutions differ by decimal points and data vintage, not direction. Either way, the position coal has held for more than fifty years changes hands this year. The engine is solar, whose output rises by around 600 terawatt-hours in 2026, broadly matching its record 2025 expansion, with similar growth expected in 2027; solar also overtakes wind in 2026 to become the second-largest renewable source after hydropower. This is not a story of coal collapsing — absolute coal output remains close to its historic high, and price-driven switching from gas back to coal is under way in several Asian and European markets — but of renewables outgrowing everything else, with total renewable generation expanding more than 8 percent in 2026.
| Generation indicator | Value | Source |
|---|---|---|
| Renewables share, 2025 | 33% (IEA) · 33.8% actual (Ember) | IEA · Ember |
| Coal share, 2025 | 33.0% actual (near parity) | Ember · IEA |
| Renewables share, 2027 (f) | 37% | IEA |
| Renewable generation growth, 2026 (f) | more than 8% | IEA |
| Solar output growth, 2026 (f) | ≈600 TWh — matching the 2025 record; similar in 2027 | IEA |
| Solar vs wind | solar overtakes wind in 2026 (2nd-largest renewable after hydro) | IEA |
| Nuclear generation, 2027 (f) | more than +4% | IEA |
| Gas-fired output | broadly flat in 2026; rebound expected in 2027 | IEA |
Prices: one shock, four different bills
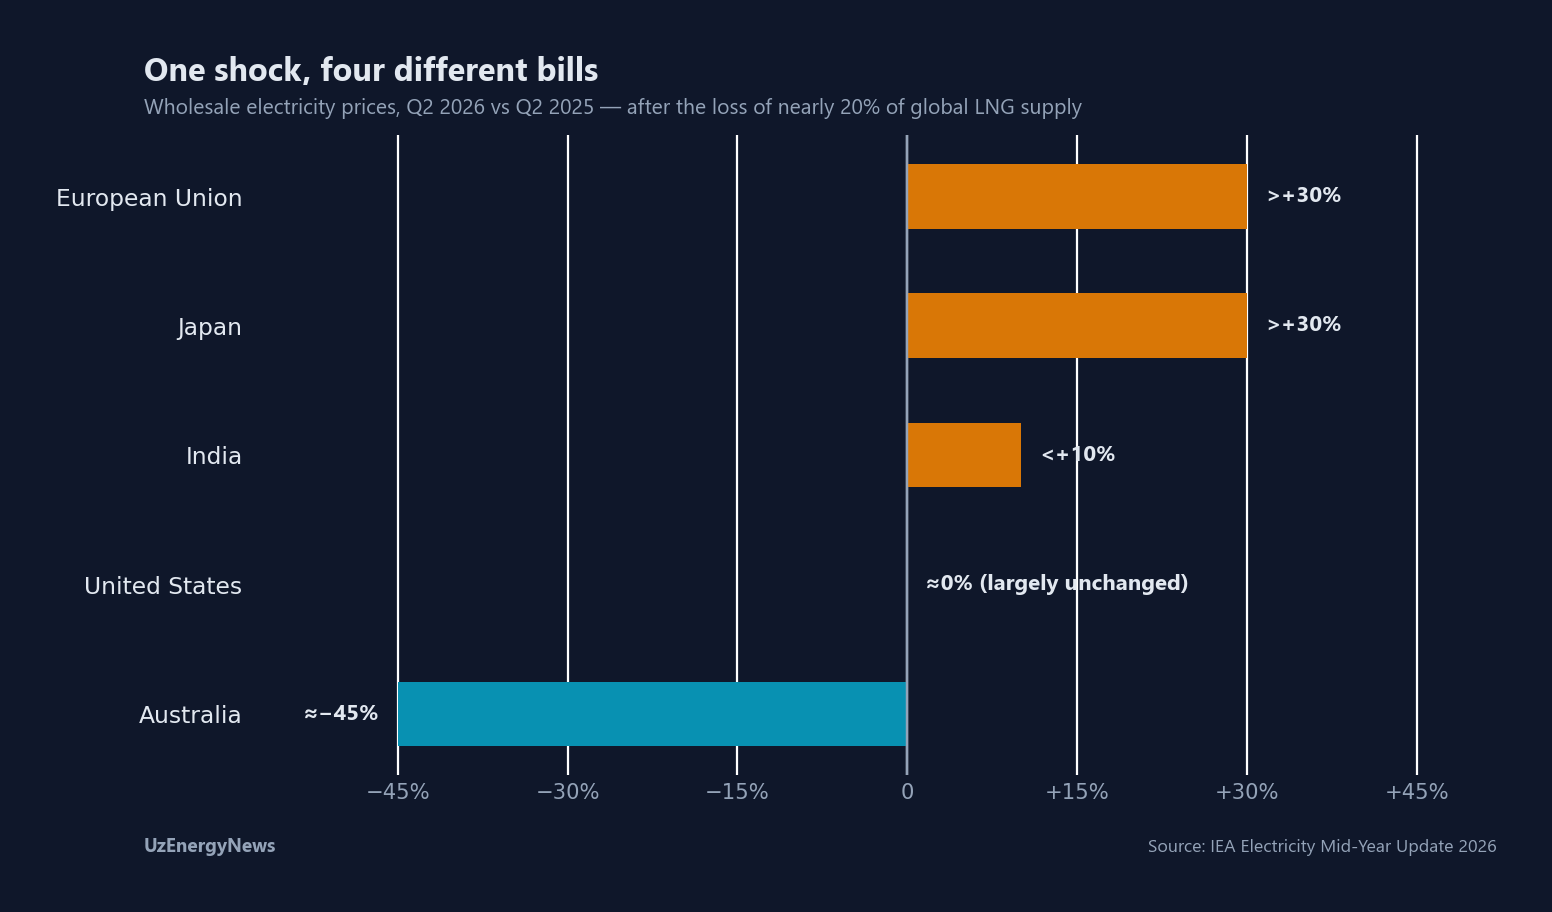
The closure of the Strait of Hormuz removed nearly 20 percent of global LNG supply, and the price consequences sorted the world's power markets by their fuel exposure. Wholesale electricity prices in the European Union and Japan stood more than 30 percent above their year-earlier level in the second quarter of 2026; the United States, insulated by domestic gas, was largely unchanged; India rose by less than 10 percent; Australia, riding a rapid build-out of renewables and battery storage, fell by about 45 percent. The lesson is structural rather than cyclical: exposure to imported fuel has become the single largest determinant of what an economy pays for electricity in a crisis, and the renewables share is the insulation. The countries at the favourable end of the divergence are not those with the cheapest fuel but those that need the least of it.
| Market | Wholesale price, Q2 2026 vs Q2 2025 |
|---|---|
| European Union | more than +30% |
| Japan | more than +30% |
| India | less than +10% |
| United States | largely unchanged |
| Australia | about −45% |
Emissions and what the numbers change
The carbon arithmetic closes the set: the IEA expects power-sector emissions to rise by only about 1 percent in 2026 and to remain broadly flat in 2027, while demand grows at close to 4 percent — a system that adds an India-sized increment in two years while holding emissions level has, in engineering terms, already changed regimes. Precision about the mix milestone protects it from overclaiming: shares are measured in energy while reliability is tested in hours, and a grid can be renewable-majority on an annual basis yet fossil-dependent on a windless winter evening. What the mid-year numbers change is the centre of gravity of every planning question that follows. When the largest source of electricity is variable, the binding constraints migrate from fuel supply to system capability — storage, grids, interconnection, flexible demand and firm low-carbon capacity, the constraint set this publication has traced from the global grid investment shortfall to the connection queues pacing the artificial-intelligence build-out. Countries that treat the crossover as a finish line will discover, at the first hard winter or record summer, that it was the starting line.
← Back to all analysisSources cited in text and figures: International Energy Agency — Electricity Mid-Year Update 2026 and its executive summary (23 July 2026): demand growth and consumption, generation shares, solar, wind, gas and nuclear output forecasts, regional wholesale price comparisons for Q2 2026, LNG supply disruption, El Niño risk and CO2 outlook; Ember — Global Electricity Review 2026 (July 2026): 2025 actual generation shares (91 countries, about 93 percent of global demand); Ministry of Energy of Uzbekistan via Gazeta.uz and Kun.uz (20-21 July 2026) for the Uzbek demand records cited as regional context. Charts by UzEnergyNews from the figures above; copyrighted charts and tables are not reproduced. Analysis by UzEnergyNews. Figures reflect public sources as of 30 July 2026.