The World Electricity Ecosystem: A $4.6 Trillion Market and the Fleet That Supplies It
The value of electricity consumed worldwide each year now stands at approximately $4.6 trillion, equivalent to 3.9 percent of global GDP. Behind that figure sits a generation fleet of 10,425 GW that is set to nearly triple by 2050. This Weekly Insight introduces the World Electricity Ecosystem 2025–2050 dataset and examines what the two numbers — the market and the fleet — reveal about where electricity matters most to national economies, and what will determine whether the build-out keeps pace with demand.
A market worth $4.6 trillion
When measured at the point of final consumption, the global electricity market is worth roughly $4.6 trillion each year. The figure is derived directly: gross electricity consumption in each economy, multiplied by its all-in average retail price, summed across markets. At a world level this is equivalent to about 3.9 percent of global GDP, which the IMF places near $117 trillion in nominal terms.
The method is deliberately transparent and reproducible. For every economy in the dataset, the ecosystem value equals consumption in terawatt-hours multiplied by the all-in average retail tariff in US cents per kilowatt-hour. The result is then expressed as a share of that country's nominal GDP. The Türkiye figure serves as the calibration point: 361 TWh consumed at an all-in average of 10.91 US cents per kilowatt-hour yields an ecosystem value of $39.4 billion, equal to roughly 2.5 percent of national GDP, a result consistent with publicly reported figures for Türkiye's electricity sector. The same formula has been applied to fifteen economies without adjustment.
This framing treats electricity not as a single commodity price but as the full value that an economy assigns to the power it consumes. It captures generation, networks, retail margins and the taxes and levies embedded in the final tariff, which is why it tracks closely to what households and firms actually pay.
Where electricity carries the most economic weight
Expressing the ecosystem as a share of GDP produces a ranking that differs markedly from a simple ranking by size. South Africa sits at the top at 6.5 percent, followed by Vietnam at 6.0 percent and China at 4.5 percent. The world average of 3.9 percent falls below each of these. The United States, by contrast, sits near the foot of the table at 1.9 percent, alongside Kenya at the same share, with Indonesia and Nigeria lower still at 1.6 percent.
The mechanism behind the ranking is straightforward and has two distinct sources. A high share tends to reflect an electricity-intensive economy, where mining and heavy industry account for a large part of output, combined with a relatively modest nominal GDP. South Africa, Vietnam and China each fit this description. A low share arises in two different ways. In a high-income, services-weighted economy such as the United States, electricity is a smaller fraction of a very large GDP. In a low-access economy such as Nigeria, the low share instead reflects suppressed demand, where consumption is constrained by the limits of supply rather than by the structure of the economy.
The distinction matters for interpretation. A low ecosystem share is not in itself a sign of efficiency, nor a high share a sign of waste. The same indicator describes an advanced services economy and an electricity-constrained one, and the two should not be read in the same way.
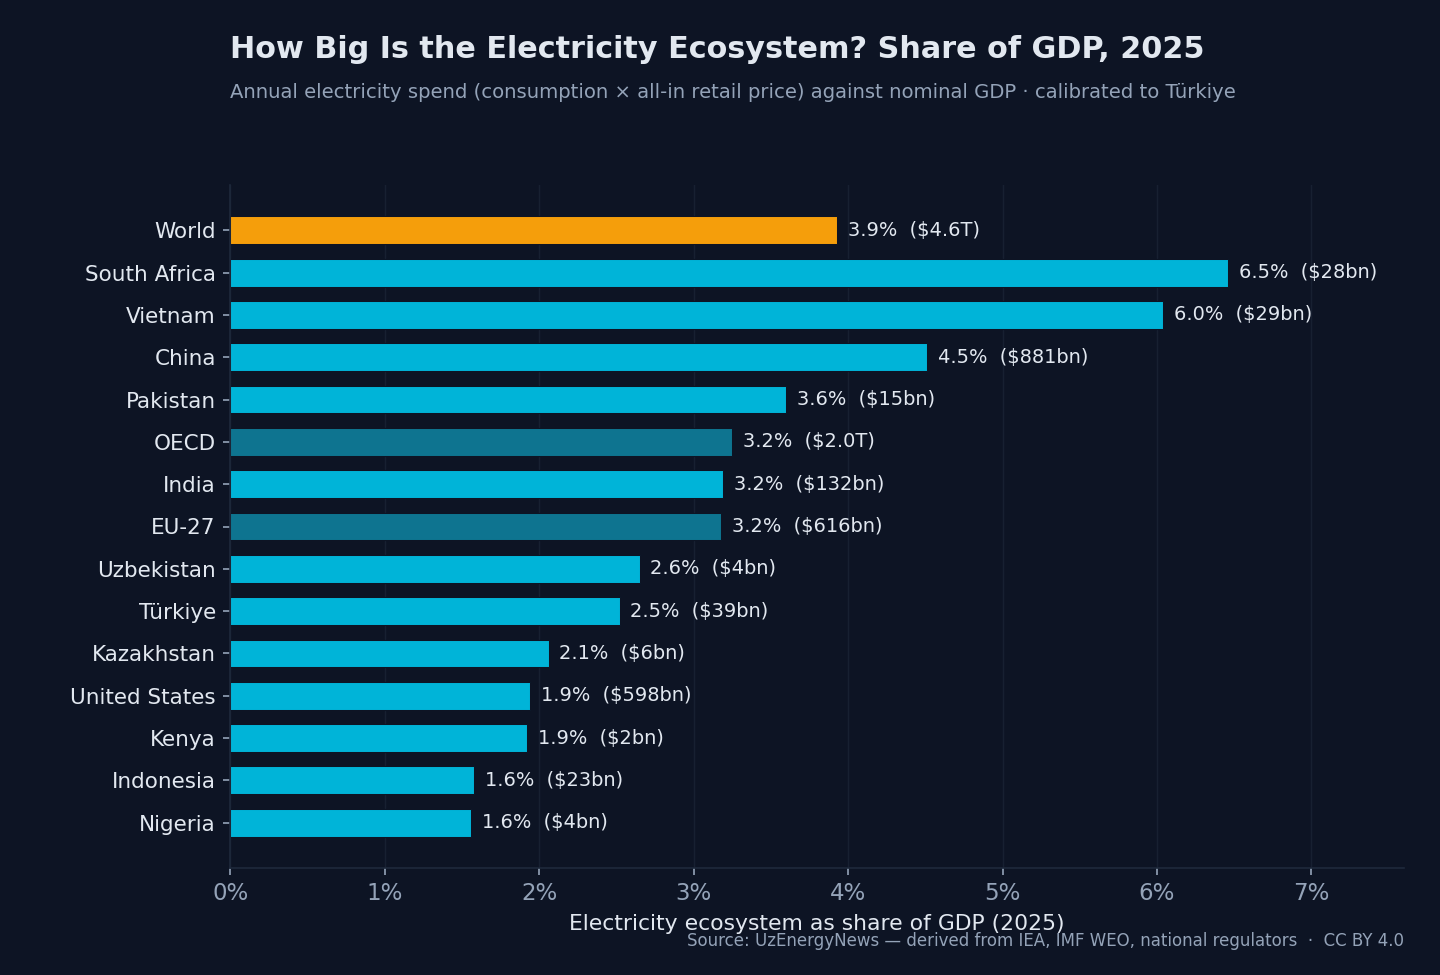
| Economy | Ecosystem value ($bn/yr) | Share of GDP |
|---|---|---|
| South Africa | 28 | 6.5% |
| Vietnam | 29 | 6.0% |
| China | 881 | 4.5% |
| World | 4,600 | 3.9% |
| Pakistan | 15 | 3.6% |
| OECD | 2,000 | 3.25% |
| India | 132 | 3.2% |
| EU-27 | 616 | 3.2% |
| Uzbekistan | 4 | 2.65% |
| Türkiye | 39 | 2.5% |
| Kazakhstan | 6 | 2.1% |
| United States | 598 | 1.9% |
| Kenya | 2 | 1.9% |
| Indonesia | 23 | 1.6% |
| Nigeria | 4.5 | 1.6% |
The Türkiye calibration point
Türkiye anchors the dataset because its figures can be checked against an independent public source. National consumption of 361 TWh, priced at an all-in average of 10.91 US cents per kilowatt-hour, produces an ecosystem value of $39.4 billion. Against a nominal GDP placing the economy among the larger emerging markets, this represents approximately 2.5 percent — a position in the lower half of the ranking that is consistent with Türkiye's diversified, services-inclusive economic structure.
The value of this calibration is methodological. Because the Türkiye result is consistent with publicly reported figures for the sector, the same formula can be applied to the remaining economies with confidence that the approach is sound rather than merely internally consistent. The dataset therefore rests on a publicly grounded anchor rather than on an unverified model.
The fleet behind the market
The market described above is supplied by an installed generation fleet of 10,425 GW as of 2025. Under the dataset's central projection, that fleet expands to approximately 30,000 GW by 2050, an increase of 2.9 times. Over the same period, electricity consumption rises from 31,779 TWh to 58,400 TWh, an increase of about 1.8 times. The capacity figure grows faster than consumption because the additions are dominated by solar and wind, which generate fewer hours per year of installed capacity than the thermal plant they displace, so that more gigawatts are required to deliver each additional terawatt-hour.
The composition of the fleet changes as much as its size. The renewable share of installed capacity rises from 28 percent in 2013 to 49 percent in 2025, and is projected to reach 80 percent by 2050. Within that shift, solar capacity expands from 2,300 GW in 2025 to 16,000 GW in 2050, wind from 1,250 GW to 4,700 GW, while coal declines from 2,180 GW to roughly 900 GW.
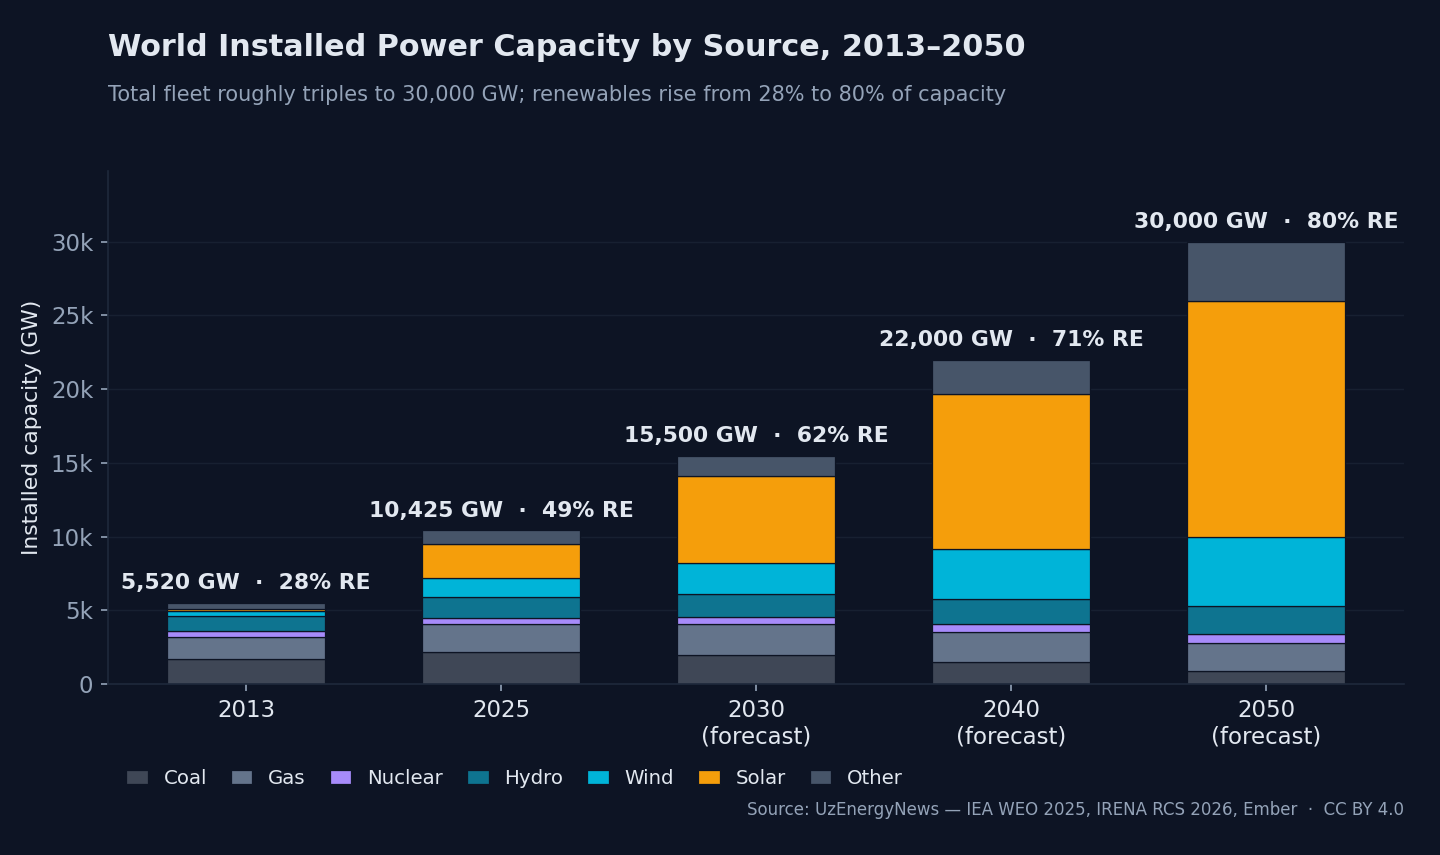
| Source | 2025 (GW) | 2050 (GW) | 2025 share | 2050 share |
|---|---|---|---|---|
| Solar | 2,300 | 16,000 | 22% | 53% |
| Wind | 1,250 | 4,700 | 12% | 16% |
| Hydro | 1,420 | 1,900 | 14% | 6% |
| Nuclear | 420 | 647 | 4% | 2% |
| Gas | 1,900 | 1,850 | 18% | 6% |
| Coal | 2,180 | 900 | 21% | 3% |
| Other | 955 | 4,003 | 9% | 13% |
| Total | 10,425 | ~30,000 | 100% | 100% |
| of which renewable | 49% | 80% |
Why more gigawatts buy less energy
The gap between the 2.9-times growth in capacity and the 1.8-times growth in consumption is the central technical feature of the transition, and it has practical consequences. A solar plant in a typical location operates at the equivalent of full output for roughly fifteen to twenty percent of the year; a combined-cycle gas plant or a coal unit can exceed fifty percent. Replacing dispatchable thermal capacity with variable renewable capacity therefore requires considerably more installed gigawatts to serve the same demand.
This is not a deficiency of renewable generation; it is a structural characteristic of the resource. Its consequence, however, is that the system must build more than the headline demand growth alone would suggest, and that it must invest in the networks, storage and flexibility needed to manage output that varies with the weather and the time of day. The scale of the build-out is therefore set not only by how much electricity the world will consume, but by the physical properties of the plant that will supply it.
The grid is the binding constraint
A fleet that nearly triples in size cannot be connected by generation investment alone. The world currently invests on the order of $400 billion a year in electricity networks. In the European Union, the Grids Package envisages €1.2 trillion of network investment by 2040, and the largest operators — among them Iberdrola, Enel and E.ON — already commit between €10 billion and €17 billion each per year. These are the figures associated with networks that are, on the whole, adequately funded.
In much of the developing world the position is different. Networks there are chronically underfunded relative to the generation they are expected to carry, which constrains the rate at which new capacity can be connected and delivered to consumers. For reference, Türkiye's distribution sector invests on the order of $3.8 billion a year, with $18.5 billion of capital expenditure planned across the fifth tariff period from 2026 to 2030. The transmission and management of electricity in an increasingly electrified economy is, in this respect, as critical to national and international security as the generation technology itself.
The two bottlenecks for developing markets
The dataset connects directly to the central finding of our flagship Emerging Energy Outlook 2026. The ecosystem will expand on both measures examined here — capacity by 2.9 times and consumption by roughly 1.8 times — and the developing world will account for the greater part of that growth. The constraint on these economies is not the willingness to build, since almost every country examined maintains a renewables target and an electrification programme.
Two bottlenecks instead determine the pace. The first is the cost of capital: utility-scale generation in developing economies is financed at two to three times the cost prevailing in the advanced economies, which raises the delivered cost of every project before a single unit of energy is produced. The second is the condition of the grid, which is older, less efficient and persistently underfunded in precisely the markets where demand is growing fastest. The rate at which the global fleet reaches its projected size will therefore be governed less by the decision to build than by the cost of finance and the capacity of the network to absorb new generation. Viewed in these terms, investment in electricity infrastructure is a strategic commitment to a country's next three decades, rather than current expenditure alone.
What the dataset adds
The World Electricity Ecosystem 2025–2050 dataset brings the market and the fleet into a single, comparable frame. It allows the value an economy assigns to its electricity to be set alongside the physical fleet that supplies it, and it makes both figures comparable across fifteen economies on a consistent basis. The intention is to provide a reference point that regulators, lenders and analysts can use directly, with each figure traceable to a public source and the Türkiye anchor independently verified.
The dataset is published under a Creative Commons Attribution 4.0 licence as part of UzEnergyNews Open Data, and the underlying figures are available for reuse with attribution.
Download the dataset (CSV) →Sources: IEA (World Energy Outlook 2025, Electricity 2026, World Energy Investment); IRENA (Renewable Capacity Statistics 2026); Ember; IMF (World Economic Outlook); U.S. Energy Information Administration; Eurostat; national energy plans. Türkiye anchor: EPDK; Ministry of Energy and Natural Resources. Dataset: World Electricity Ecosystem 2025–2050, UzEnergyNews Open Data (CC BY 4.0). Figures reflect mid-2026 public sources.