·--:--:-- ·İstanbul UTC+3 · Canlı
EN TR
SON DAKİKA
…
🛢 Brent Crude
…
—
🛢 WTI Crude
…
—
🔥 Natural Gas (NG)
…
—
💵 USD/TRY
…
—
💵 USD/UZS
…
—
💵 EUR/USD
…
—
🇪🇺 TTF GAS
…
—
UZENERGYNEWS · DATA

Open Data

Our own public-source datasets, plus a curated directory of open energy data — for analysts, lenders and regulators.

Flagship dataset

The World Electricity Ecosystem, 2025–2050

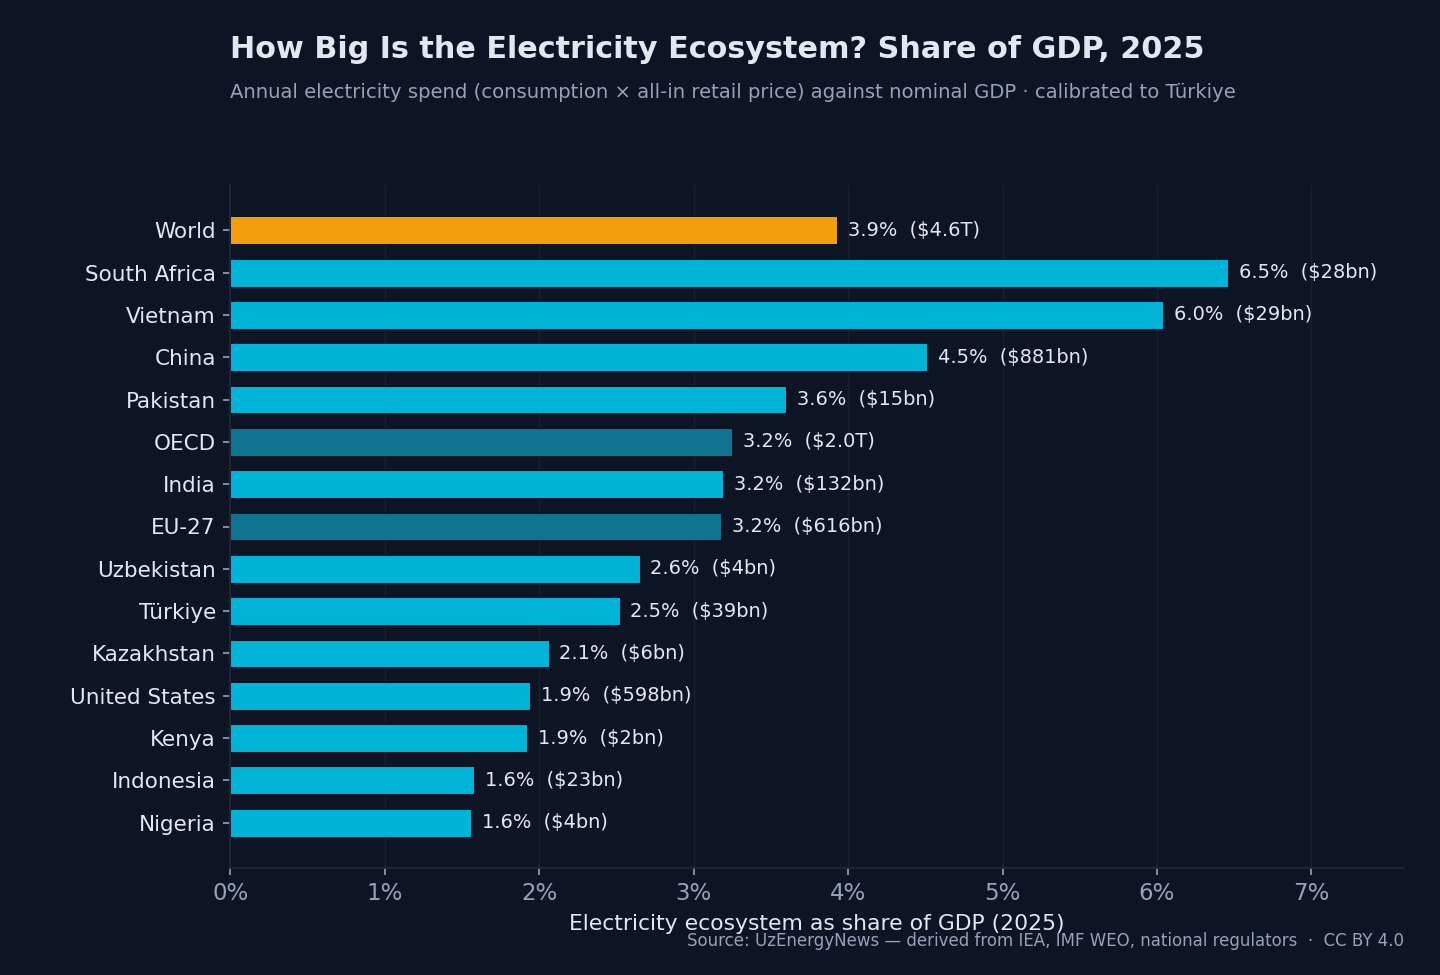
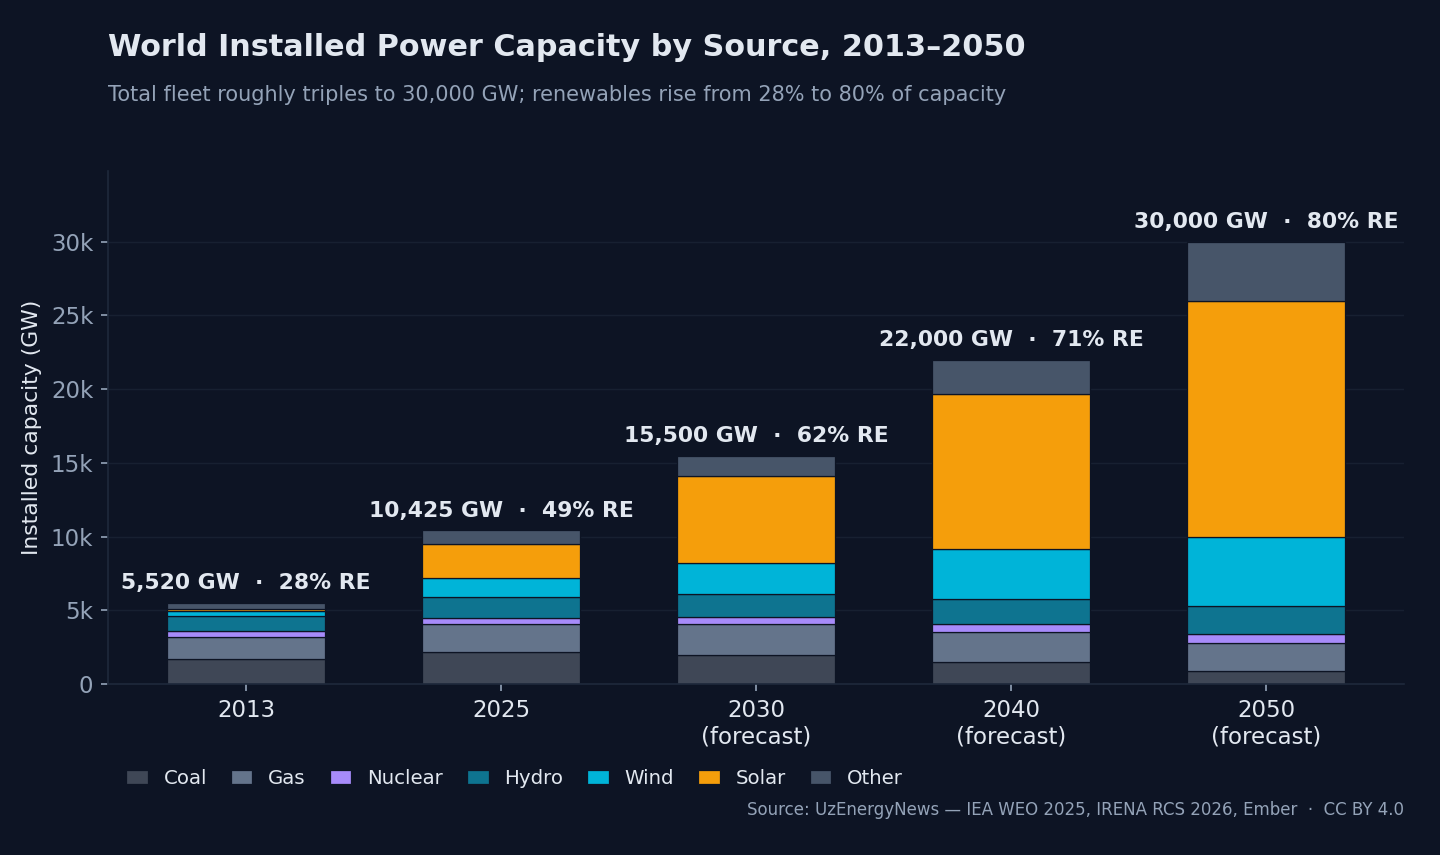
How big is the world's electricity ecosystem in money, and what share of GDP does it represent? We size the annual electricity spend of 15 economies — ten emerging markets plus China, the United States, the EU-27, the OECD and the world — and set it against the power fleet that has to triple by 2050. The method is calibrated to Türkiye's published figure and applied consistently across every economy.
≈ $4.6T
World electricity ecosystem per year (consumption × all-in retail price)
≈ 3.9%
of world GDP ($117T, IMF WEO)
× 2.9
installed capacity growth to 2050 (10,425 → 30,000 GW)
80%
renewables share of capacity by 2050 (28% in 2013)
Bar chart: electricity ecosystem as a share of GDP in 2025 for 15 economies, from South Africa and Vietnam at about 6.5% down to Nigeria and Indonesia near 1.6%, with the world at about 3.9%.
Electricity ecosystem (annual spend) as a share of GDP, 2025 — calibrated to Türkiye's published figure and applied to every economy.
Stacked bar chart: world installed power capacity by source from 2013 to 2050, rising from 5,520 GW to 30,000 GW as solar and wind expand and the renewables share climbs from 28% to 80%.
World installed power capacity by source, 2013–2050 (actual to 2025, then an IEA net-zero-aligned trajectory).

Ecosystem value = gross electricity consumption × all-in average retail price (a retail-spend proxy anchored to Türkiye's 39.4 bn USD / ~2.5% of GDP). Aggregates (World, OECD, EU-27) overlap individual countries and are not additive. Electricity-intensive economies with smaller nominal GDP (South Africa, Vietnam) therefore sit highest in the ranking. 2035–2050 capacity follows national plans and IEA scenarios; figures beyond 2035 are indicative. Derived by UzEnergyNews from IEA, IRENA, Ember, IMF WEO, EIA, Eurostat and national plans — a derived compilation, not a re-hosted database.

↓ Download the dataset (CSV)
🟡UzEnergyNews Datasets
Compiled by us from public sources — free to download and cite.
🔵Open Data Directory
Curated external sources, open-licensed (CC0 / CC BY). We link to the original — we do not re-host.